 |
| Market Cap | 2.09B | EPS (ttm) | -0.35 |
| P/E | - | EPS this Y | 320.00% |
| Forward P/E | 43.93 | EPS next Y | 117.80% |
| PEG | - | EPS past 5Y | 19.48% |
| P/S | 1.35 | EPS next 5Y | 3.90% |
| P/B | 4.36 | EPS Q/Q | -135.10% |
| Dividend | - | Sales Q/Q | -16.93% |
| Insider Own | 1.86% | Inst Own | 88.88% |
| Insider Trans | -1.72% | Inst Trans | -6.01% |
| Short Float | 4.97% | Earnings | May 07/a |
| Analyst Recom | 1.43 | Target Price | 24.18 |
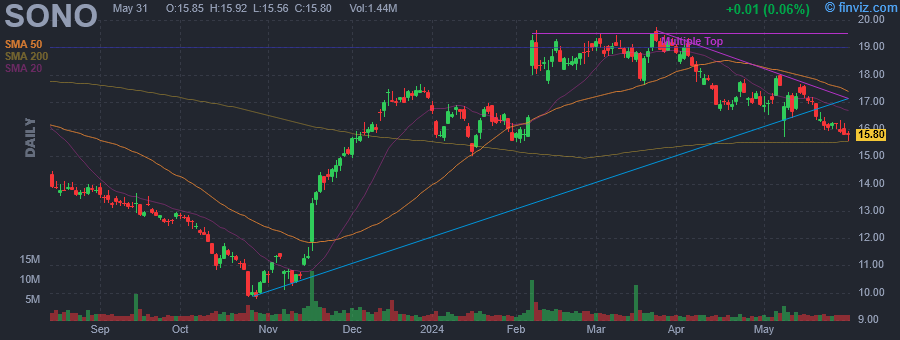
| Avg Volume | 1.88M | 52W Range | 9.78 - 21.98 |
|
|
|
|
Sonos, Inc. engages in the provision of multi-room wireless audio products. It supports streaming services and provides access to music, Internet radio, podcasts and audiobooks, with control from Android smartphones, iPhone or iPad. The company was founded by Mai Trung, John MacFarlane, Craig A. Shelburne and Thomas S. Cullen in August 2002 and is headquartered in Santa Barbara, CA. |
| Insider Trading |
Relationship |
Date |
Transaction |
Cost |
#Shares |
Value ($) |
#Shares Total |
SEC Form 4 |
| Coles Joanna | Director | May 06 '24 | Sale | 17.23 | 905 | 15,593 | 22,759 | May 08 04:15 PM | | Mason Christopher Scott | Principal Accounting Officer | Apr 10 '24 | Option Exercise | 11.28 | 20,000 | 225,500 | 139,179 | Apr 12 04:36 PM | | Mason Christopher Scott | Principal Accounting Officer | Apr 10 '24 | Sale | 17.62 | 20,000 | 352,400 | 119,179 | Apr 12 04:36 PM | | Coles Joanna | Director | Apr 04 '24 | Sale | 19.16 | 905 | 17,340 | 23,664 | Apr 08 04:27 PM | | Coles Joanna | Director | Mar 04 '24 | Sale | 19.35 | 905 | 17,512 | 13,913 | Mar 06 04:03 PM |
|
|
 |
 |
| Market Cap | 1.64B | EPS (ttm) | 1.26 |
| P/E | 35.19 | EPS this Y | 82.66% |
| Forward P/E | 28.52 | EPS next Y | 16.89% |
| PEG | 23.46 | EPS past 5Y | 29.03% |
| P/S | 8.95 | EPS next 5Y | 1.50% |
| P/B | 9.75 | EPS Q/Q | 38.06% |
| Dividend | 0.58% | Sales Q/Q | 13.17% |
| Insider Own | 5.00% | Inst Own | 83.79% |
| Insider Trans | -56.63% | Inst Trans | 0.45% |
| Short Float | 7.66% | Earnings | May 06/b |
| Analyst Recom | 1.67 | Target Price | 51.00 |
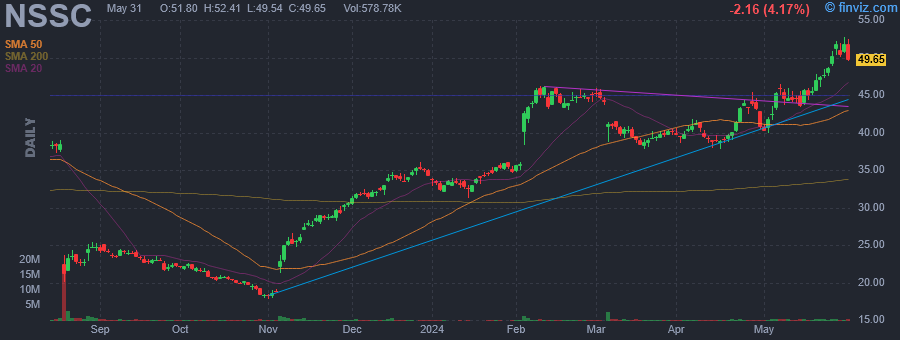
| Avg Volume | 387.73K | 52W Range | 17.76 - 46.41 |
|
|
|
|
Napco Security Technologies, Inc. engages in the development, manufacture, and distribution of security products. Its divisions include NAPCO Security Systems, Alarm Lock, Marks USA Custom Locking, and Napco Access Pro. The company was founded in 1969 and is headquartered in Amityville, NY. |
| Insider Trading |
Relationship |
Date |
Transaction |
Cost |
#Shares |
Value ($) |
#Shares Total |
SEC Form 4 |
| SOLOWAY RICHARD | CEO, Chairman, Secy | May 08 '24 | Sale | 44.20 | 250,000 | 11,050,450 | 1,406,010 | May 08 04:15 PM | | SOLOWAY RICHARD | Pres, CEO, Chairman, Secy | Apr 08 '24 | Sale | 40.75 | 50,000 | 2,037,500 | 1,656,010 | Apr 10 05:15 PM | | BUCHEL KEVIN S | Executive Vice President | Mar 12 '24 | Sale | 40.36 | 50,000 | 2,018,050 | 62,739 | Mar 14 04:23 PM | | SOLOWAY RICHARD | Pres, CEO, Chairman, Secy | Mar 08 '24 | Sale | 40.75 | 2,000,000 | 81,500,000 | 1,706,010 | Mar 12 04:36 PM | | SOLOWAY RICHARD | President, CEO and Secretary | Feb 14 '24 | Sale | 45.12 | 28,000 | 1,263,360 | 3,706,010 | Feb 15 04:17 PM |
|
|
|
 |
| Market Cap | 1.47B | EPS (ttm) | 0.93 |
| P/E | 26.36 | EPS this Y | 13.21% |
| Forward P/E | 9.95 | EPS next Y | 11.97% |
| PEG | 5.27 | EPS past 5Y | -14.59% |
| P/S | 0.03 | EPS next 5Y | 5.00% |
| P/B | 0.75 | EPS Q/Q | 25.14% |
| Dividend | 2.51% | Sales Q/Q | -13.55% |
| Insider Own | 3.49% | Inst Own | 105.35% |
| Insider Trans | -3.28% | Inst Trans | 0.93% |
| Short Float | 9.31% | Earnings | Apr 25/a |
| Analyst Recom | 2.60 | Target Price | 28.00 |
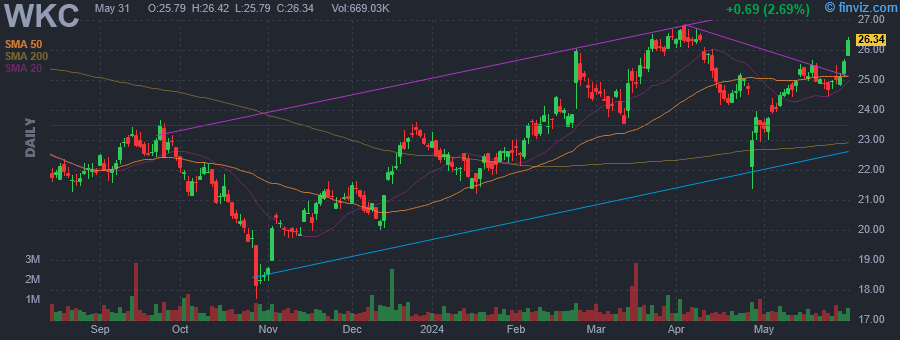
| Avg Volume | 594.05K | 52W Range | 17.69 - 26.83 |
|
|
|
|
World Kinect Corp. engages in the distribution of fuel and related products and services in the aviation, marine, and land transportation industries. It operates through the following segments: Aviation, Land, and Marine. The Aviation segment offers fuel supply and comprehensive service solutions globally. The Land segment provides fuel, lubricants, heating oil, natural gas, power, and related products and related services to commercial, industrial, residential and government customers. The Marine segment is involved in marketing products and services to local and international customers. Its solutions include oil and energy procurement, distribution and storage, operations support, financial, consulting, and technology services. The company was founded in July 1984 and is headquartered in Miami, FL. |
| Insider Trading |
Relationship |
Date |
Transaction |
Cost |
#Shares |
Value ($) |
#Shares Total |
SEC Form 4 |
| BAKSHI KEN | Director | May 06 '24 | Sale | 24.07 | 10,936 | 263,230 | 41,545 | May 08 04:15 PM | | STEBBINS PAUL H | Director | Mar 01 '24 | Sale | 24.65 | 40,000 | 986,000 | 35,375 | Mar 04 09:55 PM | | STEBBINS PAUL H | Director | Feb 29 '24 | Sale | 24.37 | 20,000 | 487,400 | 75,375 | Mar 04 09:55 PM |
|
|
| |
 |
| Market Cap | 4.74B | EPS (ttm) | 1.23 |
| P/E | 21.98 | EPS this Y | -7.26% |
| Forward P/E | 22.18 | EPS next Y | 5.87% |
| PEG | 0.82 | EPS past 5Y | 28.37% |
| P/S | 12.46 | EPS next 5Y | 26.82% |
| P/B | 1.46 | EPS Q/Q | -5.37% |
| Dividend | 4.28% | Sales Q/Q | 23.99% |
| Insider Own | 0.76% | Inst Own | 97.37% |
| Insider Trans | -12.87% | Inst Trans | 0.72% |
| Short Float | 4.36% | Earnings | Apr 24/a |
| Analyst Recom | 1.23 | Target Price | 28.23 |
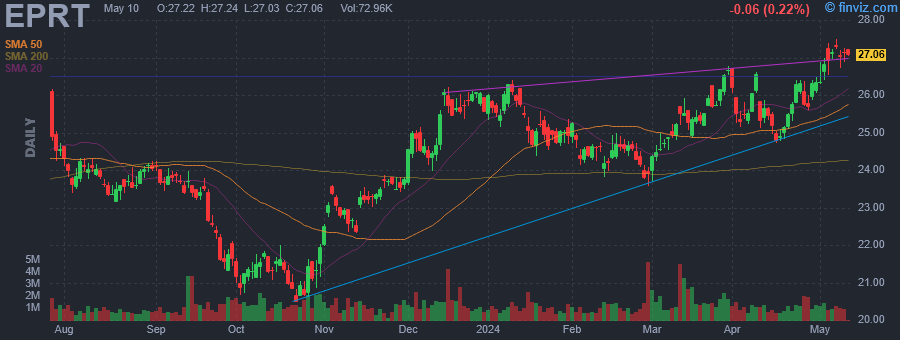
| Avg Volume | 1.45M | 52W Range | 20.49 - 27.49 |
|
|
|
|
Essential Properties Realty Trust, Inc. engages in the acquisition, ownership, and management of single-tenant properties that are net leased on a long-term basis. Its portfolio includes the following: Captain D's, Art Van Furniture, Mister and Zips Car Wash, AMC Theaters, Perkins, 84 Lumber, Mirabito, Ruby Tuesday, and White Oak Station. The company was founded on January 12, 2018 and is headquartered in Princeton, NJ. |
| Insider Trading |
Relationship |
Date |
Transaction |
Cost |
#Shares |
Value ($) |
#Shares Total |
SEC Form 4 |
| Sautel Stephen D | Director | May 07 '24 | Sale | 27.39 | 10,000 | 273,900 | 237,492 | May 08 04:13 PM | | Sautel Stephen D | Director | May 06 '24 | Sale | 27.09 | 25,000 | 677,250 | 247,492 | May 08 04:13 PM | | Mavoides Peter M. | President and CEO | Mar 26 '24 | Sale | 26.01 | 9,188 | 238,980 | 554,904 | Mar 28 04:44 PM | | Mavoides Peter M. | President and CEO | Mar 22 '24 | Sale | 26.04 | 1,700 | 44,268 | 564,092 | Mar 25 04:16 PM | | Mavoides Peter M. | President and CEO | Mar 21 '24 | Sale | 26.00 | 100 | 2,600 | 565,792 | Mar 25 04:16 PM |
|
|
|
 |
| Market Cap | 906.75M | EPS (ttm) | 5.18 |
| P/E | 5.55 | EPS this Y | -9.56% |
| Forward P/E | 5.29 | EPS next Y | 16.43% |
| PEG | 1.39 | EPS past 5Y | - |
| P/S | 0.42 | EPS next 5Y | 4.00% |
| P/B | 0.78 | EPS Q/Q | 10.97% |
| Dividend | - | Sales Q/Q | -0.44% |
| Insider Own | 7.39% | Inst Own | 83.00% |
| Insider Trans | -1.24% | Inst Trans | -0.59% |
| Short Float | 2.96% | Earnings | May 01/a |
| Analyst Recom | 1.67 | Target Price | 35.67 |
| Avg Volume | 329.58K | 52W Range | 20.04 - 35.93 |
|
|
|
|
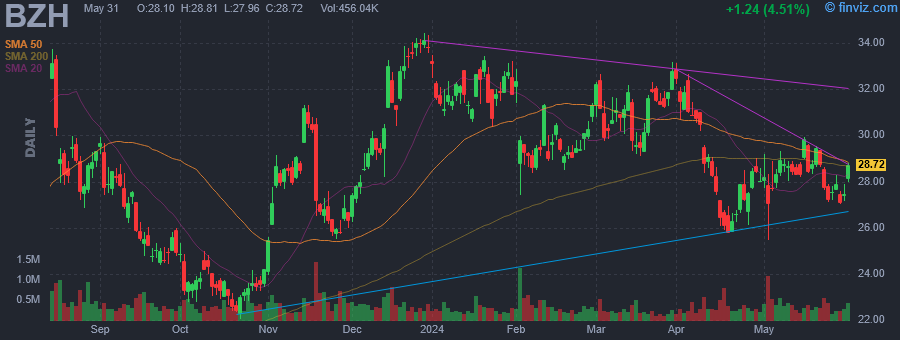
Beazer Homes USA, Inc. engages in the design and sale of single-family and multi-family homes. It operates through the following geographical segments: West, East, and Southeast. The West segment includes Arizona, California, Nevada, and Texas. The East segment consists of Delaware, Indiana, Maryland, Tennessee, and Virginia. The Southeast segment focuses on the Florida, Georgia, North Carolina, and South Carolina. The company was founded in 1985 and is headquartered in Atlanta, GA. |
| Insider Trading |
Relationship |
Date |
Transaction |
Cost |
#Shares |
Value ($) |
#Shares Total |
SEC Form 4 |
| Belknap Keith L Jr | EVP, General Counsel | May 07 '24 | Sale | 29.07 | 14,215 | 413,230 | 181,604 | May 08 04:12 PM | | Belknap Keith L Jr | EVP, General Counsel | May 06 '24 | Sale | 28.31 | 15,000 | 424,650 | 195,819 | May 08 04:12 PM |
|
|
| |
 |
| Market Cap | 106.91B | EPS (ttm) | 1.20 |
| P/E | 60.76 | EPS this Y | 13.52% |
| Forward P/E | 27.58 | EPS next Y | 13.30% |
| PEG | 4.90 | EPS past 5Y | -2.05% |
| P/S | 7.27 | EPS next 5Y | 12.40% |
| P/B | 5.36 | EPS Q/Q | 61.01% |
| Dividend | - | Sales Q/Q | 13.78% |
| Insider Own | 0.45% | Inst Own | 93.78% |
| Insider Trans | -4.24% | Inst Trans | 0.92% |
| Short Float | 0.90% | Earnings | Apr 24/b |
| Analyst Recom | 1.41 | Target Price | 81.70 |
| Avg Volume | 6.35M | 52W Range | 48.35 - 74.39 |
|
|
|
|
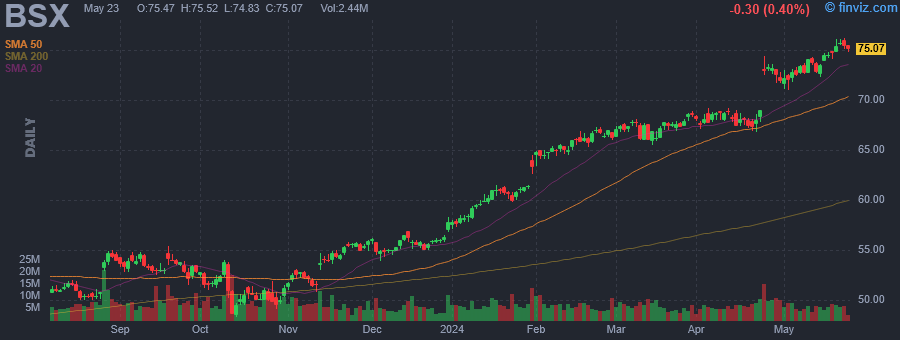
Boston Scientific Corp. engages in the development, manufacture, and marketing of medical devices that are used in interventional medical procedures. It operates through the MedSurg and Cardiovascular segments. The MedSurg segment includes Endoscopy, Urology, and Neuromodulation. The Cardiovascular segment consists of Cardiology and Peripheral Interventions. The company was founded by John E. Abele and Pete Michael Nicholas on June 29, 1979 and is headquartered in Marlborough, MA. |
| Insider Trading |
Relationship |
Date |
Transaction |
Cost |
#Shares |
Value ($) |
#Shares Total |
SEC Form 4 |
| Dockendorff Charles J | Director | May 07 '24 | Sale | 72.70 | 3,946 | 286,874 | 0 | May 08 04:11 PM | | Butcher Arthur C | EVP& Grp Pres, MedSurg & APAC | May 02 '24 | Option Exercise | 0.00 | 2,102 | 0 | 31,039 | May 06 04:17 PM | | Sorenson John Bradley | EVP, Global Operations | May 02 '24 | Option Exercise | 0.00 | 4,203 | 0 | 54,841 | May 06 04:18 PM | | Sorenson John Bradley | EVP, Global Operations | May 01 '24 | Option Exercise | 17.26 | 17,587 | 303,552 | 68,225 | May 02 04:46 PM | | Carruthers Wendy | EVP, Human Resources | May 01 '24 | Option Exercise | 19.31 | 4,263 | 82,306 | 55,331 | May 02 04:42 PM |
|
|
|
 |
| Market Cap | 4.87B | EPS (ttm) | 4.46 |
| P/E | 30.36 | EPS this Y | 580.10% |
| Forward P/E | 10.22 | EPS next Y | 24.94% |
| PEG | 0.85 | EPS past 5Y | -30.49% |
| P/S | 0.80 | EPS next 5Y | 35.55% |
| P/B | 1.93 | EPS Q/Q | 1043.87% |
| Dividend | 2.55% | Sales Q/Q | 7.44% |
| Insider Own | 1.05% | Inst Own | 87.07% |
| Insider Trans | -0.62% | Inst Trans | -0.60% |
| Short Float | 1.12% | Earnings | May 01/a |
| Analyst Recom | 1.75 | Target Price | 151.57 |
| Avg Volume | 171.14K | 52W Range | 103.82 - 138.00 |
|
|
|
|
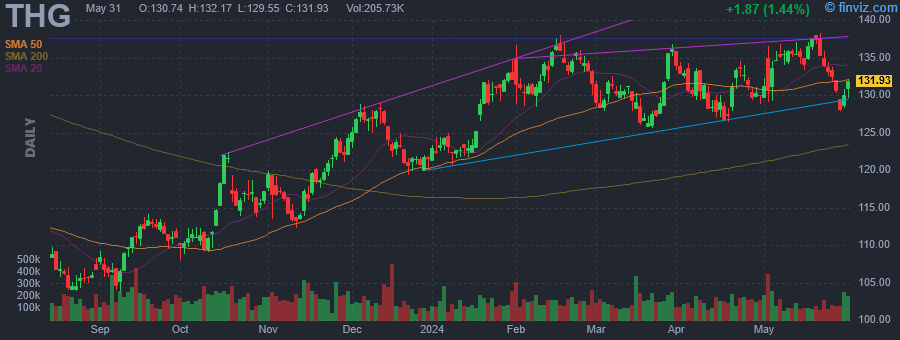
The Hanover Insurance Group, Inc. is a holding company that engages in the provision of property and casualty products and services. It operates through the following segments: Core Commercial, Specialty, Personal Lines and Other. The Core Commercial segment includes commercial multiple peril, commercial automobile, workers compensation and other core commercial coverage, such as general liability, commercial umbrella and monoline property. The Specialty focuses on Professional and Executive Lines, Specialty Property & Casualty, Marine, Surety and Other. The Personal Lines segment involves personal automobile, homeowners and other personal coverage. The Other segment operates through Opus Investment Management, Inc. The company was founded in 1852 and is headquartered in Worcester, MA. |
| Insider Trading |
Relationship |
Date |
Transaction |
Cost |
#Shares |
Value ($) |
#Shares Total |
SEC Form 4 |
| Lee Willard T | Executive Vice President | May 07 '24 | Sale | 135.94 | 1,000 | 135,940 | 4,398 | May 08 04:11 PM | | BARNES WARREN E. | SVP & Princpl. Accntg. Officer | Feb 27 '24 | Sale | 133.87 | 840 | 112,451 | 2,798 | Feb 28 04:03 PM | | Roche John C | President and CEO | Feb 16 '24 | Option Exercise | 54.61 | 22,305 | 1,218,076 | 113,979 | Feb 20 04:12 PM | | BARNES WARREN E. | SVP & Princpl. Accntg. Officer | Feb 02 '24 | Sale | 131.14 | 500 | 65,572 | 3,612 | Feb 05 04:14 PM | | Carlin Jane D | Director | Aug 07 '23 | Sale | 114.04 | 1,246 | 142,090 | 0 | Aug 08 04:19 PM |
|
|
| |
 |
| Market Cap | 1.76B | EPS (ttm) | -0.21 |
| P/E | - | EPS this Y | 763.92% |
| Forward P/E | 13.59 | EPS next Y | 83.04% |
| PEG | - | EPS past 5Y | - |
| P/S | 1.32 | EPS next 5Y | - |
| P/B | 1.20 | EPS Q/Q | -407.35% |
| Dividend | - | Sales Q/Q | 18.44% |
| Insider Own | 6.39% | Inst Own | 90.42% |
| Insider Trans | -0.12% | Inst Trans | -3.50% |
| Short Float | 2.56% | Earnings | Apr 24/a |
| Analyst Recom | 1.33 | Target Price | 15.40 |
| Avg Volume | 1.72M | 52W Range | 6.18 - 12.14 |
|
|
|
|
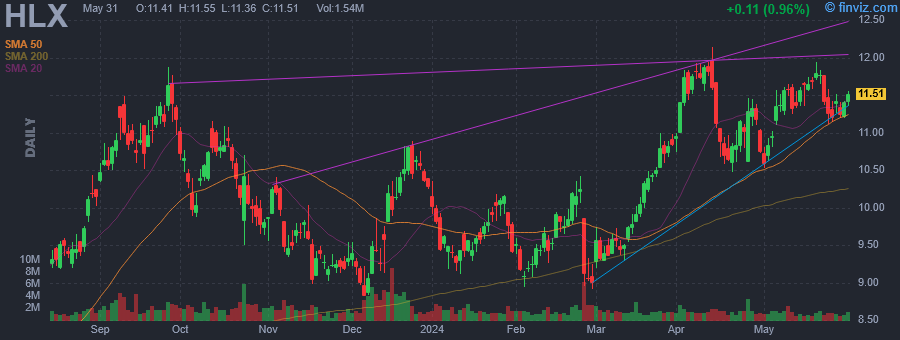
Helix Energy Solutions Group, Inc. is an international offshore energy company. It focuses on subsea construction, maintenance and salvage services to the offshore natural gas and oil industry. The firm also provides specialty services to the offshore energy industry, with a focus on well intervention and robotics operations. The company operates through the following business segments: Well Intervention, Robotics and Production Facilities. The Well Intervention segment offers vessels and related equipment that are used to perform well intervention services primarily in the Gulf of Mexico and North Sea regions. The Robotics segment involves four chartered vessels and also includes ROVs, trenchers and ROVDrills designed to complement offshore construction and well intervention services. The Production Facilities segment includes its investment in the Helix Producer I and Kommandor LLC. The company was founded in 1979 and is headquartered in Houston, TX. |
| Insider Trading |
Relationship |
Date |
Transaction |
Cost |
#Shares |
Value ($) |
#Shares Total |
SEC Form 4 |
| Sparks Scott Andrew | EVP & COO | May 07 '24 | Sale | 11.44 | 12,000 | 137,239 | 282,634 | May 08 04:09 PM | | Staffeldt Erik | EVP & CFO | Mar 06 '24 | Option Exercise | 0.00 | 193,931 | 0 | 527,311 | Mar 08 04:22 PM | | KRATZ OWEN E | PRESIDENT & CEO | Mar 06 '24 | Option Exercise | 0.00 | 237,023 | 0 | 7,878,794 | Mar 08 04:12 PM | | Glassman Diana | Director | Sep 28 '23 | Sale | 11.41 | 6,800 | 77,588 | 27,990 | Sep 29 04:14 PM | | Sparks Scott Andrew | EVP and COO | Aug 18 '23 | Sale | 9.53 | 10,000 | 95,300 | 163,948 | Aug 21 04:06 PM |
|
|
|
 |
| Market Cap | 218.67B | EPS (ttm) | 10.47 |
| P/E | 46.63 | EPS this Y | 12.05% |
| Forward P/E | 23.99 | EPS next Y | 12.99% |
| PEG | 3.49 | EPS past 5Y | 17.86% |
| P/S | 10.98 | EPS next 5Y | 13.36% |
| P/B | 14.30 | EPS Q/Q | -49.85% |
| Dividend | - | Sales Q/Q | 11.75% |
| Insider Own | 0.69% | Inst Own | 84.05% |
| Insider Trans | -1.57% | Inst Trans | -0.73% |
| Short Float | 1.62% | Earnings | Mar 14/a |
| Analyst Recom | 1.79 | Target Price | 619.77 |
| Avg Volume | 3.78M | 52W Range | 331.89 - 638.25 |
|
|
|
|
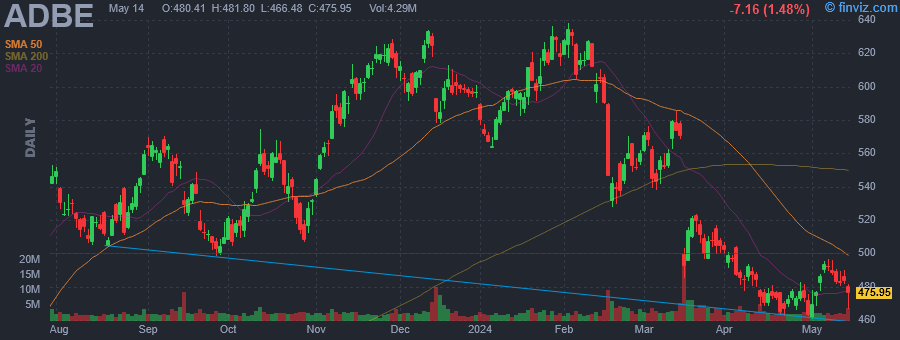
Adobe, Inc. engages in the provision of digital marketing and media solutions. It operates through the following segments: Digital Media, Digital Experience, and Publishing and Advertising. The Digital Media segment offers creative cloud services, which allow members to download and install the latest versions of products, such as Adobe Photoshop, Adobe Illustrator, Adobe Premiere Pro, Adobe Photoshop Lightroom and Adobe InDesign, as well as utilize other tools, such as Adobe Acrobat. The Digital Experience segment provides solutions, including analytics, social marketing, targeting, media optimization, digital experience management, and cross-channel campaign management, as well as premium video delivery and monetization. The Publishing and Advertising segment includes legacy products and services for eLearning solutions, technical document publishing, web application development, and high-end printing. The company was founded by Charles M. Geschke and John E. Warnock in December 1982 and is headquartered in San Jose, CA. |
| Insider Trading |
Relationship |
Date |
Transaction |
Cost |
#Shares |
Value ($) |
#Shares Total |
SEC Form 4 |
| Garfield Mark S. | SVP & CAO | May 06 '24 | Sale | 490.10 | 795 | 389,630 | 3,333 | May 08 04:09 PM | | Belsky Scott | Chief Strategy Officer & EVP | May 02 '24 | Sale | 474.30 | 2,713 | 1,286,776 | 21,114 | May 03 04:57 PM | | Garfield Mark S. | SVP & CAO | Apr 25 '24 | Sale | 468.41 | 97 | 45,436 | 4,128 | Apr 25 07:18 PM | | Durn Daniel | EVP & CFO | Apr 24 '24 | Option Exercise | 0.00 | 606 | 0 | 22,815 | Apr 25 07:19 PM | | Garfield Mark S. | SVP & CAO | Apr 24 '24 | Option Exercise | 0.00 | 191 | 0 | 4,270 | Apr 25 07:18 PM |
|
|
|
 |
| Market Cap | 12.01B | EPS (ttm) | 9.82 |
| P/E | 39.49 | EPS this Y | 26.02% |
| Forward P/E | 29.51 | EPS next Y | 17.39% |
| PEG | 2.20 | EPS past 5Y | 35.06% |
| P/S | 6.12 | EPS next 5Y | 17.91% |
| P/B | 17.84 | EPS Q/Q | 41.45% |
| Dividend | - | Sales Q/Q | 17.73% |
| Insider Own | 18.24% | Inst Own | 80.69% |
| Insider Trans | -30.58% | Inst Trans | -1.64% |
| Short Float | 3.89% | Earnings | Apr 22/a |
| Analyst Recom | 2.12 | Target Price | 447.05 |
| Avg Volume | 286.94K | 52W Range | 197.39 - 421.00 |
|
|
|
Today 04:54PM
|
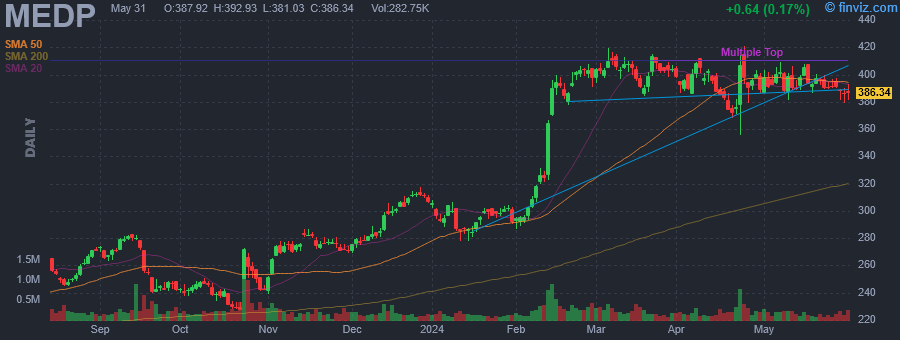
Medpace Holdings Insider Sold Shares Worth $21,129,347, According to a Recent SEC Filing
(MT Newswires) |
|
May-03-24 04:13PM
|
Medpace Holdings Insider Sold Shares Worth $6,553,671, According to a Recent SEC Filing
(MT Newswires) |
|
09:30AM
|
Brokers Suggest Investing in Medpace (MEDP): Read This Before Placing a Bet
(Zacks) |
|
May-01-24 04:59PM
|
Medpace Holdings Insider Sold Shares Worth $6,782,987, According to a Recent SEC Filing
(MT Newswires) |
|
Apr-25-24 06:37PM
|
Analyst Report: Medpace Holdings, Inc.
(Morningstar Research) |
|
12:45PM
|
Is Medpace (MEDP) a Solid Growth Stock? 3 Reasons to Think 'Yes'
(Zacks) |
|
Apr-24-24 10:37AM
|
Medpace Holdings, Inc. (NASDAQ:MEDP) Q1 2024 Earnings Call Transcript
(Insider Monkey) |
|
09:58AM
|
Analyst Report: Medpace Holdings, Inc.
(Morningstar Research) |
|
03:08AM
|
Medpace Holdings Inc (MEDP) Q1 2024 Earnings Call Transcript Highlights: Robust Growth and ...
(GuruFocus.com) |
|
Apr-23-24 10:35PM
|
Q1 2024 Medpace Holdings Inc Earnings Call
(Thomson Reuters StreetEvents) +8.21% |
|
Medpace Holdings, Inc. engages in the provision of outsourced clinical development services to the biotechnology, pharmaceutical and medical device industries. Its services include medical department, clinical trial management, data-driven feasibility, study-start-up, clinical monitoring, regulatory affairs, patient recruitment and retention, medical writing, biometrics and data sciences, pharmacovigilance, core laboratory, laboratories, clinics, and quality assurance. The company was founded by August James Troendle in 1992 and is headquartered in Cincinnati, OH. |
| Insider Trading |
Relationship |
Date |
Transaction |
Cost |
#Shares |
Value ($) |
#Shares Total |
SEC Form 4 |
| Troendle August J. | CEO | May 07 '24 | Sale | 404.48 | 28,032 | 11,338,383 | 720,979 | May 08 04:08 PM | | Troendle August J. | CEO | May 06 '24 | Sale | 401.73 | 24,372 | 9,790,964 | 749,011 | May 08 04:08 PM | | Troendle August J. | CEO | May 02 '24 | Sale | 400.44 | 3,396 | 1,359,894 | 773,383 | May 03 04:07 PM | | Troendle August J. | CEO | May 01 '24 | Sale | 401.56 | 12,934 | 5,193,777 | 776,779 | May 03 04:07 PM | | Troendle August J. | CEO | Apr 30 '24 | Sale | 400.31 | 1,828 | 731,767 | 789,713 | May 01 04:22 PM |
|
|
|
