 |
| Market Cap | 3.34B | EPS (ttm) | 1.39 |
| P/E | 41.07 | EPS this Y | - |
| Forward P/E | - | EPS next Y | - |
| PEG | - | EPS past 5Y | 20.89% |
| P/S | 8.27 | EPS next 5Y | - |
| P/B | 4.84 | EPS Q/Q | 33.84% |
| Dividend | 0.80% | Sales Q/Q | 20.27% |
| Insider Own | 1.33% | Inst Own | 81.02% |
| Insider Trans | -43.85% | Inst Trans | -4.78% |
| Short Float | 1.14% | Earnings | Apr 24/a |
| Analyst Recom | 2.00 | Target Price | 19.00 |
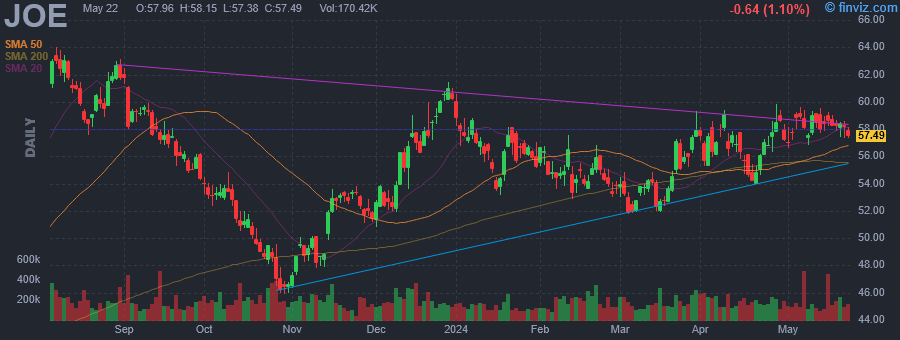
| Avg Volume | 202.17K | 52W Range | 41.25 - 65.99 |
|
|
|
|
The St. Joe Co. engages in real estate development and asset management. It operates through the following segments: Residential, Hospitality, and Commercial. The Residential segment is involved in planning and developing residential communities of various sizes across a wide range of price points and selling home sites to builders and retail consumers. The Hospitality segment focuses on private membership clubs, hotel operations, lodging, restaurants, golf courses, beach clubs, marinas, and other entertainment assets. The Commercial segment includes construction and leasing of multi-family, retail, office and commercial property, cell towers, and other assets. The company was founded in 1936 and is headquartered in Panama City Beach, FL. |
| Insider Trading |
Relationship |
Date |
Transaction |
Cost |
#Shares |
Value ($) |
#Shares Total |
SEC Form 4 |
| BERKOWITZ BRUCE R | Director | May 07 '24 | Sale | 58.29 | 342,900 | 19,987,641 | 18,788,124 | May 07 06:17 PM | | BERKOWITZ BRUCE R | Director | May 06 '24 | Sale | 58.96 | 36,600 | 2,157,936 | 19,131,024 | May 07 06:17 PM | | BERKOWITZ BRUCE R | Director | May 03 '24 | Sale | 58.26 | 57,000 | 3,320,820 | 19,167,624 | May 07 06:17 PM | | BERKOWITZ BRUCE R | Director | Apr 29 '24 | Sale | 59.05 | 2,600 | 153,530 | 19,224,624 | Apr 30 05:16 PM | | BERKOWITZ BRUCE R | Director | Apr 26 '24 | Sale | 59.19 | 1,500 | 88,785 | 19,227,224 | Apr 30 05:16 PM |
|
|
 |
 |
| Market Cap | 32.16B | EPS (ttm) | 5.25 |
| P/E | 9.70 | EPS this Y | -7.24% |
| Forward P/E | 9.15 | EPS next Y | 4.96% |
| PEG | - | EPS past 5Y | -1.04% |
| P/S | 2.13 | EPS next 5Y | -2.94% |
| P/B | 2.65 | EPS Q/Q | -38.18% |
| Dividend | 1.90% | Sales Q/Q | -0.48% |
| Insider Own | 0.73% | Inst Own | 71.93% |
| Insider Trans | -0.11% | Inst Trans | 0.48% |
| Short Float | 2.65% | Earnings | May 01/a |
| Analyst Recom | 1.85 | Target Price | 58.18 |
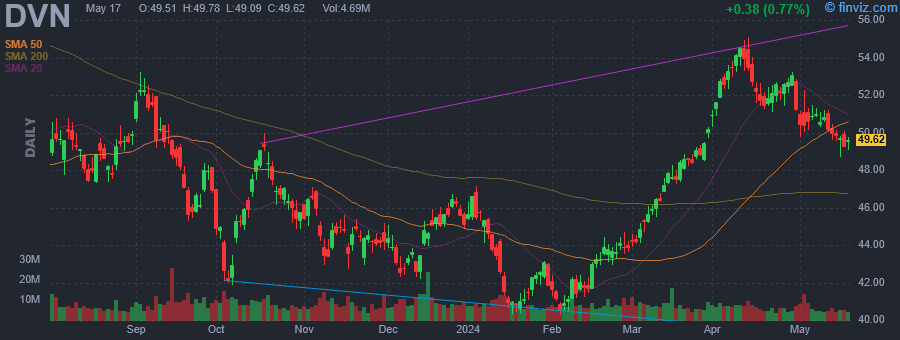
| Avg Volume | 7.67M | 52W Range | 40.28 - 55.09 |
|
|
|
|
Devon Energy Corp. engages in the exploration, development, and production of oil and natural gas properties. It develops and operates Delaware Basin, Eagle Ford, Heavy Oil, Barnett Shale, STACK, and Rockies Oil. The company was founded by J. Larry Nichols and John W. Nichols in 1971 and is headquartered in Oklahoma City, OK. |
| Insider Trading |
Relationship |
Date |
Transaction |
Cost |
#Shares |
Value ($) |
#Shares Total |
SEC Form 4 |
| Cashion Tana K | EVP Human Resources and Admin | May 07 '24 | Sale | 51.04 | 20,000 | 1,020,800 | 104,182 | May 07 06:12 PM | | Muncrief Richard E | President and CEO | Mar 04 '24 | Buy | 44.42 | 15,000 | 666,300 | 1,973,006 | Mar 04 06:15 PM | | Muncrief Richard E | President and CEO | Mar 01 '24 | Option Exercise | 41.53 | 42,582 | 1,768,430 | 1,999,055 | Mar 04 06:15 PM | | CAMERON DENNIS C | EVP and General Counsel | Aug 04 '23 | Sale | 51.13 | 7,870 | 402,393 | 210,548 | Aug 07 04:33 PM |
|
|
|
 |
| Market Cap | 551.92B | EPS (ttm) | 3.91 |
| P/E | 44.22 | EPS this Y | -22.22% |
| Forward P/E | 52.34 | EPS next Y | 36.27% |
| PEG | 2.89 | EPS past 5Y | - |
| P/S | 5.83 | EPS next 5Y | 15.30% |
| P/B | 8.57 | EPS Q/Q | -53.71% |
| Dividend | - | Sales Q/Q | -8.69% |
| Insider Own | 13.01% | Inst Own | 44.60% |
| Insider Trans | -0.08% | Inst Trans | 1.98% |
| Short Float | 3.84% | Earnings | Apr 23/a |
| Analyst Recom | 2.69 | Target Price | 183.03 |
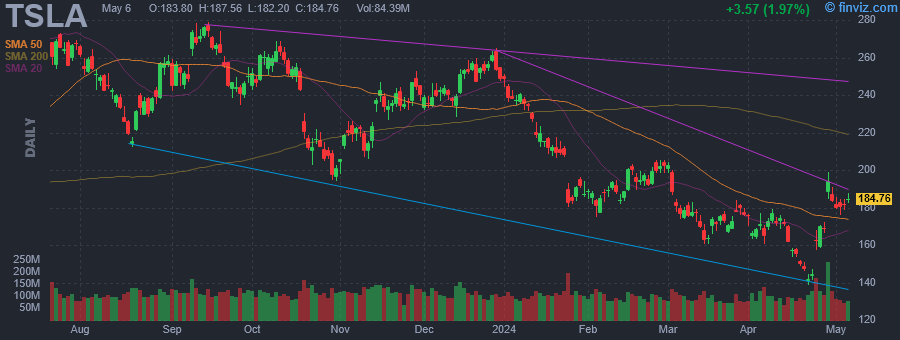
| Avg Volume | 100.77M | 52W Range | 138.80 - 299.29 |
|
|
|
|
Tesla, Inc. engages in the design, development, manufacture, and sale of electric vehicles and energy generation and storage systems. The company operates through Automotive and Energy Generation and Storage. The Automotive segment includes the design, development, manufacture, sale, and lease of electric vehicles as well as sales of automotive regulatory credits. The Energy Generation and Storage segment is involved in the design, manufacture, installation, sale, and lease of stationary energy storage products and solar energy systems, and sale of solar energy systems incentives. The company was founded by Jeffrey B. Straubel, Elon Reeve Musk, Martin Eberhard, and Marc Tarpenning on July 1, 2003 and is headquartered in Austin, TX. |
| Insider Trading |
Relationship |
Date |
Transaction |
Cost |
#Shares |
Value ($) |
#Shares Total |
SEC Form 4 |
| DENHOLM ROBYN M | Director | May 06 '24 | Option Exercise | 23.17 | 93,705 | 2,171,145 | 108,705 | May 07 06:12 PM | | DENHOLM ROBYN M | Director | May 06 '24 | Sale | 184.86 | 93,705 | 17,322,282 | 15,000 | May 07 06:12 PM | | Baglino Andrew D | SVP Powertrain and Energy Eng. | Apr 01 '24 | Option Exercise | 17.22 | 10,500 | 180,810 | 41,730 | Apr 03 08:02 PM | | Baglino Andrew D | SVP Powertrain and Energy Eng. | Apr 01 '24 | Sale | 176.20 | 10,500 | 1,850,100 | 31,230 | Apr 03 08:02 PM | | DENHOLM ROBYN M | Director | Mar 12 '24 | Option Exercise | 23.17 | 93,705 | 2,171,145 | 108,705 | Mar 14 08:03 PM |
|
|
| |
 |
| Market Cap | 17.99B | EPS (ttm) | 1.85 |
| P/E | 10.57 | EPS this Y | -13.68% |
| Forward P/E | 8.90 | EPS next Y | 13.78% |
| PEG | - | EPS past 5Y | 6.49% |
| P/S | 1.95 | EPS next 5Y | -0.88% |
| P/B | 1.17 | EPS Q/Q | -40.47% |
| Dividend | 4.90% | Sales Q/Q | 5.78% |
| Insider Own | 0.32% | Inst Own | 81.21% |
| Insider Trans | -0.05% | Inst Trans | 0.74% |
| Short Float | 3.31% | Earnings | Apr 19/b |
| Analyst Recom | 2.43 | Target Price | 21.59 |
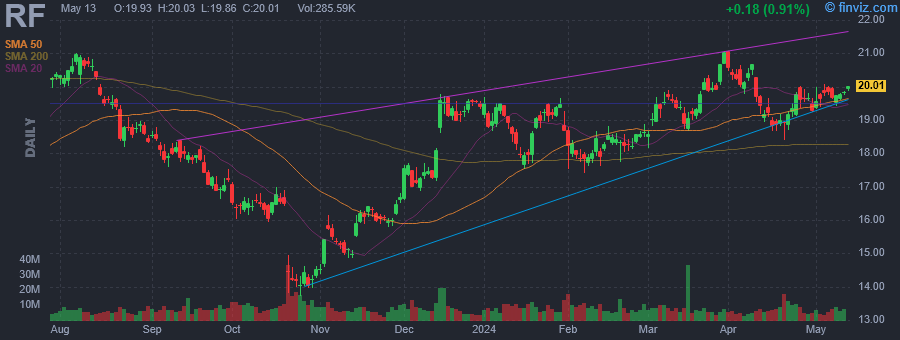
| Avg Volume | 8.10M | 52W Range | 13.72 - 21.08 |
|
|
|
|
Regions Financial Corp. operates as a bank holding company. It provides traditional commercial, retail and mortgage banking services, as well as other financial services in the fields of investment banking, asset management, trust, mutual funds, securities brokerage, insurance and other financing. The firm operates through the following segments: Corporate Bank, Consumer Bank, Wealth Management, and Other. The Corporate Bank segment represents the commercial banking functions including commercial and industrial, commercial real estate and investor real estate lending. The Consumer Bank segment holds the branch network, including consumer banking products and services related to residential first mortgages, home equity lines and loans, small business loans, indirect loans, consumer credit cards and other consumer loans. The Wealth Management segment offers individuals, businesses, governmental institutions and non-profit entities a range of solutions to help protect, grow and transfer wealth. The Other segment includes the company's treasury function, the securities portfolio, wholesale funding activities, interest rate risk management activities and other corporate functions that are not related to a strategic business unit. The company was founded in 1971 and is headquartered in Birmingham, AL. |
| Insider Trading |
Relationship |
Date |
Transaction |
Cost |
#Shares |
Value ($) |
#Shares Total |
SEC Form 4 |
| Ritter William D. | SEVP | May 03 '24 | Sale | 19.95 | 23,000 | 458,742 | 41,671 | May 07 06:11 PM | | RHODES WILLIAM C III | Director | Apr 23 '24 | Buy | 19.37 | 50,000 | 968,500 | 50,000 | Apr 24 07:48 PM | | RHODES WILLIAM C III | Director | Apr 17 '24 | Option Exercise | 0.00 | 1,179 | 0 | 1,279 | Apr 19 04:50 PM | | Rand Alison S. | Director | Apr 17 '24 | Option Exercise | 0.00 | 4,700 | 0 | 4,800 | Apr 19 04:50 PM | | JOHNSON JOIA M | Director | Apr 17 '24 | Option Exercise | 0.00 | 7,460 | 0 | 12,736 | Apr 19 04:50 PM |
|
|
|
 |
| Market Cap | 9.92B | EPS (ttm) | 8.34 |
| P/E | 20.29 | EPS this Y | 7.88% |
| Forward P/E | 12.31 | EPS next Y | 8.91% |
| PEG | 2.60 | EPS past 5Y | -2.18% |
| P/S | 3.56 | EPS next 5Y | 7.80% |
| P/B | 3.38 | EPS Q/Q | 48.88% |
| Dividend | - | Sales Q/Q | -3.10% |
| Insider Own | 0.74% | Inst Own | 93.29% |
| Insider Trans | -4.60% | Inst Trans | 2.97% |
| Short Float | 3.23% | Earnings | Apr 29/a |
| Analyst Recom | 3.06 | Target Price | 185.00 |
| Avg Volume | 457.09K | 52W Range | 133.00 - 199.49 |
|
|
|
|
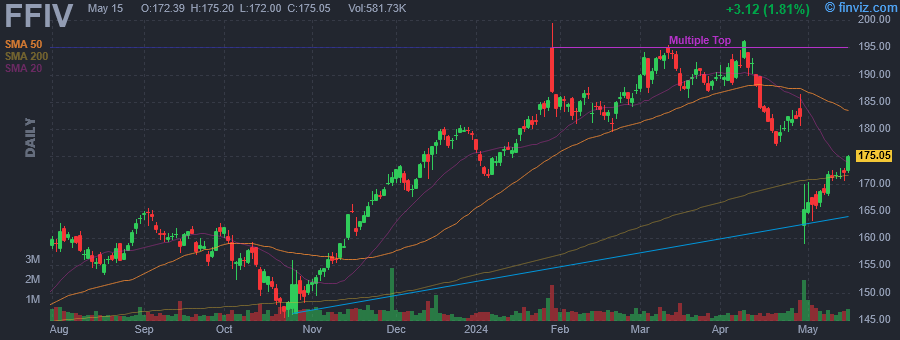
F5, Inc. engages in the business of multi-cloud application services. Its products include F5 distributed cloud services, F5 NGINX, F5 BIG-IP, and F5 Systems. It operates through the following geographical segments: Americas, Europe, the Middle East, and Africa, and Asia Pacific. The company was founded on February 26, 1996 and is headquartered in Seattle, WA. |
| Insider Trading |
Relationship |
Date |
Transaction |
Cost |
#Shares |
Value ($) |
#Shares Total |
SEC Form 4 |
| Locoh-Donou Francois | President, CEO & Director | May 03 '24 | Sale | 168.11 | 1,450 | 243,760 | 124,362 | May 07 06:07 PM | | FOUNTAIN THOMAS DEAN | EVP Global Services & Strategy | May 02 '24 | Sale | 167.53 | 851 | 142,568 | 15,504 | May 02 06:39 PM | | FOUNTAIN THOMAS DEAN | EVP Global Services & Strategy | May 01 '24 | Option Exercise | 0.00 | 2,729 | 0 | 17,737 | May 02 06:39 PM | | Locoh-Donou Francois | President, CEO & Director | May 01 '24 | Option Exercise | 0.00 | 6,610 | 0 | 128,411 | May 02 06:40 PM | | Pelzer Francis J. | EVP, Chief Financial Officer | May 01 '24 | Option Exercise | 0.00 | 2,170 | 0 | 33,460 | May 02 06:42 PM |
|
|
| |
 |
| Market Cap | 1195.86B | EPS (ttm) | 17.41 |
| P/E | 27.08 | EPS this Y | 35.71% |
| Forward P/E | 20.35 | EPS next Y | 14.78% |
| PEG | 0.97 | EPS past 5Y | 14.46% |
| P/S | 8.38 | EPS next 5Y | 27.98% |
| P/B | 8.00 | EPS Q/Q | 114.26% |
| Dividend | 0.39% | Sales Q/Q | 27.26% |
| Insider Own | 13.88% | Inst Own | 67.84% |
| Insider Trans | -1.43% | Inst Trans | -1.63% |
| Short Float | 1.24% | Earnings | Apr 24/a |
| Analyst Recom | 1.48 | Target Price | 521.64 |
| Avg Volume | 17.15M | 52W Range | 230.27 - 531.49 |
|
|
|
|
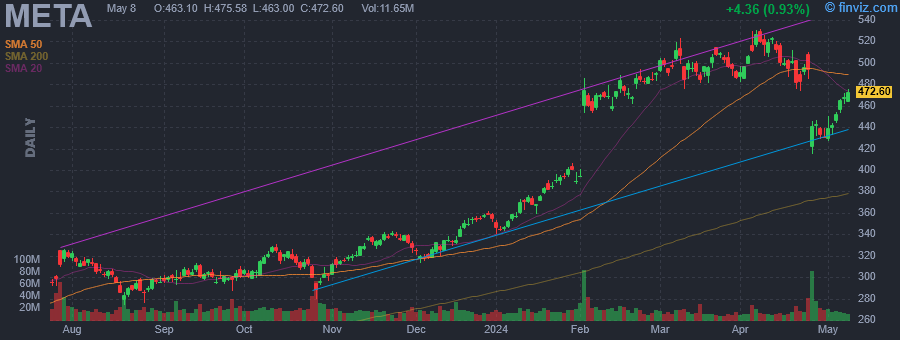
Meta Platforms, Inc. engages in the development of social media applications. It builds technology that helps people connect and share, find communities, and grow businesses. It operates through the Family of Apps (FoA) and Reality Labs (RL) segments. The FoA segment consists of Facebook, Instagram, Messenger, WhatsApp, and other services. The RL segment includes augmented, mixed and virtual reality related consumer hardware, software, and content. The company was founded by Mark Elliot Zuckerberg, Dustin Moskovitz, Chris R. Hughes, Andrew McCollum, and Eduardo P. Saverin on February 4, 2004, and is headquartered in Menlo Park, CA. |
| Insider Trading |
Relationship |
Date |
Transaction |
Cost |
#Shares |
Value ($) |
#Shares Total |
SEC Form 4 |
| Olivan Javier | Chief Operating Officer | May 03 '24 | Sale | 445.93 | 490 | 218,506 | 6,109 | May 07 06:06 PM | | Newstead Jennifer | Chief Legal Officer | Apr 30 '24 | Sale | 431.05 | 585 | 252,164 | 36,643 | May 02 06:16 PM | | Olivan Javier | Chief Operating Officer | Apr 26 '24 | Sale | 441.54 | 490 | 216,355 | 6,599 | Apr 30 06:51 PM | | Newstead Jennifer | Chief Legal Officer | Apr 23 '24 | Sale | 491.25 | 585 | 287,381 | 37,228 | Apr 25 06:24 PM | | Olivan Javier | Chief Operating Officer | Apr 19 '24 | Sale | 501.18 | 490 | 245,578 | 7,089 | Apr 23 06:14 PM |
|
|
|
 |
| Market Cap | 4.92B | EPS (ttm) | 2.92 |
| P/E | 27.45 | EPS this Y | 9.75% |
| Forward P/E | 22.60 | EPS next Y | 11.23% |
| PEG | 1.82 | EPS past 5Y | 7.37% |
| P/S | 2.34 | EPS next 5Y | 15.10% |
| P/B | 3.27 | EPS Q/Q | 45.08% |
| Dividend | - | Sales Q/Q | 18.04% |
| Insider Own | 0.38% | Inst Own | 102.72% |
| Insider Trans | -15.03% | Inst Trans | -4.61% |
| Short Float | 6.24% | Earnings | Mar 20/b |
| Analyst Recom | 1.81 | Target Price | 88.19 |
| Avg Volume | 967.75K | 52W Range | 52.93 - 84.38 |
|
|
|
|
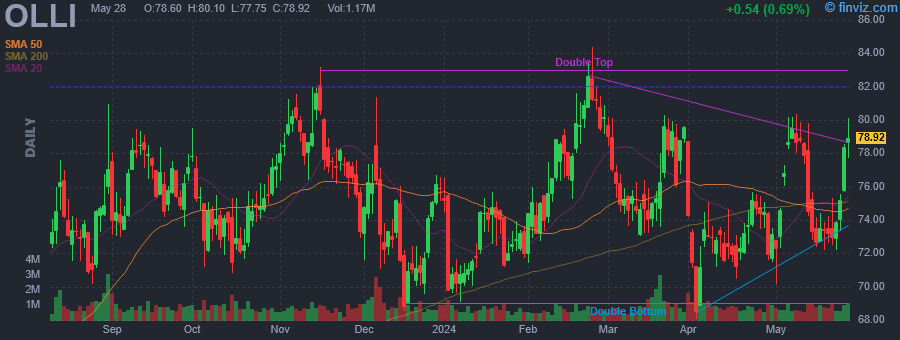
Ollie's Bargain Outlet Holdings, Inc. is a holding company, which engages in the retail of closeouts, excess inventory, and salvage merchandise. It offers overstocks, package changes, manufacturer refurbished goods, and irregulars. The company's products include housewares, food, books and stationery, bed and bath, floor coverings, electronics and toys. Ollie's Bargain Outlet Holdings was founded by Mark Butler, Mort Bernstein, Oliver Rosenberg and Harry Coverman on July 29, 1982, and is headquartered in Harrisburg, PA. |
| Insider Trading |
Relationship |
Date |
Transaction |
Cost |
#Shares |
Value ($) |
#Shares Total |
SEC Form 4 |
| Helm Robert F | SVP/CFO | May 06 '24 | Sale | 80.00 | 170 | 13,600 | 1,437 | May 07 06:04 PM | | van der Valk Eric | EVP, COO | May 03 '24 | Option Exercise | 0.00 | 849 | 0 | 5,966 | May 07 06:04 PM | | HENDRICKSON THOMAS | Director | Apr 18 '24 | Option Exercise | 11.54 | 5,000 | 57,700 | 10,659 | Apr 22 04:34 PM | | HENDRICKSON THOMAS | Director | Apr 18 '24 | Sale | 72.29 | 5,000 | 361,450 | 5,659 | Apr 22 04:34 PM | | SWYGERT JOHN W | President, CEO | Apr 01 '24 | Sale | 75.22 | 11,756 | 884,339 | 48,200 | Apr 03 05:00 PM |
|
|
| |
 |
| Market Cap | 2.62B | EPS (ttm) | -0.88 |
| P/E | - | EPS this Y | 75.63% |
| Forward P/E | 24.46 | EPS next Y | 53.14% |
| PEG | - | EPS past 5Y | -23.11% |
| P/S | 4.67 | EPS next 5Y | 49.00% |
| P/B | 3.61 | EPS Q/Q | 20.62% |
| Dividend | - | Sales Q/Q | 15.59% |
| Insider Own | 62.10% | Inst Own | 34.41% |
| Insider Trans | -0.48% | Inst Trans | -0.14% |
| Short Float | 7.02% | Earnings | May 08/a |
| Analyst Recom | 1.50 | Target Price | 23.26 |
| Avg Volume | 441.56K | 52W Range | 14.83 - 22.89 |
|
|
|
|
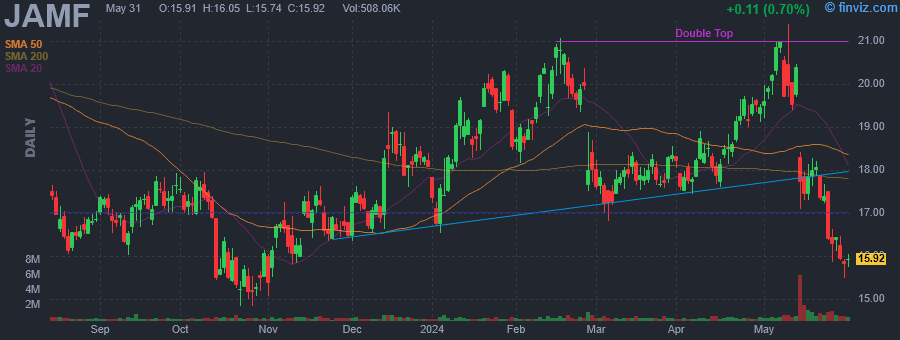
Jamf Holding Corp. engages in the provision of a complete management and security solution for an Apple-first environment that is designed to be enterprise secure, consumer simple, and protective of personal privacy. It operates through the following geographical segments: The Americas, Europe, the Middle East, India, and Africa, and Asia Pacific. The company was founded in 2002 and is headquartered in Minneapolis, MN. |
| Insider Trading |
Relationship |
Date |
Transaction |
Cost |
#Shares |
Value ($) |
#Shares Total |
SEC Form 4 |
| GOODKIND IAN | Chief Financial Officer | May 03 '24 | Sale | 20.07 | 51,439 | 1,032,278 | 244,699 | May 07 06:02 PM | | LAM LINH | CIO | May 03 '24 | Sale | 20.03 | 2,200 | 44,073 | 200,585 | May 07 06:03 PM | | TSCHIDA BETH | CTO | Apr 18 '24 | Sale | 18.27 | 7,526 | 137,533 | 340,422 | Apr 22 07:21 PM | | LAM LINH | CIO | Mar 20 '24 | Sale | 17.98 | 25,978 | 466,988 | 202,785 | Mar 21 05:37 PM | | STROSAHL JOHN | CEO | Mar 20 '24 | Sale | 17.97 | 24,966 | 448,656 | 1,068,965 | Mar 21 05:38 PM |
|
|
|
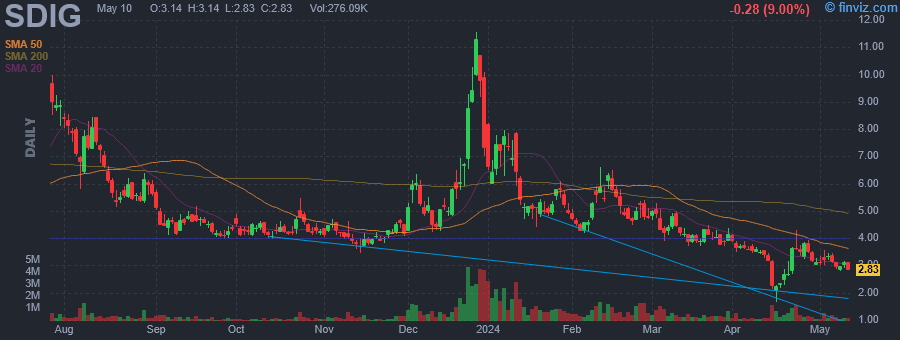 |
| Market Cap | 37.84M | EPS (ttm) | -3.00 |
| P/E | - | EPS this Y | 88.87% |
| Forward P/E | - | EPS next Y | 6.02% |
| PEG | - | EPS past 5Y | -68.53% |
| P/S | 0.44 | EPS next 5Y | - |
| P/B | 0.61 | EPS Q/Q | 105.40% |
| Dividend | - | Sales Q/Q | 59.40% |
| Insider Own | 16.04% | Inst Own | 15.84% |
| Insider Trans | -15.30% | Inst Trans | 2.73% |
| Short Float | 3.51% | Earnings | May 02/b |
| Analyst Recom | 1.67 | Target Price | 7.19 |
| Avg Volume | 605.98K | 52W Range | 1.65 - 11.56 |
|
|
|
|
Stronghold Digital Mining, Inc. is a vertically integrated crypto asset mining company, which engages in mining Bitcoin. It operates the Energy Operations and Cryptocurrency Operations segments. The company was founded by Gregory Allan Beard and William B. Spence on March 19, 2021 and is headquartered in New York, NY. |
| Insider Trading |
Relationship |
Date |
Transaction |
Cost |
#Shares |
Value ($) |
#Shares Total |
SEC Form 4 |
| Smith Matthew J. | Chief Financial Officer | May 03 '24 | Sale | 3.29 | 132 | 434 | 174,207 | May 07 06:01 PM | | Shaffer Richard J. | Senior Vice President | May 01 '24 | Sale | 3.12 | 43 | 134 | 27,125 | May 02 05:41 PM | | Smith Matthew J. | Chief Financial Officer | Apr 23 '24 | Sale | 3.65 | 107 | 391 | 174,339 | Apr 24 07:15 PM | | Beard Gregory A | Chief Executive Officer | Apr 15 '24 | Sale | 2.38 | 13,811 | 32,818 | 374,003 | Apr 17 07:33 PM | | Smith Matthew J. | Chief Financial Officer | Mar 20 '24 | Sale | 4.04 | 166 | 670 | 174,446 | Mar 22 06:32 PM |
|
|
|
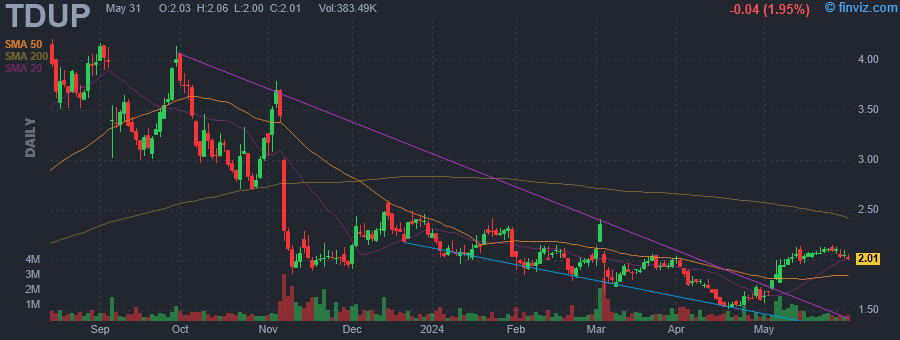 |
| Market Cap | 214.40M | EPS (ttm) | -0.64 |
| P/E | - | EPS this Y | 39.34% |
| Forward P/E | - | EPS next Y | 21.82% |
| PEG | - | EPS past 5Y | -13.35% |
| P/S | 0.66 | EPS next 5Y | - |
| P/B | 2.32 | EPS Q/Q | 21.95% |
| Dividend | - | Sales Q/Q | 4.83% |
| Insider Own | 31.11% | Inst Own | 60.49% |
| Insider Trans | -2.10% | Inst Trans | -4.17% |
| Short Float | 8.67% | Earnings | May 06/a |
| Analyst Recom | 1.17 | Target Price | 4.00 |
| Avg Volume | 588.00K | 52W Range | 1.51 - 4.39 |
|
|
|
|
thredUP, Inc. operates as an online clothing resale platform for apparel, shoes, and accessories. Its brands include J.Crew, Ann Taylor, Banana Republic, Lululemon Athletica, Talbots, and Madewell. It operates through the United States and Others geographical segments. The company was founded by James Reinhart, Chris Homer, and Oliver Lubin in January 2009 and is headquartered in Oakland, CA. |
| Insider Trading |
Relationship |
Date |
Transaction |
Cost |
#Shares |
Value ($) |
#Shares Total |
SEC Form 4 |
| Nakache Patricia | Director | May 07 '24 | Sale | 1.92 | 314,034 | 602,945 | 0 | May 07 06:01 PM | | Nakache Patricia | Director | May 06 '24 | Sale | 1.91 | 109,934 | 209,974 | 0 | May 07 06:01 PM | | Nakache Patricia | Director | May 03 '24 | Sale | 1.80 | 300 | 540 | 0 | May 07 06:01 PM | | Reinhart James G. | Chief Executive Officer | Apr 01 '24 | Sale | 2.00 | 20,744 | 41,509 | 659,398 | Apr 03 04:08 PM | | Reinhart James G. | Chief Executive Officer | Mar 20 '24 | Sale | 2.01 | 9,801 | 19,653 | 680,142 | Mar 21 04:26 PM |
|
|
|
