 |
| Market Cap | 5.97B | EPS (ttm) | -2.56 |
| P/E | - | EPS this Y | -51.20% |
| Forward P/E | - | EPS next Y | 15.79% |
| PEG | - | EPS past 5Y | - |
| P/S | 7.57 | EPS next 5Y | - |
| P/B | 15.28 | EPS Q/Q | 82.93% |
| Dividend | - | Sales Q/Q | 113.82% |
| Insider Own | 8.11% | Inst Own | 96.87% |
| Insider Trans | -3.82% | Inst Trans | -4.52% |
| Short Float | 7.11% | Earnings | May 07/b |
| Analyst Recom | 1.84 | Target Price | 57.61 |
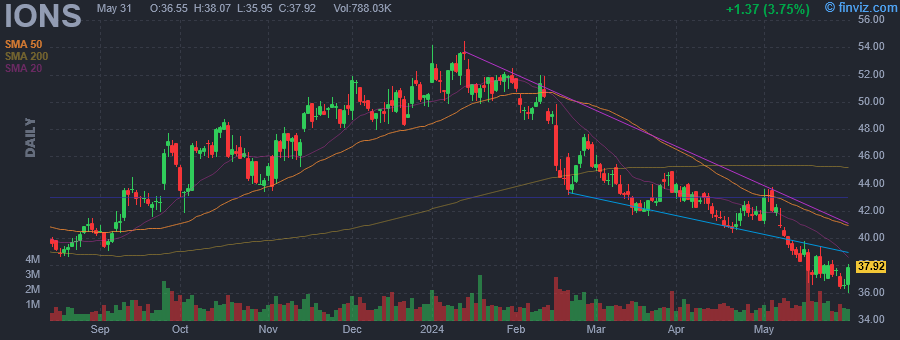
| Avg Volume | 1.08M | 52W Range | 34.79 - 54.44 |
|
|
|
|
Ionis Pharmaceuticals, Inc. engages in the development and commercialization of human therapeutic drugs using antisense technology. It operates through the Ionis Core segment. The Ionis Core segment exploits a novel drug discovery platform to generate a pipeline of drugs. The company was founded by Stanley T. Crooke, David J. Ecker, Christopher K. Mirabelli, and Brett P. Monia on January 10, 1989 and is headquartered in Carlsbad, CA. |
| Insider Trading |
Relationship |
Date |
Transaction |
Cost |
#Shares |
Value ($) |
#Shares Total |
SEC Form 4 |
| KLEIN JOSEPH III | Director | May 03 '24 | Sale | 42.71 | 6,000 | 256,277 | 0 | May 07 04:55 PM | | Baroldi Joseph | EVP, Chief Business Officer | Apr 16 '24 | Sale | 41.60 | 4,006 | 166,641 | 19,631 | Apr 17 05:19 PM | | Birchler Brian | EVP, Corp and Development Ops | Apr 16 '24 | Sale | 41.66 | 905 | 37,698 | 46,156 | Apr 17 05:16 PM | | Birchler Brian | EVP, Corp and Development Ops | Apr 15 '24 | Option Exercise | 0.00 | 1,875 | 0 | 47,061 | Apr 17 05:16 PM | | Baroldi Joseph | EVP, Chief Business Officer | Apr 15 '24 | Option Exercise | 0.00 | 10,838 | 0 | 23,637 | Apr 17 05:19 PM |
|
|
 |
 |
| Market Cap | 8.59B | EPS (ttm) | 23.84 |
| P/E | 17.31 | EPS this Y | -3.18% |
| Forward P/E | 14.72 | EPS next Y | 13.43% |
| PEG | 1.90 | EPS past 5Y | 31.53% |
| P/S | 0.40 | EPS next 5Y | 9.13% |
| P/B | 10.94 | EPS Q/Q | -35.06% |
| Dividend | 0.41% | Sales Q/Q | -4.60% |
| Insider Own | 8.94% | Inst Own | 82.04% |
| Insider Trans | -2.66% | Inst Trans | -5.59% |
| Short Float | 7.72% | Earnings | May 01/a |
| Analyst Recom | 2.38 | Target Price | 429.00 |
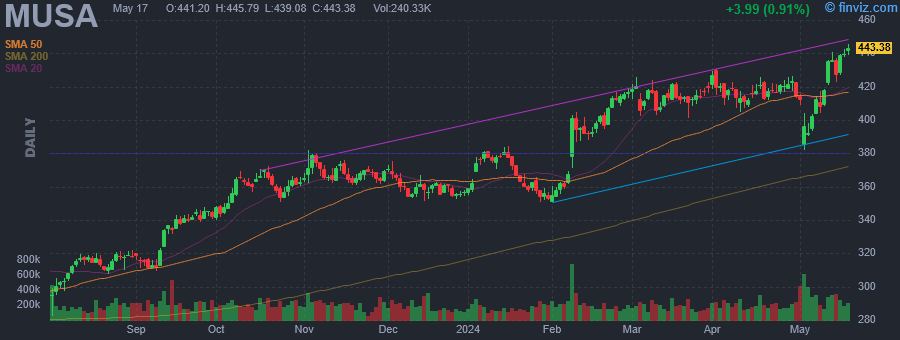
| Avg Volume | 231.81K | 52W Range | 268.69 - 430.83 |
|
|
|
|
Murphy USA, Inc. engages in marketing motor fuel products and convenience merchandise through retail stores, namely Murphy USA and Murphy Express. It collaborates with Walmart to offer customers discounted and free items based on purchases of qualifying fuel and merchandise. It operates through the Marketing, and Corporate and Other Assets segments. The company was founded in 1996 and is headquartered in El Dorado, AR. |
| Insider Trading |
Relationship |
Date |
Transaction |
Cost |
#Shares |
Value ($) |
#Shares Total |
SEC Form 4 |
| Turner Rosemary | Director | May 06 '24 | Sale | 400.00 | 205 | 82,000 | 0 | May 07 04:53 PM | | Click Christopher A | SVP, Strategy & Development | Feb 26 '24 | Option Exercise | 125.09 | 1,700 | 212,653 | 4,113 | Feb 28 04:31 PM | | Click Christopher A | SVP, Strategy & Development | Feb 26 '24 | Sale | 415.55 | 664 | 275,925 | 2,413 | Feb 28 04:31 PM | | Smith Donald R Jr | VP & Corporate Controller | Feb 23 '24 | Option Exercise | 76.15 | 2,700 | 205,605 | 22,799 | Feb 26 05:20 PM | | Phillips Jeanne Linder | Director | Feb 23 '24 | Sale | 411.42 | 1,525 | 627,416 | 2,670 | Feb 26 05:12 PM |
|
|
|
 |
| Market Cap | 3.83B | EPS (ttm) | 8.48 |
| P/E | 13.21 | EPS this Y | 5.13% |
| Forward P/E | 12.88 | EPS next Y | -0.57% |
| PEG | 0.88 | EPS past 5Y | 26.84% |
| P/S | 1.23 | EPS next 5Y | 15.00% |
| P/B | 1.61 | EPS Q/Q | 11.40% |
| Dividend | 1.13% | Sales Q/Q | 2.45% |
| Insider Own | 2.56% | Inst Own | 86.02% |
| Insider Trans | -5.67% | Inst Trans | -4.11% |
| Short Float | 2.81% | Earnings | Apr 30/a |
| Analyst Recom | 1.67 | Target Price | 127.67 |
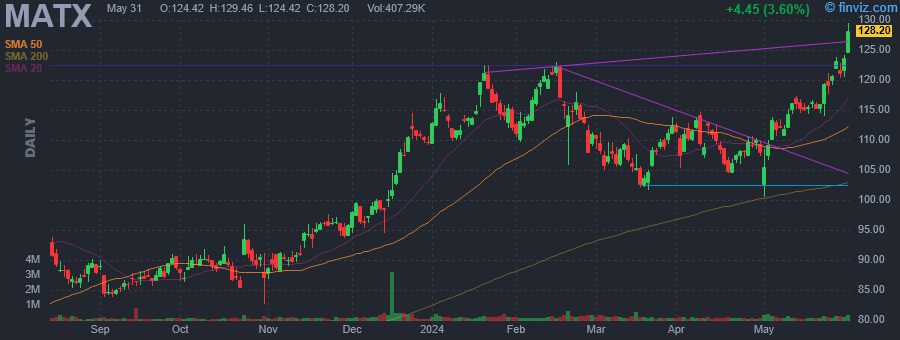
| Avg Volume | 264.74K | 52W Range | 64.21 - 122.99 |
|
|
|
|
Matson, Inc. is a holding company, which engages in the provision of logistics and transportation services. It operates through the Ocean Transportation and Logistics segments. The Ocean Transportation segment offers ocean freight transportation, container stevedoring, refrigerated cargo services, inland transportation, and other terminal services. The Logistics segment includes domestic and international rail intermodal services, regional highway brokerage, specialized hauling, expedited freight operations, supply chain management, storage, and distribution services. The company was founded in 1882 by William Matson and is headquartered in Honolulu, HI. |
| Insider Trading |
Relationship |
Date |
Transaction |
Cost |
#Shares |
Value ($) |
#Shares Total |
SEC Form 4 |
| Isotoff Leonard P | Senior Vice President | May 06 '24 | Sale | 112.48 | 2,800 | 314,945 | 4,746 | May 07 04:52 PM | | Scott Christopher A | Senior Vice President | Mar 13 '24 | Sale | 107.83 | 1,171 | 126,269 | 12,958 | Mar 14 04:49 PM | | Park Kuuhaku T | Senior Vice President | Mar 07 '24 | Sale | 107.55 | 1,941 | 208,745 | 10,698 | Mar 08 04:35 PM | | Heilmann Peter T | EVP, Chief Admin. Officer & GC | Mar 05 '24 | Sale | 106.43 | 9,047 | 962,859 | 48,431 | Mar 06 04:20 PM | | Rolfe Rusty K | EVP | Mar 05 '24 | Sale | 107.15 | 5,000 | 535,736 | 24,871 | Mar 06 04:20 PM |
|
|
| |
 |
| Market Cap | 16.96B | EPS (ttm) | 21.41 |
| P/E | 13.80 | EPS this Y | -12.43% |
| Forward P/E | 14.73 | EPS next Y | 1.23% |
| PEG | 3.83 | EPS past 5Y | 20.94% |
| P/S | 1.17 | EPS next 5Y | 3.60% |
| P/B | 2.14 | EPS Q/Q | -18.68% |
| Dividend | 1.41% | Sales Q/Q | -8.08% |
| Insider Own | 0.68% | Inst Own | 80.51% |
| Insider Trans | -24.63% | Inst Trans | -4.55% |
| Short Float | 1.19% | Earnings | Apr 25/b |
| Analyst Recom | 2.00 | Target Price | 358.40 |
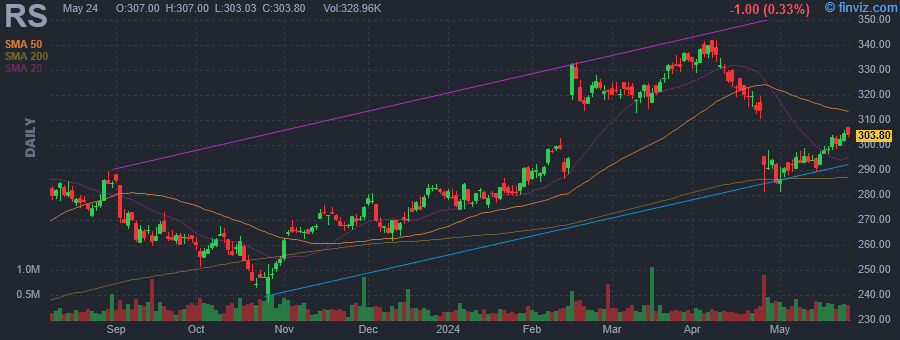
| Avg Volume | 279.42K | 52W Range | 229.12 - 342.20 |
|
|
|
|
Reliance, Inc. engages in the provision of a metal distribution center. It offers alloy, aluminum, brass, copper, carbon steel, stainless steel, titanium, and specialty steel products. The company was founded by Thomas J. Neilan on February 3, 1939, and is headquartered in Scottsdale, AZ. |
| Insider Trading |
Relationship |
Date |
Transaction |
Cost |
#Shares |
Value ($) |
#Shares Total |
SEC Form 4 |
| HOFFMAN JAMES DONALD | Director | May 07 '24 | Sale | 292.77 | 5,000 | 1,463,827 | 39,042 | May 07 04:49 PM | | HOFFMAN JAMES DONALD | Director | May 03 '24 | Sale | 290.04 | 5,000 | 1,450,193 | 44,042 | May 07 04:49 PM | | HOFFMAN JAMES DONALD | Director | Apr 30 '24 | Sale | 289.81 | 5,000 | 1,449,067 | 49,042 | May 02 07:50 PM | | Ajemyan Arthur | SVP, CFO | Mar 06 '24 | Sale | 322.95 | 3,000 | 968,850 | 15,577 | Mar 06 05:36 PM | | HOFFMAN JAMES DONALD | Director | Feb 27 '24 | Sale | 322.95 | 40,000 | 12,917,867 | 54,042 | Feb 28 06:56 PM |
|
|
|
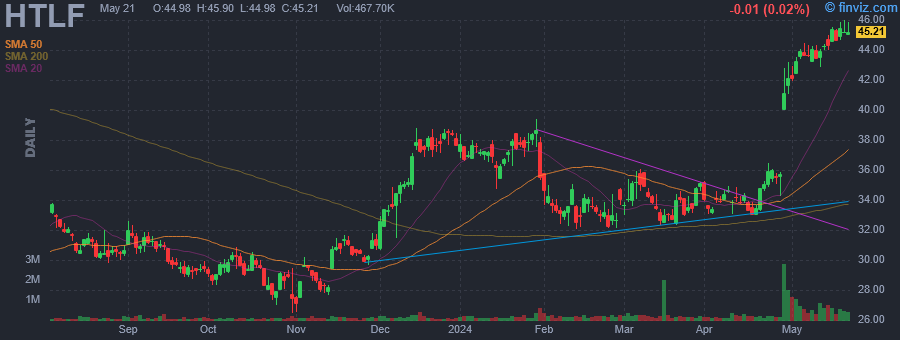 |
| Market Cap | 1.87B | EPS (ttm) | 1.65 |
| P/E | 26.41 | EPS this Y | -0.40% |
| Forward P/E | 9.37 | EPS next Y | 3.10% |
| PEG | 2.64 | EPS past 5Y | -13.76% |
| P/S | 1.93 | EPS next 5Y | 10.00% |
| P/B | 1.00 | EPS Q/Q | -2.50% |
| Dividend | 2.80% | Sales Q/Q | 14.02% |
| Insider Own | 7.48% | Inst Own | 75.42% |
| Insider Trans | -0.23% | Inst Trans | 0.07% |
| Short Float | 1.65% | Earnings | May 01/a |
| Analyst Recom | 1.80 | Target Price | 50.00 |
| Avg Volume | 367.76K | 52W Range | 26.10 - 44.47 |
|
|
|
|
Heartland Financial USA, Inc. operates as a bank holding company, which provides commercial banking services. It also engages in the business of community banking. The company was founded in 1981 and is headquartered in Denver, CO. |
| Insider Trading |
Relationship |
Date |
Transaction |
Cost |
#Shares |
Value ($) |
#Shares Total |
SEC Form 4 |
| Engel Robert B | Director | May 07 '24 | Sale | 25.26 | 7,600 | 191,982 | 17,000 | May 07 04:45 PM | | Kim Jai | EVP & General Counsel, CAO | Mar 21 '24 | Option Exercise | 0.00 | 2,185 | 0 | 3,575 | Mar 25 04:03 PM | | Frank Mark A | EVP, Chief Operations Officer | Mar 21 '24 | Option Exercise | 0.00 | 946 | 0 | 1,606 | Mar 25 04:03 PM | | DETERS DEBORAH K | EVP, Chief HR Officer | Mar 21 '24 | Option Exercise | 0.00 | 1,155 | 0 | 9,035 | Mar 25 04:02 PM | | Prince David | EVP, Head of Commercial | Mar 21 '24 | Option Exercise | 0.00 | 2,454 | 0 | 16,710 | Mar 25 04:07 PM |
|
|
| |
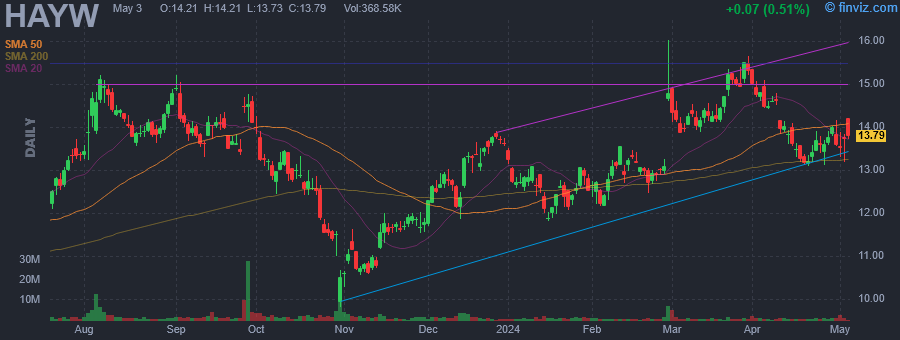 |
| Market Cap | 3.11B | EPS (ttm) | 0.37 |
| P/E | 38.87 | EPS this Y | 8.96% |
| Forward P/E | 19.01 | EPS next Y | 24.67% |
| PEG | - | EPS past 5Y | 259.04% |
| P/S | 3.12 | EPS next 5Y | - |
| P/B | 2.35 | EPS Q/Q | 16.80% |
| Dividend | - | Sales Q/Q | 1.16% |
| Insider Own | 0.65% | Inst Own | 110.85% |
| Insider Trans | -11.98% | Inst Trans | -0.55% |
| Short Float | 8.71% | Earnings | May 02/b |
| Analyst Recom | 2.50 | Target Price | 15.62 |
| Avg Volume | 1.36M | 52W Range | 9.80 - 16.04 |
|
|
|
|
Hayward Holdings, Inc. engages in the business of designing, manufacturing, and marketing a broad portfolio of pool equipment and associated automation systems. It operates under the North America (NAM) and Europe and Rest of the World (E and RW) segments. The NAM segment includes manufacturing and selling a complete line of residential and commercial swimming pool equipment and supplies in the United States and Canada as well as flow control products. The E and RW segment is involved in Europe, Central, and South America, the Middle East, Australia, and other Asia Pacific countries. The company was founded on June 1, 2017 and is headquartered in Charlotte, NC. |
| Insider Trading |
Relationship |
Date |
Transaction |
Cost |
#Shares |
Value ($) |
#Shares Total |
SEC Form 4 |
| HOLLERAN KEVIN | President and CEO | May 06 '24 | Option Exercise | 1.40 | 42,857 | 60,000 | 565,656 | May 07 04:42 PM | | HOLLERAN KEVIN | President and CEO | May 06 '24 | Sale | 14.36 | 42,857 | 615,482 | 522,799 | May 07 04:42 PM | | HOLLERAN KEVIN | President and CEO | Apr 17 '24 | Option Exercise | 1.40 | 42,857 | 60,000 | 565,656 | Apr 18 04:52 PM | | HOLLERAN KEVIN | President and CEO | Apr 17 '24 | Sale | 13.34 | 42,857 | 571,897 | 522,799 | Apr 18 04:52 PM | | HOLLERAN KEVIN | President and CEO | Apr 01 '24 | Option Exercise | 1.40 | 61,429 | 86,001 | 584,228 | Apr 03 05:32 PM |
|
|
|
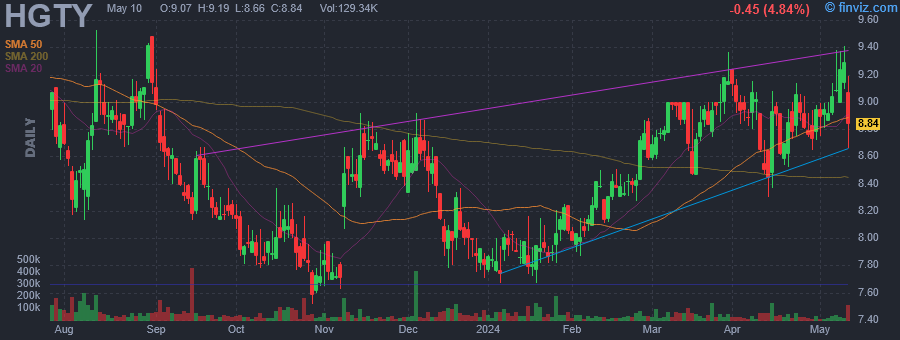 |
| Market Cap | 778.38M | EPS (ttm) | 0.08 |
| P/E | 120.72 | EPS this Y | 380.37% |
| Forward P/E | 35.02 | EPS next Y | 35.08% |
| PEG | - | EPS past 5Y | - |
| P/S | 0.77 | EPS next 5Y | - |
| P/B | 8.29 | EPS Q/Q | 108.18% |
| Dividend | - | Sales Q/Q | 28.34% |
| Insider Own | 12.50% | Inst Own | 80.90% |
| Insider Trans | -0.82% | Inst Trans | 0.42% |
| Short Float | 1.42% | Earnings | May 07/b |
| Analyst Recom | 3.00 | Target Price | 9.50 |
| Avg Volume | 46.64K | 52W Range | 7.52 - 10.01 |
|
|
|
|
Hagerty, Inc. engages in the provision of automotive insurance services. It offers insurance for classic and enthusiast vehicles. The company is headquartered in Traverse City, MI. |
| Insider Trading |
Relationship |
Date |
Transaction |
Cost |
#Shares |
Value ($) |
#Shares Total |
SEC Form 4 |
| KAUFFMAN ROBERT I | Director | May 07 '24 | Sale | 9.24 | 4,334 | 40,046 | 3,411,342 | May 07 04:42 PM | | KAUFFMAN ROBERT I | Director | May 06 '24 | Sale | 9.04 | 3,291 | 29,751 | 3,415,676 | May 07 04:42 PM | | KAUFFMAN ROBERT I | Director | Apr 25 '24 | Sale | 9.00 | 460 | 4,140 | 3,418,967 | Apr 25 04:34 PM | | KAUFFMAN ROBERT I | Director | Apr 24 '24 | Sale | 9.01 | 1,609 | 14,497 | 3,419,427 | Apr 25 04:34 PM | | KAUFFMAN ROBERT I | Director | Apr 23 '24 | Sale | 9.07 | 3,036 | 27,537 | 3,421,036 | Apr 25 04:34 PM |
|
|
| |
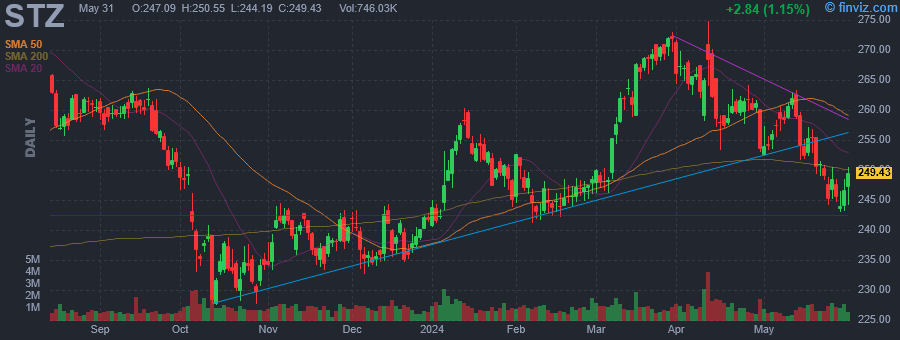 |
| Market Cap | 47.29B | EPS (ttm) | 9.39 |
| P/E | 27.54 | EPS this Y | 13.16% |
| Forward P/E | 17.06 | EPS next Y | 11.00% |
| PEG | 2.47 | EPS past 5Y | -11.78% |
| P/S | 4.75 | EPS next 5Y | 11.14% |
| P/B | 4.85 | EPS Q/Q | 76.67% |
| Dividend | 1.53% | Sales Q/Q | 7.08% |
| Insider Own | 16.23% | Inst Own | 79.25% |
| Insider Trans | -2.75% | Inst Trans | 1.79% |
| Short Float | 1.61% | Earnings | Apr 11/b |
| Analyst Recom | 1.42 | Target Price | 273.00 |
| Avg Volume | 1.21M | 52W Range | 222.45 - 274.87 |
|
|
|
|
Constellation Brands, Inc. engages in the production, marketing, and distribution of beer, wine, and spirits. It operates through the following segments: Beer, Wine and Spirits, Corporate Operations and Other, and Canopy. The Beer segment includes imported and craft beer brands. The Wine and Spirits segment sells wine brands across all categories-table wine, sparkling wine, and dessert wine-and across all price points. The Corporate Operations and Other segment refers to the costs of executive management, corporate development, corporate finance, human resources, internal audit, investor relations, legal, public relations, and information technology. The Canopy segment consists of canopy equity method Investments. The company was founded by Marvin Sands in 1945 and is headquartered in Victor, NY. |
| Insider Trading |
Relationship |
Date |
Transaction |
Cost |
#Shares |
Value ($) |
#Shares Total |
SEC Form 4 |
| McGrew Michael | EVP, Chief Com, Strt, ESG, Div | May 03 '24 | Sale | 255.50 | 3,237 | 827,043 | 1,731 | May 07 04:40 PM | | Glaetzer Samuel J | EVP & Pres. Wine and Spirits | May 01 '24 | Option Exercise | 0.00 | 1,787 | 0 | 5,947 | May 03 04:39 PM | | McGrew Michael | EVP, Chief Com, Strt, ESG, Div | May 01 '24 | Option Exercise | 0.00 | 1,287 | 0 | 3,467 | May 03 04:39 PM | | Sabia James A. Jr. | EVP & Pres. Beer | May 01 '24 | Option Exercise | 0.00 | 2,828 | 0 | 23,738 | May 03 04:39 PM | | Monteiro Mallika | EVP, Chief Growth, Digtl, Beer | May 01 '24 | Option Exercise | 0.00 | 2,344 | 0 | 5,654 | May 03 04:38 PM |
|
|
|
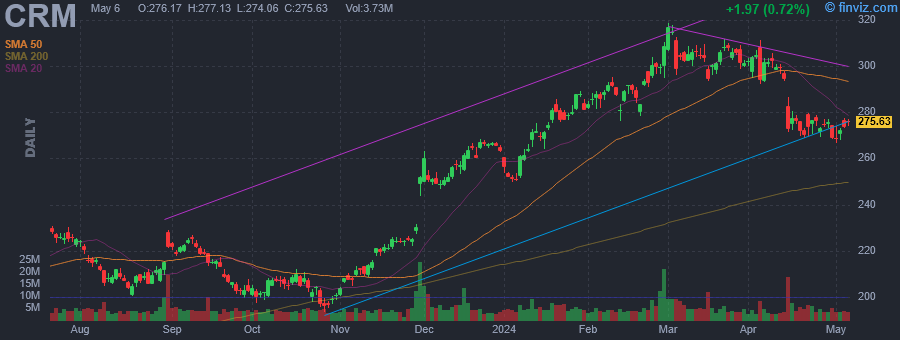 |
| Market Cap | 268.94B | EPS (ttm) | 4.21 |
| P/E | 65.92 | EPS this Y | 19.16% |
| Forward P/E | 25.03 | EPS next Y | 13.04% |
| PEG | 4.06 | EPS past 5Y | 24.06% |
| P/S | 7.72 | EPS next 5Y | 16.22% |
| P/B | 4.51 | EPS Q/Q | 1576.91% |
| Dividend | 0.13% | Sales Q/Q | 10.77% |
| Insider Own | 3.10% | Inst Own | 81.33% |
| Insider Trans | -10.38% | Inst Trans | -0.97% |
| Short Float | 1.07% | Earnings | Feb 28/a |
| Analyst Recom | 1.65 | Target Price | 336.93 |
| Avg Volume | 5.66M | 52W Range | 193.68 - 318.71 |
|
|
|
|
Salesforce, Inc. engages in the design and development of cloud-based enterprise software for customer relationship management. Its solutions include sales force automation, customer service and support, marketing automation, digital commerce, community management, collaboration, industry-specific solutions, and salesforce platform. The firm also provides guidance, support, training, and advisory services. The company was founded by Marc Russell Benioff and Parker Harris in 1999 and is headquartered in San Francisco, CA. |
| Insider Trading |
Relationship |
Date |
Transaction |
Cost |
#Shares |
Value ($) |
#Shares Total |
SEC Form 4 |
| Benioff Marc | Chair and CEO | May 06 '24 | Sale | 275.45 | 15,000 | 4,131,753 | 12,662,327 | May 07 04:39 PM | | Benioff Marc | Chair and CEO | May 03 '24 | Sale | 275.01 | 15,000 | 4,125,180 | 12,677,327 | May 06 04:54 PM | | Benioff Marc | Chair and CEO | May 02 '24 | Sale | 271.11 | 15,000 | 4,066,627 | 12,692,327 | May 03 04:21 PM | | Tallapragada Srinivas | Pres/Chief Engineering Officer | May 01 '24 | Sale | 268.12 | 50,051 | 13,419,732 | 21,223 | May 02 05:30 PM | | Benioff Marc | Chair and CEO | May 01 '24 | Sale | 269.53 | 15,000 | 4,043,016 | 12,707,327 | May 02 05:11 PM |
|
|
|
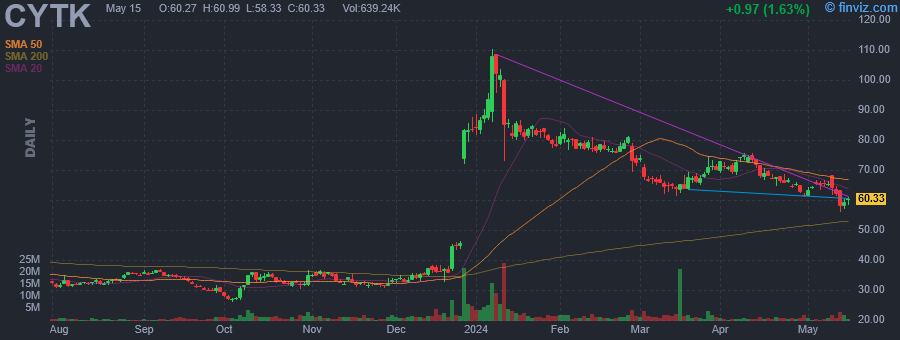 |
| Market Cap | 6.83B | EPS (ttm) | -5.45 |
| P/E | - | EPS this Y | 18.30% |
| Forward P/E | - | EPS next Y | 24.14% |
| PEG | - | EPS past 5Y | -22.79% |
| P/S | 906.64 | EPS next 5Y | 15.00% |
| P/B | - | EPS Q/Q | 4.77% |
| Dividend | - | Sales Q/Q | -14.56% |
| Insider Own | 3.28% | Inst Own | 108.11% |
| Insider Trans | -6.85% | Inst Trans | -1.39% |
| Short Float | 13.88% | Earnings | May 08/a |
| Analyst Recom | 1.35 | Target Price | 95.06 |
| Avg Volume | 1.93M | 52W Range | 25.98 - 110.25 |
|
|
|
|
Cytokinetics, Inc. is a biopharmaceutical company, which is focused on discovering, developing, and commercializing muscle activators and muscle inhibitors as potential treatments for people with debilitating diseases in which muscle performance is compromised and/or declining. The firm is developing small molecule drug candidates specifically engineered to impact muscle function and contractility. Its clinical-stage drug candidates include omecamtiv mecarbil, a novel cardiac myosin activator, CK-136, a novel cardiac troponin activator, reldesemtiv, a novel fast skeletal muscle troponin activator, aficamten, a novel cardiac myosin inhibitor, and CK-3772271, a novel cardiac myosin inhibitor. The company was founded by Ronald D. Vale, Lawrence S. B. Goldstein, James H. Sabry, and James A. Spudich in 1997 and is headquartered in South San Francisco, CA. |
| Insider Trading |
Relationship |
Date |
Transaction |
Cost |
#Shares |
Value ($) |
#Shares Total |
SEC Form 4 |
| Malik Fady Ibraham | EVP Research & Development | May 07 '24 | Option Exercise | 6.67 | 14,186 | 94,621 | 152,603 | May 07 04:37 PM | | Malik Fady Ibraham | EVP Research & Development | May 07 '24 | Sale | 65.11 | 15,547 | 1,012,265 | 137,056 | May 07 04:37 PM | | HENDERSON JOHN T | Director | Apr 25 '24 | Sale | 64.54 | 10,562 | 681,671 | 32,070 | Apr 25 06:54 PM | | Malik Fady Ibraham | EVP Research & Development | Apr 09 '24 | Option Exercise | 6.67 | 28,605 | 190,795 | 171,172 | Apr 09 04:38 PM | | Malik Fady Ibraham | EVP Research & Development | Apr 09 '24 | Sale | 74.31 | 32,605 | 2,422,918 | 138,567 | Apr 09 04:38 PM |
|
|
|
