 |
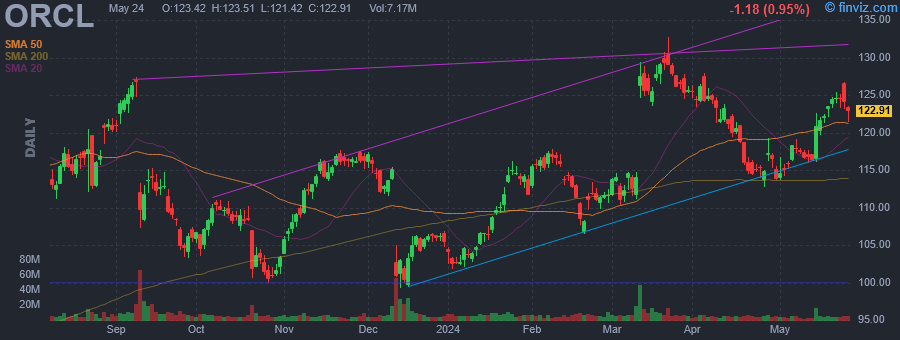
| Market Cap | 322.65B | EPS (ttm) | 3.78 |
| P/E | 31.02 | EPS this Y | 9.14% |
| Forward P/E | 19.06 | EPS next Y | 10.23% |
| PEG | 2.90 | EPS past 5Y | 29.43% |
| P/S | 6.14 | EPS next 5Y | 10.71% |
| P/B | 57.35 | EPS Q/Q | 24.70% |
| Dividend | 1.31% | Sales Q/Q | 7.11% |
| Insider Own | 41.91% | Inst Own | 43.77% |
| Insider Trans | -0.29% | Inst Trans | 0.28% |
| Short Float | 0.82% | Earnings | Mar 11/a |
| Analyst Recom | 1.97 | Target Price | 140.09 |
| Avg Volume | 8.38M | 52W Range | 96.10 - 132.77 |
|
|
|
|
Oracle Corp. engages in the provision of products and services that address aspects of corporate information technology environments, including applications and infrastructure technologies. It operates through the following business segments: Cloud and License, Hardware, and Services. The Cloud and License segment markets, sells, and delivers enterprise applications and infrastructure technologies through cloud and on-premise deployment models including cloud services and license support offerings. The Hardware segment provides infrastructure technologies including Oracle Engineered Systems, servers, storage, industry-specific hardware, operating systems, virtualization, management, and other hardware-related software. The Services segment offers consulting, advanced support, and education services. The company was founded by Lawrence Joseph Ellison, Robert Nimrod Miner, and Edward A. Oates on June 16, 1977 and is headquartered in Austin, TX. |
| Insider Trading |
Relationship |
Date |
Transaction |
Cost |
#Shares |
Value ($) |
#Shares Total |
SEC Form 4 |
| BOSKIN MICHAEL J | Director | May 07 '24 | Option Exercise | 43.49 | 45,000 | 1,957,050 | 132,473 | May 08 05:19 PM | | BOSKIN MICHAEL J | Director | May 07 '24 | Sale | 117.74 | 45,000 | 5,298,196 | 87,473 | May 08 05:19 PM | | CONRADES GEORGE H | Director | May 03 '24 | Option Exercise | 42.02 | 20,000 | 840,400 | 37,836 | May 06 04:52 PM | | CONRADES GEORGE H | Director | May 03 '24 | Sale | 116.00 | 20,000 | 2,320,000 | 17,836 | May 06 04:52 PM | | CONRADES GEORGE H | Director | May 01 '24 | Option Exercise | 42.02 | 25,000 | 1,050,500 | 42,836 | May 02 08:35 PM |
|
|
 |
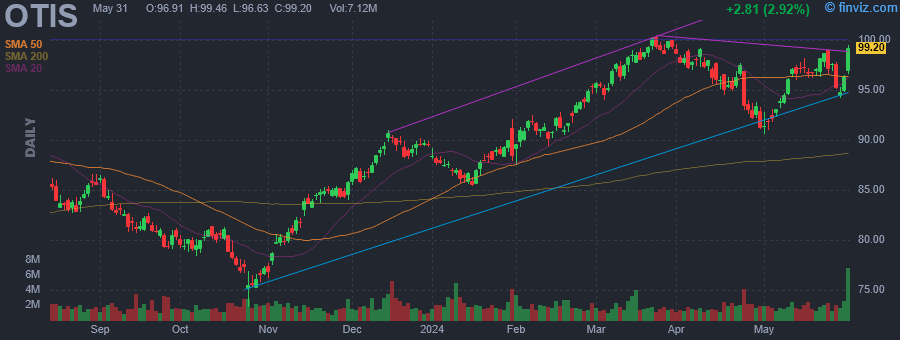 |
| Market Cap | 38.22B | EPS (ttm) | 3.46 |
| P/E | 27.29 | EPS this Y | 9.35% |
| Forward P/E | 22.13 | EPS next Y | 10.33% |
| PEG | 2.60 | EPS past 5Y | 6.96% |
| P/S | 2.67 | EPS next 5Y | 10.50% |
| P/B | - | EPS Q/Q | 9.19% |
| Dividend | 1.59% | Sales Q/Q | 2.72% |
| Insider Own | 0.12% | Inst Own | 90.00% |
| Insider Trans | -18.71% | Inst Trans | 0.00% |
| Short Float | 1.33% | Earnings | Apr 24/b |
| Analyst Recom | 2.41 | Target Price | 100.28 |
| Avg Volume | 1.88M | 52W Range | 73.32 - 100.35 |
|
|
|
|
Otis Worldwide Corp. engages in the manufacture, installation, and provision of escalator and escalator services. It operates through the New Equipment and Service segments. The New Equipment segment designs, manufactures, sells, and installs a wide range of passenger and freight elevators. The Service segment offers maintenance and repair services, and modernization services to upgrade elevators and escalators. The company was founded by Elisha Graves Otis in 1853 and is headquartered in Farmington, CT. |
| Insider Trading |
Relationship |
Date |
Transaction |
Cost |
#Shares |
Value ($) |
#Shares Total |
SEC Form 4 |
| Zheng Peiming | EVP, Chief Product, Delivery | May 07 '24 | Option Exercise | 62.68 | 40,687 | 2,550,160 | 73,329 | May 08 05:16 PM | | Zheng Peiming | EVP, Chief Product, Delivery | May 07 '24 | Sale | 93.69 | 30,364 | 2,844,682 | 15,570 | May 08 05:16 PM | | de Montlivault Stephane | President, Otis Asia Pacific | Feb 21 '24 | Option Exercise | 65.13 | 64,247 | 4,184,247 | 131,521 | Feb 23 04:32 PM | | de Montlivault Stephane | President, Otis Asia Pacific | Feb 21 '24 | Sale | 91.10 | 18,393 | 1,675,626 | 67,274 | Feb 23 04:32 PM | | LaFreniere Nora E. | EVP, General Counsel | Feb 20 '24 | Option Exercise | 54.66 | 14,811 | 809,632 | 55,939 | Feb 20 06:01 PM |
|
|
|
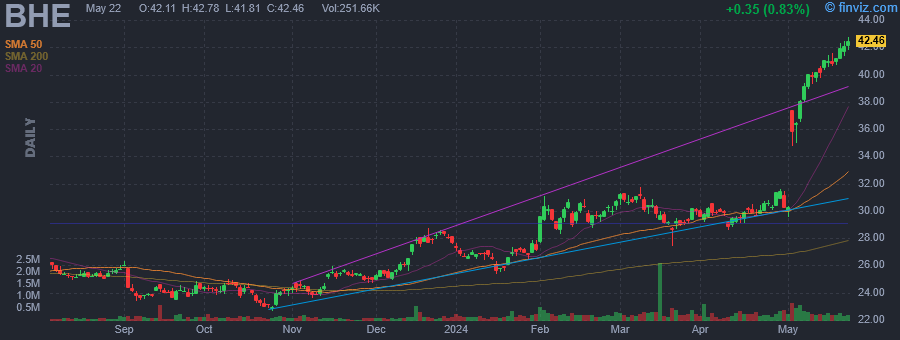 |
| Market Cap | 1.44B | EPS (ttm) | 1.83 |
| P/E | 21.83 | EPS this Y | 1.96% |
| Forward P/E | 16.44 | EPS next Y | 17.07% |
| PEG | 0.99 | EPS past 5Y | 29.60% |
| P/S | 0.51 | EPS next 5Y | 22.00% |
| P/B | 1.33 | EPS Q/Q | 10.77% |
| Dividend | 1.65% | Sales Q/Q | -2.75% |
| Insider Own | 2.57% | Inst Own | 94.55% |
| Insider Trans | -3.92% | Inst Trans | 0.44% |
| Short Float | 2.00% | Earnings | May 01/a |
| Analyst Recom | 1.50 | Target Price | 35.75 |
| Avg Volume | 335.48K | 52W Range | 20.58 - 39.40 |
|
|
|
|
Benchmark Electronics, Inc. engages in the provision of integrated electronic manufacturing services, engineering and design services, and technology solutions. It operates through the following geographical segments: Americas, Asia, and Europe. The firm offers services to original equipment manufacturers of industrial control telecommunication equipment, computers, and related products for business enterprises, medical devices, and testing and instrumentation products. Its services include comprehensive and integrated design and manufacturing services and solutions from initial product concept to volume production, including direct order fulfillment and aftermarket services. The company was founded by Cary T. Fu, Steven A. Barton, and Donald E. Nigbor in 1979 and is headquartered in Tempe, AZ. |
| Insider Trading |
Relationship |
Date |
Transaction |
Cost |
#Shares |
Value ($) |
#Shares Total |
SEC Form 4 |
| McCreary Jeffrey Stephen | Director | May 08 '24 | Sale | 39.49 | 10,000 | 394,900 | 45,062 | May 08 05:09 PM | | JANICK JAN M | SVP, Chief Technology Officer | May 07 '24 | Sale | 38.87 | 6,777 | 263,422 | 67,774 | May 08 05:06 PM | | Kamal Arvind | Interim CFO | May 07 '24 | Sale | 38.38 | 783 | 30,052 | 20,735 | May 08 05:04 PM | | Benck Jeff | President and CEO | Feb 20 '24 | Option Exercise | 29.22 | 68,305 | 1,995,872 | 442,749 | Feb 22 09:33 PM | | Beaver Stephen J | SVP, General Counsel and CLO | Feb 20 '24 | Option Exercise | 0.00 | 13,213 | 0 | 86,779 | Feb 22 09:35 PM |
|
|
| |
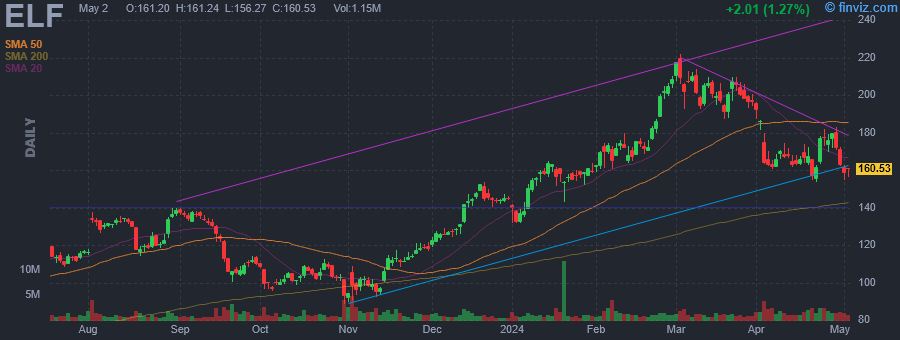 |
| Market Cap | 8.96B | EPS (ttm) | 2.26 |
| P/E | 71.53 | EPS this Y | 79.30% |
| Forward P/E | 45.33 | EPS next Y | 19.60% |
| PEG | 2.00 | EPS past 5Y | 10.33% |
| P/S | 10.06 | EPS next 5Y | 35.80% |
| P/B | 14.56 | EPS Q/Q | 35.46% |
| Dividend | - | Sales Q/Q | 84.90% |
| Insider Own | 4.54% | Inst Own | 97.51% |
| Insider Trans | -23.08% | Inst Trans | 1.79% |
| Short Float | 6.35% | Earnings | May 22/a |
| Analyst Recom | 1.69 | Target Price | 206.21 |
| Avg Volume | 1.48M | 52W Range | 83.80 - 221.83 |
|
|
|
|
e.l.f. Beauty, Inc. is a holding company, which engages in the provision of cosmetic and skin-care products. The company focuses on the e-commerce, national retailers, and international business channels. Its brands include elf, elf skin, WELL People and KEYS soulcare. The company was founded in 2004 and is headquartered in Oakland, CA. |
| Insider Trading |
Relationship |
Date |
Transaction |
Cost |
#Shares |
Value ($) |
#Shares Total |
SEC Form 4 |
| AMIN TARANG | Chief Executive Officer | May 06 '24 | Sale | 163.70 | 23,519 | 3,850,083 | 10,890 | May 08 05:07 PM | | Franks Joshua Allen | SVP, Operations | Apr 23 '24 | Sale | 172.50 | 12,506 | 2,157,285 | 86,237 | Apr 25 04:15 PM | | FIELDS MANDY J | See Remarks | Apr 23 '24 | Sale | 174.90 | 1,250 | 218,625 | 77,146 | Apr 25 04:15 PM | | MARCHISOTTO KORY | See Remarks | Apr 19 '24 | Sale | 158.51 | 24,992 | 3,961,483 | 131,977 | Apr 23 04:42 PM | | FIELDS MANDY J | See Remarks | Apr 19 '24 | Sale | 158.49 | 23,745 | 3,763,410 | 78,396 | Apr 23 04:44 PM |
|
|
|
 |
| Market Cap | 2.04B | EPS (ttm) | -0.30 |
| P/E | - | EPS this Y | 108.52% |
| Forward P/E | 19.74 | EPS next Y | 1218.78% |
| PEG | - | EPS past 5Y | -2.67% |
| P/S | 2.44 | EPS next 5Y | - |
| P/B | 2.00 | EPS Q/Q | 7.47% |
| Dividend | - | Sales Q/Q | 10.82% |
| Insider Own | 1.62% | Inst Own | 69.23% |
| Insider Trans | -0.99% | Inst Trans | 1.66% |
| Short Float | 4.88% | Earnings | May 01/a |
| Analyst Recom | 1.33 | Target Price | 5.51 |
| Avg Volume | 8.04M | 52W Range | 2.00 - 5.47 |
|
|
|
|
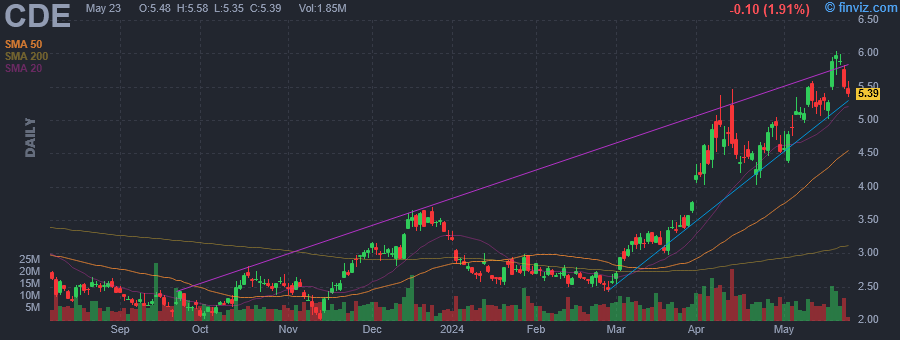
Coeur Mining, Inc. engages in the exploration and development of silver and gold mining properties and mines located in United States, Canada, and Mexico. It operates through the following segments: Palmarejo, Rochester, Kensington, and Wharf, and Other. The Palmarejo segment includes a gold-silver complex. The Rochester segment operates an open pit heap leach silver-gold mine in northwestern Nevada. The Kensington segment relates to an underground gold mine located north of Juneau, Alaska. The Wharf segment focuses on an open pit heap leach gold mine located near Lead, South Dakota. The company was founded in 1928 and is headquartered in Chicago, IL. |
| Insider Trading |
Relationship |
Date |
Transaction |
Cost |
#Shares |
Value ($) |
#Shares Total |
SEC Form 4 |
| Edwards Sebastian | Director | May 07 '24 | Sale | 5.08 | 20,000 | 101,600 | 103,100 | May 08 05:06 PM | | Watkinson Kenneth J | VP, Corporate Controller & CAO | May 03 '24 | Sale | 4.86 | 44,000 | 213,620 | 140,719 | May 06 04:35 PM | | McGrath Aoife | SVP, Exploration | Mar 15 '24 | Buy | 3.23 | 6,200 | 20,020 | 207,308 | Mar 19 05:03 PM | | Watkinson Kenneth J | VP, Corporate Controller & CAO | Nov 27 '23 | Sale | 2.81 | 7,000 | 19,684 | 134,051 | Nov 27 07:06 PM | | McGrath Aoife | SVP, Exploration | Sep 11 '23 | Buy | 2.35 | 6,200 | 14,558 | 129,217 | Sep 13 04:42 PM |
|
|
| |
 |
| Market Cap | 1.38B | EPS (ttm) | 6.66 |
| P/E | 8.10 | EPS this Y | 8.29% |
| Forward P/E | 7.96 | EPS next Y | 4.62% |
| PEG | - | EPS past 5Y | 29.04% |
| P/S | 1.82 | EPS next 5Y | - |
| P/B | 1.85 | EPS Q/Q | 28.86% |
| Dividend | 0.37% | Sales Q/Q | 10.35% |
| Insider Own | 1.66% | Inst Own | 94.28% |
| Insider Trans | -5.16% | Inst Trans | 0.19% |
| Short Float | 6.18% | Earnings | Apr 24/a |
| Analyst Recom | 2.33 | Target Price | 63.00 |
| Avg Volume | 171.43K | 52W Range | 41.79 - 60.49 |
|
|
|
|
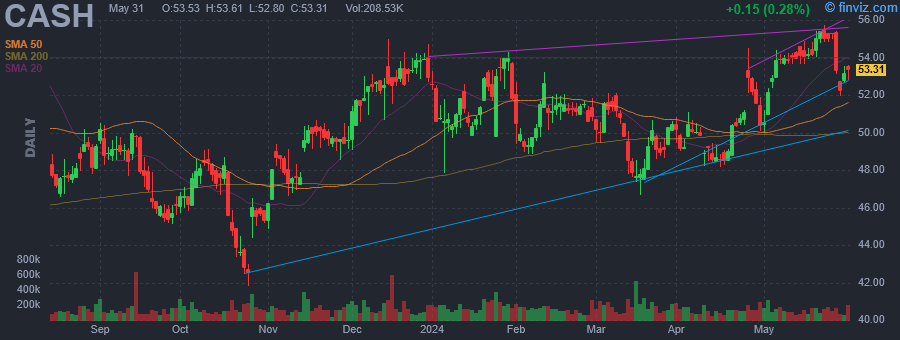
Pathward Financial, Inc. operates as a financial holding company, which provides savings and loan services. The firm operates through the following business segments: Consumer, Commercial, and Corporate Services and Other. The Consumer segment provides meta payment systems (MPS), consumer credit products, warehouse finance and other tax services. The Commercial segment includes the Crestmark and AFS divisions. The Corporate Services and Other segment consists of certain shared services, treasury, retained community bank portfolio and student loan lending portfolio. The company was founded on June 14, 1993 and is headquartered in Sioux Falls, SD. |
| Insider Trading |
Relationship |
Date |
Transaction |
Cost |
#Shares |
Value ($) |
#Shares Total |
SEC Form 4 |
| Stork Kendall E | Director | May 06 '24 | Sale | 53.53 | 2,000 | 107,060 | 11,213 | May 08 05:05 PM | | Sharett Anthony M. | President | Mar 15 '24 | Sale | 47.50 | 1,000 | 47,500 | 33,146 | Mar 18 05:38 PM | | Herrick Glen William | EVP, Exec. Adv | Dec 01 '23 | Sale | 50.50 | 13,854 | 699,627 | 91,145 | Dec 01 04:08 PM | | Herrick Glen William | EVP, Exec. Adv | Nov 29 '23 | Sale | 50.50 | 165 | 8,332 | 104,999 | Dec 01 04:08 PM | | Herrick Glen William | EVP, CFO | Nov 21 '23 | Sale | 50.50 | 11 | 556 | 105,164 | Nov 24 05:06 PM |
|
|
|
 |
| Market Cap | 1.80B | EPS (ttm) | 3.91 |
| P/E | 9.76 | EPS this Y | 3.26% |
| Forward P/E | 9.58 | EPS next Y | 0.70% |
| PEG | 1.22 | EPS past 5Y | 20.32% |
| P/S | 2.22 | EPS next 5Y | 8.00% |
| P/B | 1.48 | EPS Q/Q | 8.90% |
| Dividend | 2.62% | Sales Q/Q | 18.25% |
| Insider Own | 1.91% | Inst Own | 92.97% |
| Insider Trans | -17.75% | Inst Trans | -2.05% |
| Short Float | 0.82% | Earnings | Apr 18/b |
| Analyst Recom | 1.00 | Target Price | 43.00 |
| Avg Volume | 236.69K | 52W Range | 23.11 - 39.04 |
|
|
|
|
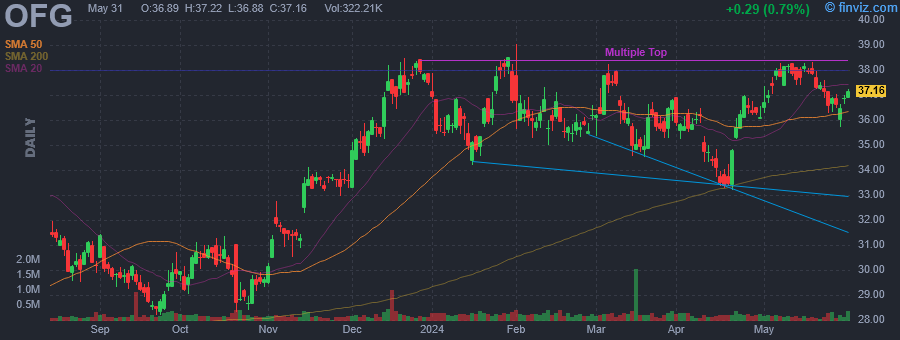
OFG Bancorp is a holding company, which engages in the provision of banking and financial services. It operates through the following segments: Banking, Wealth Management, and Treasury. The Banking segment includes its branches and traditional banking products such as deposits and commercial, consumer, and mortgage loans. The Wealth Management segment is involved in financial planning, money management and investment banking, brokerage services, insurance sales activity, corporate and individual trust and retirement services, and retirement plan administration services. The Treasury segment focuses on all its asset and liability management activities, such as purchases and sales of investment securities, interest rate risk management, derivatives, and borrowings. The company was founded in 1964 and is headquartered in San Juan, Puerto Rico. |
| Insider Trading |
Relationship |
Date |
Transaction |
Cost |
#Shares |
Value ($) |
#Shares Total |
SEC Form 4 |
| Kumar Ganesh | Chief Strategy Officer, US | May 08 '24 | Sale | 37.93 | 6,695 | 253,931 | 76,578 | May 08 05:05 PM | | Kumar Ganesh | Chief Strategy Officer, US | May 07 '24 | Sale | 38.04 | 8,062 | 306,651 | 83,273 | May 08 05:05 PM | | Kumar Ganesh | Chief Strategy Officer, US | May 06 '24 | Sale | 38.00 | 20,074 | 762,902 | 91,335 | May 08 05:05 PM | | Kumar Ganesh | Chief Strategy Officer, US | Mar 28 '24 | Sale | 36.40 | 7,628 | 277,659 | 111,409 | Mar 28 03:58 PM | | Kumar Ganesh | Chief Strategy Officer, US | Mar 27 '24 | Sale | 35.91 | 15,768 | 566,229 | 119,037 | Mar 28 03:58 PM |
|
|
| |
 |
| Market Cap | 4.36B | EPS (ttm) | 1.31 |
| P/E | 42.82 | EPS this Y | 54.03% |
| Forward P/E | 33.00 | EPS next Y | 51.31% |
| PEG | 2.14 | EPS past 5Y | -5.30% |
| P/S | 6.56 | EPS next 5Y | 20.00% |
| P/B | 4.69 | EPS Q/Q | 1494.83% |
| Dividend | - | Sales Q/Q | 0.76% |
| Insider Own | 1.03% | Inst Own | 99.73% |
| Insider Trans | -12.61% | Inst Trans | -0.98% |
| Short Float | 3.26% | Earnings | May 01/a |
| Analyst Recom | 2.20 | Target Price | 51.66 |
| Avg Volume | 519.69K | 52W Range | 27.46 - 56.98 |
|
|
|
|
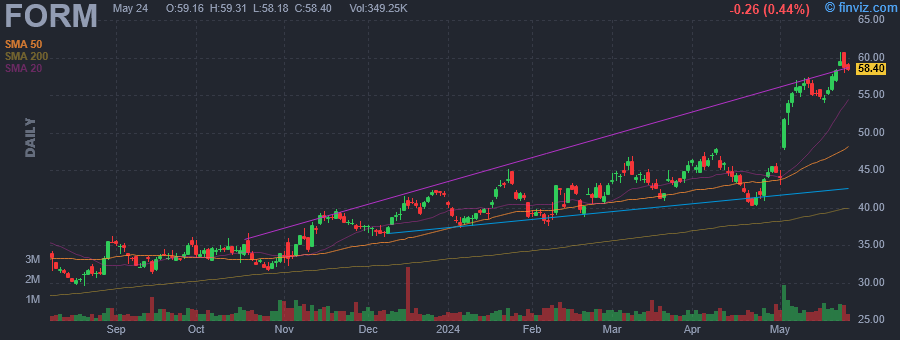
FormFactor, Inc. engages in the provision of test and measurement solutions. It operates through the following business segments: Probe Cards and Systems. The Probe Cards segment consists of technologies and product architectures, including micro-electromechanical systems technologies. The Systems segment consists of analytical probe solutions for on-wafer probing, board tests, and package tests. The company was founded by Igor Khandros on April 15, 1993 and is headquartered in Livermore, CA. |
| Insider Trading |
Relationship |
Date |
Transaction |
Cost |
#Shares |
Value ($) |
#Shares Total |
SEC Form 4 |
| Shahar Shai | CFO, SVP Global Finance | May 07 '24 | Option Exercise | 0.00 | 2,955 | 0 | 18,624 | May 08 05:02 PM | | Rhodes Sheri | Director | May 07 '24 | Sale | 56.02 | 13,319 | 746,144 | 7,634 | May 08 04:48 PM | | Shahar Shai | CFO, SVP Global Finance | May 07 '24 | Sale | 55.76 | 6,094 | 339,771 | 15,669 | May 08 05:02 PM | | Shahar Shai | CFO, SVP Global Finance | May 06 '24 | Sale | 54.40 | 5,828 | 317,063 | 21,763 | May 08 05:02 PM | | STEVEN-WAISS KELLEY | Director | May 06 '24 | Sale | 54.24 | 4,800 | 260,335 | 32,593 | May 08 04:29 PM |
|
|
|
 |
| Market Cap | 182.56B | EPS (ttm) | 3.21 |
| P/E | 32.69 | EPS this Y | 4.29% |
| Forward P/E | 20.40 | EPS next Y | 11.07% |
| PEG | 4.04 | EPS past 5Y | 19.65% |
| P/S | 4.53 | EPS next 5Y | 8.10% |
| P/B | 4.70 | EPS Q/Q | -7.32% |
| Dividend | 2.02% | Sales Q/Q | 2.23% |
| Insider Own | 0.73% | Inst Own | 76.72% |
| Insider Trans | -0.76% | Inst Trans | 0.27% |
| Short Float | 0.75% | Earnings | Apr 17/b |
| Analyst Recom | 1.81 | Target Price | 126.68 |
| Avg Volume | 5.62M | 52W Range | 89.67 - 121.64 |
|
|
|
|
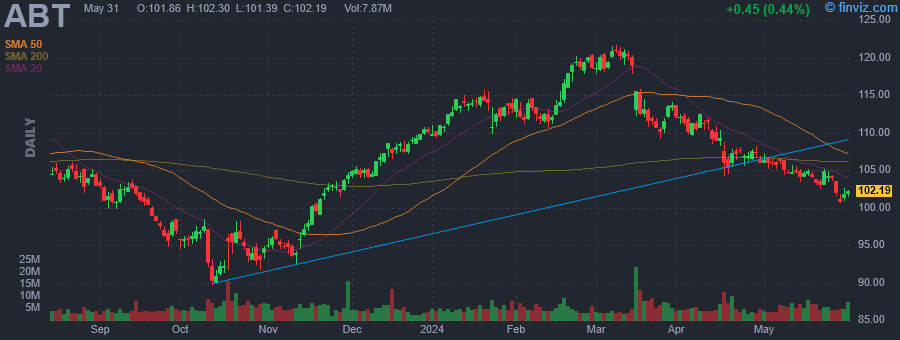
Abbott Laboratories engages in the discovery, development, manufacture, and sale of health care products. It operates through the following business segments: Established Pharmaceutical Products, Diagnostic Products, Nutritional Products, and Medical Devices. The Established Pharmaceutical Products segment refers to the international sales of a line of branded generic pharmaceutical products. The Diagnostic Products segment markets diagnostic systems and tests for blood banks, hospitals, commercial laboratories, and alternate-care testing sites. The Nutritional Products segment caters to the worldwide sales of adult and pediatric nutritional products. The Medical Devices segment includes electrophysiology, heart failure, vascular and structural heart devices for the treatment of cardiovascular diseases, and diabetes care products for people with diabetes, as well as neuromodulation devices for the management of chronic pain and movement disorders. The company was founded by Wallace Calvin Abbott in 1888 and is headquartered in Abbott Park, IL. |
| Insider Trading |
Relationship |
Date |
Transaction |
Cost |
#Shares |
Value ($) |
#Shares Total |
SEC Form 4 |
| Earnhardt Lisa D | EXECUTIVE VICE PRESIDENT | May 07 '24 | Sale | 106.25 | 22,852 | 2,428,119 | 61,462 | May 08 05:00 PM | | Salvadori Daniel Gesua Sive | EXECUTIVE VICE PRESIDENT | Mar 01 '24 | Sale | 118.50 | 963 | 114,116 | 125,697 | Mar 04 07:18 PM | | ALLEN HUBERT L | EXECUTIVE VICE PRESIDENT | Mar 01 '24 | Sale | 118.50 | 853 | 101,080 | 184,806 | Mar 04 06:39 PM | | Morrone Louis H. | EXECUTIVE VICE PRESIDENT | Mar 01 '24 | Sale | 118.50 | 801 | 94,918 | 62,968 | Mar 04 07:14 PM | | Earnhardt Lisa D | EXECUTIVE VICE PRESIDENT | Mar 01 '24 | Sale | 118.50 | 694 | 82,239 | 84,314 | Mar 04 06:50 PM |
|
|
|
 |
| Market Cap | 43.58B | EPS (ttm) | 2.29 |
| P/E | 15.66 | EPS this Y | 1.65% |
| Forward P/E | 11.24 | EPS next Y | 5.39% |
| PEG | 3.85 | EPS past 5Y | - |
| P/S | 1.64 | EPS next 5Y | 4.07% |
| P/B | 0.88 | EPS Q/Q | -3.32% |
| Dividend | 4.46% | Sales Q/Q | -1.20% |
| Insider Own | 0.38% | Inst Own | 79.35% |
| Insider Trans | -3.86% | Inst Trans | 2.86% |
| Short Float | 1.94% | Earnings | May 01/b |
| Analyst Recom | 2.09 | Target Price | 39.61 |
| Avg Volume | 8.17M | 52W Range | 30.68 - 41.33 |
|
|
|
|
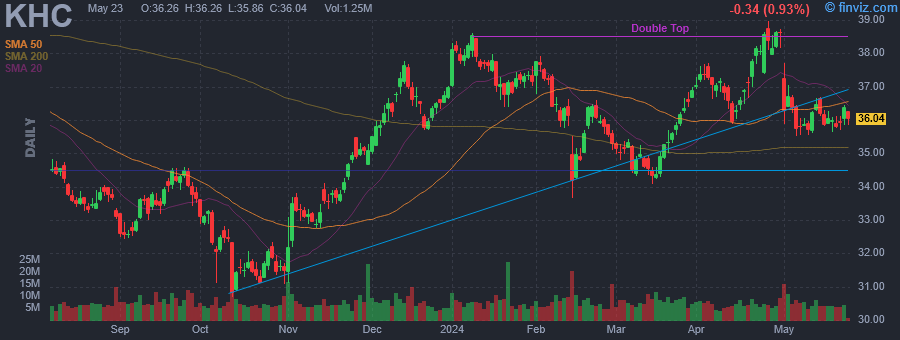
The Kraft Heinz Co. engages in the manufacture and market of food and beverage products. It operates through the North America and International geographical segments. The company was founded on July 2, 2015, and is headquartered in Pittsburgh, PA. |
| Insider Trading |
Relationship |
Date |
Transaction |
Cost |
#Shares |
Value ($) |
#Shares Total |
SEC Form 4 |
| La Lande Rashida | Chief Lgl & Corp Affairs Ofcr | May 06 '24 | Sale | 35.95 | 10,140 | 364,552 | 158,266 | May 08 04:53 PM | | Onell Cory | Chief Omnich Sales & AEM Ofcr | Mar 12 '24 | Sale | 34.62 | 14,289 | 494,717 | 145,680 | Mar 14 04:29 PM | | La Lande Rashida | Chief Lgl & Corp Affairs Ofcr | Mar 04 '24 | Sale | 35.02 | 16,209 | 567,573 | 166,954 | Mar 05 05:06 PM | | Patricio Miguel | Director | Jan 02 '24 | Sale | 38.02 | 131,500 | 4,999,025 | 992,049 | Jan 04 04:23 PM | | La Lande Rashida | EVP, Global GC & CSCAO | Nov 24 '23 | Sale | 35.00 | 13,238 | 463,338 | 153,494 | Nov 28 04:44 PM |
|
|
|
