 |
| Market Cap | 9.85B | EPS (ttm) | 4.49 |
| P/E | 29.87 | EPS this Y | 17.65% |
| Forward P/E | 18.20 | EPS next Y | 25.44% |
| PEG | 16.59 | EPS past 5Y | 27.90% |
| P/S | 3.95 | EPS next 5Y | 1.80% |
| P/B | 11.91 | EPS Q/Q | -47.33% |
| Dividend | 0.30% | Sales Q/Q | 5.61% |
| Insider Own | 9.43% | Inst Own | 78.71% |
| Insider Trans | 0.05% | Inst Trans | 0.10% |
| Short Float | 2.99% | Earnings | Apr 24/a |
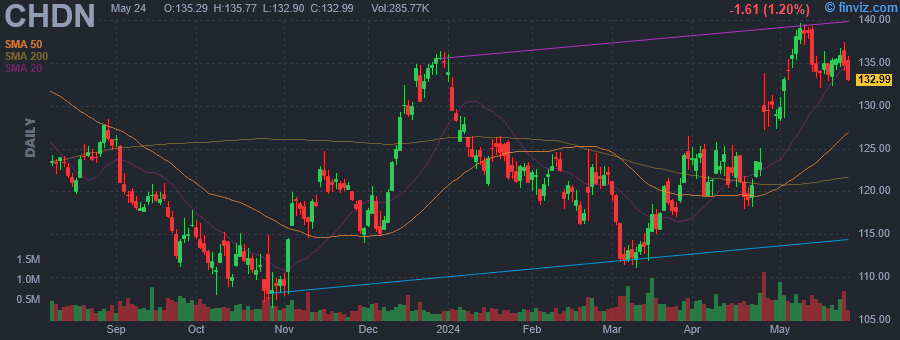
| Analyst Recom | 1.30 | Target Price | 148.33 |
| Avg Volume | 454.67K | 52W Range | 106.45 - 150.45 |
|
|
|
|
Churchill Downs, Inc. operates as a provider of pari-mutuel horse racing, online account wagering on horse racing and casino gaming. It operates through the following business segments: Racing, Casino, Online Wagering, Corporate, and Other Investments. The Racing segment includes Churchill Downs Racetrack, Arlington Park Racecourse, Calder Race Course, and Fair Grounds Race Course. The Casinos segment includes Oxford Casino, Riverwalk Casino Hotel, Harlow's Casino Resort and Spa, Calder Casino, Fair Grounds Slots, Video Services and equity investment. The Online Wagering segment offers simulcasting and interactive wagering hub. The Corporate segment includes miscellaneous and other revenue, compensation expense, professional fees and other general and administrative expenses not allocated to other operating segments. The Other Investments and Corporate segment consists of United Tote Company and United Tote Canada, Capital View Casino and Resort, Bluff Media, and minor investments. The company was founded in 1875 and is headquartered in Louisville, KY. |
| Insider Trading |
Relationship |
Date |
Transaction |
Cost |
#Shares |
Value ($) |
#Shares Total |
SEC Form 4 |
| VARGA PAUL C | Director | Apr 29 '24 | Buy | 130.22 | 3,800 | 494,836 | 28,902 | May 01 04:02 PM | | Adams Maureen | EVP, Gaming Operations | Feb 10 '24 | Option Exercise | 0.00 | 2,118 | 0 | 11,892 | Feb 13 04:04 PM | | Blackwell Bradley K. | EVP, General Counsel | Feb 10 '24 | Option Exercise | 0.00 | 3,212 | 0 | 23,185 | Feb 13 04:04 PM | | Mudd William E | President and COO | Dec 31 '23 | Option Exercise | 0.00 | 13,192 | 0 | 617,216 | Jan 03 04:41 PM | | Dall Marcia A | EVP, and CFO | Dec 31 '23 | Option Exercise | 0.00 | 8,570 | 0 | 135,072 | Jan 03 04:47 PM |
|
|
 |
 |
| Market Cap | 141.03M | EPS (ttm) | 0.59 |
| P/E | 11.03 | EPS this Y | -30.00% |
| Forward P/E | 10.29 | EPS next Y | 29.25% |
| PEG | 1.10 | EPS past 5Y | 4.29% |
| P/S | 1.23 | EPS next 5Y | 10.00% |
| P/B | 0.60 | EPS Q/Q | -43.00% |
| Dividend | 4.29% | Sales Q/Q | 9.99% |
| Insider Own | 12.28% | Inst Own | 56.07% |
| Insider Trans | 0.04% | Inst Trans | -1.79% |
| Short Float | 0.47% | Earnings | Apr 23/a |
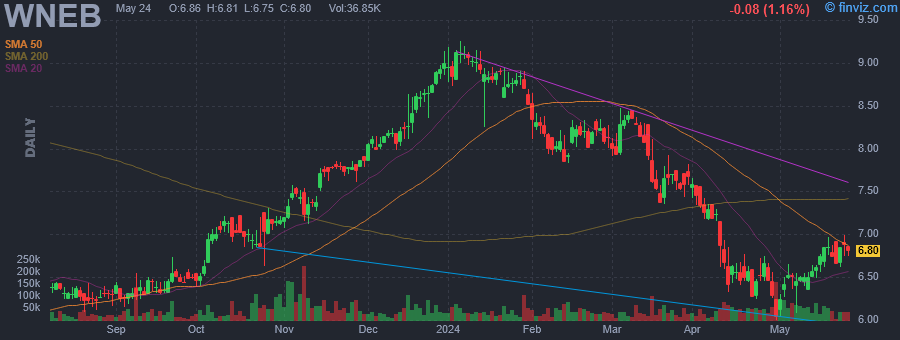
| Analyst Recom | 1.67 | Target Price | 8.50 |
| Avg Volume | 44.70K | 52W Range | 5.58 - 9.25 |
|
|
|
|
Western New England Bancorp, Inc. is a holding company, which engages in the provision of financial services. It offers a range of investment advisory and wealth management services. Its loan portfolio includes commercial real estate, residential real estate, commercial and industrial, and consumer loans. The company was founded in 1853 and is headquartered in Westfield, MA. |
| Insider Trading |
Relationship |
Date |
Transaction |
Cost |
#Shares |
Value ($) |
#Shares Total |
SEC Form 4 |
| Goncalves Filipe B | SVP & CCO | Apr 30 '24 | Buy | 6.03 | 500 | 3,012 | 24,225 | May 01 03:57 PM | | HAGAN JAMES C | President and CEO | Feb 14 '24 | Buy | 8.18 | 462 | 3,778 | 12,230 | Feb 16 04:35 PM | | Miles Allen J III | EVP & Senior Lender | May 12 '23 | Buy | 5.99 | 2,494 | 14,937 | 22,108 | May 16 04:19 PM | | Richter Steven G. | Director | May 12 '23 | Buy | 5.96 | 2,100 | 12,516 | 50,208 | May 16 04:20 PM | | Goncalves Filipe B | SVP & CCO | May 08 '23 | Buy | 6.05 | 750 | 4,539 | 17,498 | May 08 04:22 PM |
|
|
|
 |
| Market Cap | 8.37B | EPS (ttm) | 0.75 |
| P/E | 23.45 | EPS this Y | -20.31% |
| Forward P/E | 10.21 | EPS next Y | 102.15% |
| PEG | - | EPS past 5Y | -26.78% |
| P/S | 0.38 | EPS next 5Y | - |
| P/B | 1.16 | EPS Q/Q | -23.04% |
| Dividend | - | Sales Q/Q | -1.81% |
| Insider Own | 1.84% | Inst Own | 71.22% |
| Insider Trans | -1.80% | Inst Trans | 6.76% |
| Short Float | 6.06% | Earnings | Apr 22/a |
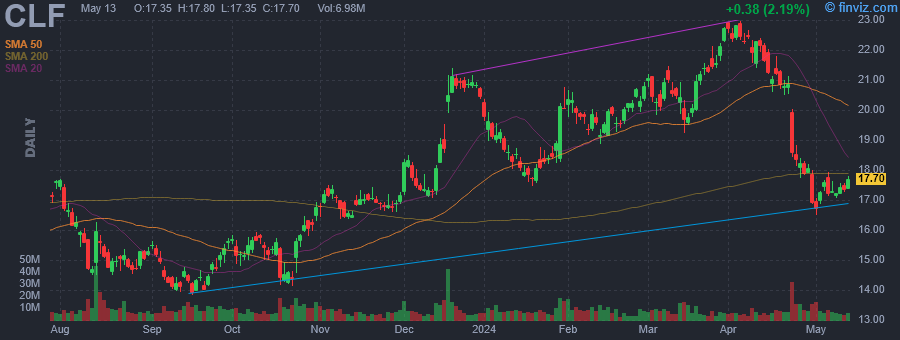
| Analyst Recom | 2.58 | Target Price | 21.69 |
| Avg Volume | 8.79M | 52W Range | 13.61 - 22.97 |
|
|
|
|
Cleveland-Cliffs, Inc. operates as a flat-rolled steel company, which supplies iron ore pellets to the North American steel industry. It engages in the production of metallic and coke, iron making, steelmaking, rolling and finishing, and downstream tubular components, stamping, and tooling. The company was founded in 1847 and is headquartered in Cleveland, OH. |
| Insider Trading |
Relationship |
Date |
Transaction |
Cost |
#Shares |
Value ($) |
#Shares Total |
SEC Form 4 |
| GONCALVES LOURENCO | Chairman, President & CEO | May 01 '24 | Buy | 16.76 | 60,000 | 1,005,666 | 2,759,089 | May 01 03:49 PM | | Bloom Ron A. | Director | May 01 '24 | Buy | 17.00 | 25,000 | 424,875 | 59,900 | May 01 10:37 AM | | GREEN SUSAN MIRANDA | Director | Mar 13 '24 | Sale | 20.40 | 6,500 | 132,601 | 90,286 | Mar 15 07:50 PM | | GONCALVES LOURENCO | Chairman, President & CEO | Mar 06 '24 | Option Exercise | 7.70 | 187,136 | 1,440,947 | 2,886,225 | Mar 08 06:34 PM | | Smith Clifford T | EVP & President, CC Steel | Mar 06 '24 | Option Exercise | 7.70 | 27,430 | 211,211 | 797,539 | Mar 08 06:36 PM |
|
|
| |
 |
| Market Cap | 136.19M | EPS (ttm) | 0.30 |
| P/E | 64.43 | EPS this Y | - |
| Forward P/E | - | EPS next Y | - |
| PEG | - | EPS past 5Y | -37.81% |
| P/S | 1.31 | EPS next 5Y | - |
| P/B | 1.00 | EPS Q/Q | 35.57% |
| Dividend | 3.51% | Sales Q/Q | 12.26% |
| Insider Own | 9.43% | Inst Own | 28.47% |
| Insider Trans | 7.48% | Inst Trans | -0.31% |
| Short Float | 2.30% | Earnings | Apr 24/a |
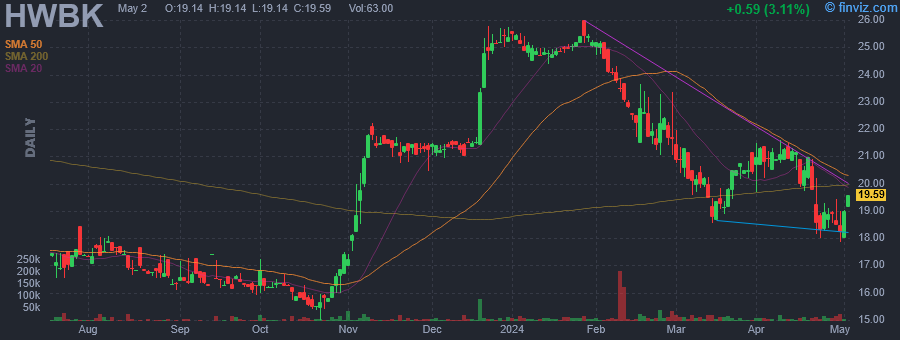
| Analyst Recom | - | Target Price | - |
| Avg Volume | 19.03K | 52W Range | 15.02 - 26.00 |
|
|
|
|
Hawthorn Bancshares, Inc. operates as a bank holding company, which provides banking services to individual and corporate customers through its subsidiary, Hawthorn Bank. It offers checking and savings accounts, internet banking, debit cards, certificates of deposit, brokerage services, personal loans, installment loans, trust services, credit related insurance, and safe deposit boxes. The company was founded in 1865 and is headquartered in Jefferson City, MO. |
| Insider Trading |
Relationship |
Date |
Transaction |
Cost |
#Shares |
Value ($) |
#Shares Total |
SEC Form 4 |
| Holtaway Jonathan | Director | Apr 30 '24 | Buy | 18.76 | 5,500 | 103,180 | 26,500 | May 01 11:26 AM | | GILES BRENT M | CHIEF EXECUTIVE OFFICER | Apr 30 '24 | Buy | 18.18 | 400 | 7,274 | 7,968 | May 01 03:28 PM | | Holtaway Jonathan | Director | Apr 29 '24 | Buy | 19.19 | 5,500 | 105,545 | 21,000 | May 01 11:26 AM | | GILES BRENT M | CHIEF EXECUTIVE OFFICER | Apr 29 '24 | Buy | 18.75 | 2,000 | 37,500 | 7,568 | May 01 03:28 PM | | Burkhead Frank E. | Director | Apr 29 '24 | Buy | 19.10 | 500 | 9,548 | 14,134 | May 01 02:36 PM |
|
|
|
 |
| Market Cap | 407.19M | EPS (ttm) | 2.70 |
| P/E | 20.24 | EPS this Y | - |
| Forward P/E | - | EPS next Y | - |
| PEG | - | EPS past 5Y | -7.81% |
| P/S | 2.39 | EPS next 5Y | - |
| P/B | 1.29 | EPS Q/Q | -31.18% |
| Dividend | 3.87% | Sales Q/Q | 9.92% |
| Insider Own | 14.95% | Inst Own | 25.93% |
| Insider Trans | 2.06% | Inst Trans | - |
| Short Float | 2.60% | Earnings | Apr 26/b |
| Analyst Recom | - | Target Price | - |
| Avg Volume | 13.90K | 52W Range | 42.91 - 85.00 |
|
|
|
May-03-24 07:30AM
|
Burke & Herbert Financial Services Corp. Completes Merger of Equals with Summit Financial Group, Inc.
(PR Newswire) +5.92% |
|
Apr-26-24 01:53PM
|
BHRB Stock Earnings: Burke & Herbert Financial Reported Results for Q1 2024
(InvestorPlace) |
|
08:30AM
|
Burke & Herbert Financial Services Corp. Announces First Quarter 2024 Results and Declares Common Stock Dividend
(PR Newswire) |
|
Apr-19-24 08:30AM
|
Burke & Herbert Financial Services Corp. and Summit Financial Group, Inc. Announce Receipt of Regulatory Approvals and Closing Date for Merger of Equals
(PR Newswire) |
|
Feb-01-24 12:02PM
|
Hedge Fund and Insider Trading News: David Einhorn, Crispin Odey, Bill Ackman, Stanley Druckenmiller, Ken Griffin, Burke Herbert Financial Services (BHRB), KalVista Pharmaceuticals, Inc. (KALV), and More
(Insider Monkey) |
|
Jan-26-24 08:00AM
|
Burke & Herbert Financial Services Corp. Announces Fourth Quarter and Full Year 2023 Results and Declares Common Stock Dividend
(PR Newswire) |
|
Dec-06-23 02:07PM
|
Burke & Herbert Financial Services Corp. and Summit Financial Group, Inc. Announce Receipt of Shareholder Approval for Merger
(PR Newswire) |
|
Oct-27-23 07:30AM
|
Burke & Herbert Financial Services Corp. Announces Third Quarter 2023 Results and Declares Common Stock Dividend
(PR Newswire) |
|
Oct-13-23 02:52PM
|
Burke & Herbert Bank Launches Goals for Good
(PR Newswire) |
|
Oct-02-23 12:00PM
|
Burke & Herbert Financial Services Corp. and Summit Financial Group, Inc. Submit Filings Related to Merger Agreement
(PR Newswire) |
|
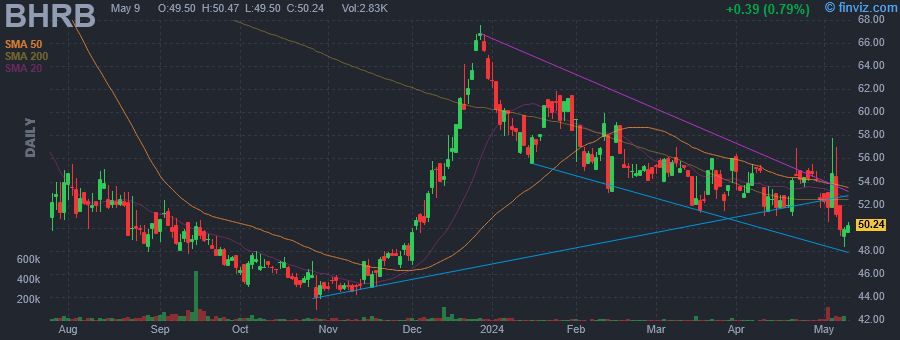
Burke Herbert Financial Services Corp. is a bank holding company, which engages in the provision of banking products and financial services to small to medium-sized businesses, their owners and employees, professional corporations, non-profits, and individuals. It operates through the following loan portfolio segments: Commercial Real Estate, Owner-Occupied Commercial Real Estate, Acquisition, Construction, and Development, Commercial and Industrial, Single Family Residential (1-4 Units), and Consumer Non-Real Estate and Other. The Commercial Real Estate segment includes leasing of the real estate collateral or income generated from the sale of the collateral. The Owner-Occupied Commercial Real Estate segment focuses on the operations of the business that occupies the property and the value of the collateral. The Acquisition, Construction, and Development segment offers creditworthiness of the borrower, project completion within budget, sale after completion, and the value of the collateral. The Commercial and Industrial segment is involved in the operations of the business and the value of the collateral. The Single Family Residential (1-4 Units) segment provides loans for investment purpose carry risk associated with the continued creditworthiness of the borrower, the value of the collateral, and either the net operating income generated from the lease of the real estate collateral or income generated from the sale of the collateral. The Consumer Non-Real Estate and Other segment covers loans carry risk associated with the creditworthiness of the borrower and the value of the collateral. The company was founded on September 14, 2022 and is headquartered in Alexandria, VA. |
| Insider Trading |
Relationship |
Date |
Transaction |
Cost |
#Shares |
Value ($) |
#Shares Total |
SEC Form 4 |
| McLaughlin Shawn Patrick | Director | May 01 '24 | Buy | 52.51 | 850 | 44,634 | 51,850 | May 01 02:33 PM | | Riojas Jose David | Director | Apr 30 '24 | Buy | 52.50 | 400 | 21,000 | 14,000 | Apr 30 03:13 PM | | Barnwell Julian Forrest Jr. | Director | Mar 15 '24 | Buy | 52.00 | 3,000 | 156,000 | 174,939 | Mar 15 10:54 AM | | McLaughlin Shawn Patrick | Director | Mar 04 '24 | Buy | 55.65 | 500 | 27,827 | 51,000 | Mar 04 03:43 PM | | Anderson Mark Guthrie | Director | Feb 21 '24 | Buy | 55.35 | 2,400 | 132,840 | 11,200 | Feb 21 11:28 AM |
|
|
| |
 |
| Market Cap | 353.27M | EPS (ttm) | 2.32 |
| P/E | 9.20 | EPS this Y | -5.19% |
| Forward P/E | 7.42 | EPS next Y | 12.24% |
| PEG | - | EPS past 5Y | 9.03% |
| P/S | 1.28 | EPS next 5Y | - |
| P/B | 0.64 | EPS Q/Q | 3.92% |
| Dividend | 3.88% | Sales Q/Q | 35.75% |
| Insider Own | 13.83% | Inst Own | 42.65% |
| Insider Trans | 1.26% | Inst Trans | 0.63% |
| Short Float | 0.27% | Earnings | Apr 24/a |
| Analyst Recom | 1.00 | Target Price | 26.00 |
| Avg Volume | 29.78K | 52W Range | 18.25 - 25.92 |
|
|
|
|
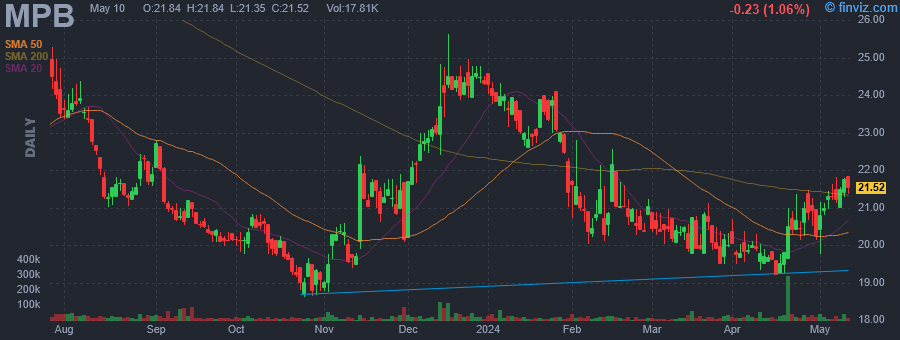
Mid Penn Bancorp, Inc. is a financial holding company, which engages in the provision of commercial banking and financial services. Its services include banking, financing, and planning to individuals, businesses, and nonprofit organizations. The company was founded in 1868 and is headquartered in Harrisburg, PA. |
| Insider Trading |
Relationship |
Date |
Transaction |
Cost |
#Shares |
Value ($) |
#Shares Total |
SEC Form 4 |
| De Soto Matthew G | Director | Apr 29 '24 | Buy | 20.76 | 9,615 | 199,563 | 79,190 | May 01 12:08 PM | | De Soto Matthew G | Director | Apr 29 '24 | Buy | 20.62 | 1,452 | 29,938 | 2,292 | May 01 12:08 PM | | Evans Albert J. | Director | Mar 28 '24 | Buy | 20.01 | 500 | 10,005 | 25,385 | Apr 01 02:27 PM | | De Soto Matthew G | Director | Mar 28 '24 | Buy | 20.01 | 400 | 8,004 | 69,575 | Apr 01 03:07 PM | | Grubic Robert C | Director | Mar 28 '24 | Buy | 20.01 | 250 | 5,002 | 61,869 | Apr 01 02:24 PM |
|
|
|
 |
| Market Cap | 14.17B | EPS (ttm) | 2.30 |
| P/E | 15.90 | EPS this Y | 7.87% |
| Forward P/E | 15.09 | EPS next Y | 7.63% |
| PEG | 39.74 | EPS past 5Y | 1.11% |
| P/S | 1.67 | EPS next 5Y | 0.40% |
| P/B | 0.71 | EPS Q/Q | 43.19% |
| Dividend | 4.85% | Sales Q/Q | -3.83% |
| Insider Own | 81.68% | Inst Own | 13.26% |
| Insider Trans | 0.00% | Inst Trans | -2.73% |
| Short Float | 5.08% | Earnings | Apr 23/a |
| Analyst Recom | 3.22 | Target Price | 35.91 |
| Avg Volume | 965.02K | 52W Range | 27.46 - 41.22 |
|
|
|
|
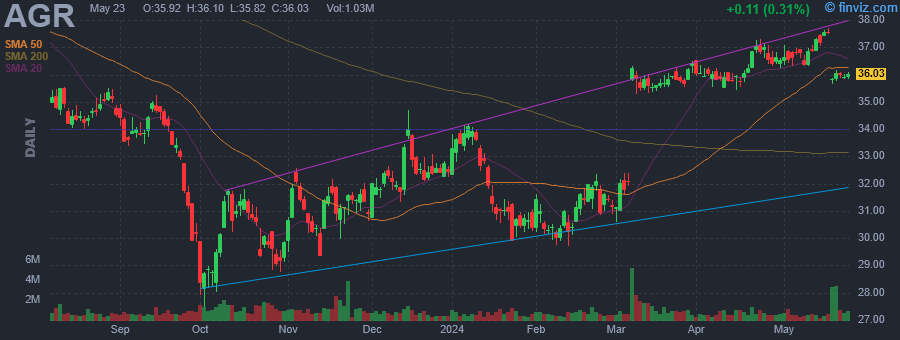
Avangrid, Inc. engages in the energy transmission and gas distribution. It operates through the following segments: Networks, Renewables, and Other. The Networks segment includes energy transmission and distribution, electric transmission, and gas distribution activities. The Renewables segment relates to renewable energy, mainly wind energy generation and trading related to such activities. The Other segment covers miscellaneous corporate revenues including intersegment eliminations. The company was founded in 1852 and is headquartered in Orange, CT. |
| Insider Trading |
Relationship |
Date |
Transaction |
Cost |
#Shares |
Value ($) |
#Shares Total |
SEC Form 4 |
| Solomont Alan D | Director | May 01 '24 | Buy | 36.48 | 137 | 4,998 | 10,742 | May 01 12:05 PM | | Solomont Alan D | Director | Apr 01 '24 | Buy | 36.52 | 138 | 5,040 | 10,605 | Apr 01 01:09 PM | | Miranda Soto Jose Antonio | See below | Mar 01 '24 | Option Exercise | 0.00 | 4,940 | 0 | 8,331 | Mar 04 06:17 PM | | Mahoney R. Scott | SVP - General Counsel & Sec. | Mar 01 '24 | Option Exercise | 0.00 | 9,100 | 0 | 15,032 | Mar 04 06:20 PM | | Azagra Blazquez Pedro | Chief Executive Officer | Mar 01 '24 | Option Exercise | 0.00 | 10,532 | 0 | 33,908 | Mar 04 06:23 PM |
|
|
| |
 |
| Market Cap | 63.59M | EPS (ttm) | 0.23 |
| P/E | 79.84 | EPS this Y | - |
| Forward P/E | - | EPS next Y | - |
| PEG | - | EPS past 5Y | -30.30% |
| P/S | 2.13 | EPS next 5Y | - |
| P/B | 0.85 | EPS Q/Q | -30.03% |
| Dividend | 5.93% | Sales Q/Q | -16.43% |
| Insider Own | 56.19% | Inst Own | 9.11% |
| Insider Trans | 0.54% | Inst Trans | 4.70% |
| Short Float | 0.22% | Earnings | - |
| Analyst Recom | - | Target Price | - |
| Avg Volume | 3.32K | 52W Range | 16.61 - 23.20 |
|
|
|
|
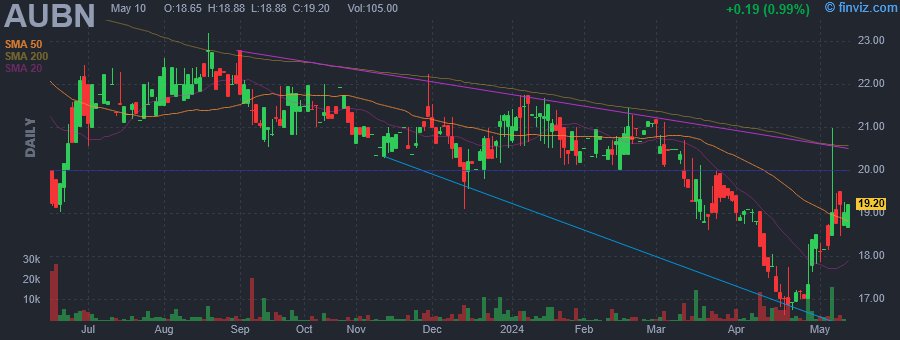
Auburn National Bancorporation, Inc. is a bank holding company. It engages in the provision of banking services to commercial and retail customers. The firm operates through the following segments: Commercial and Industrial, Construction and Land Development, Commercial Real Estate, Residential Real Estate, and Consumer Installment. The Commercial and Industrial segment includes loans to finance business operations, equipment purchases, or other needs for small and medium-sized commercial customers. The Construction and Land Development segment is comprised of both loans and credit lines for the purpose of purchasing, carrying and developing land into commercial developments or residential subdivisions. The Commercial and Industrial segment provides loans disaggregated into three classes: owner occupied, multi-family and other. The Residential Real Estate segment is involved in consumer mortgage and investment property. The Consumer Installment segment encompasses loans to individuals both secured by personal property and unsecured. The company was founded in 1990 and is headquartered in Auburn, AL. |
| Insider Trading |
Relationship |
Date |
Transaction |
Cost |
#Shares |
Value ($) |
#Shares Total |
SEC Form 4 |
| HOUSEL DAVID E | Director | Apr 30 '24 | Buy | 18.16 | 100 | 1,816 | 7,445 | May 01 11:46 AM | | Hedges David A | President\CEO | Apr 26 '24 | Buy | 17.60 | 10,000 | 176,000 | 11,663 | Apr 29 12:00 PM | | Barrett J Tutt | Director | Apr 09 '24 | Buy | 19.25 | 93 | 1,791 | 8,553 | Apr 10 10:43 AM | | HAM WILLIAM F JR | Director | Apr 09 '24 | Buy | 19.21 | 72 | 1,383 | 4,841 | Apr 10 10:59 AM | | HOUSEL DAVID E | Director | Apr 09 '24 | Buy | 19.25 | 64 | 1,232 | 7,345 | Apr 10 10:27 AM |
|
|
|
 |
| Market Cap | 91.96M | EPS (ttm) | 0.34 |
| P/E | 28.30 | EPS this Y | - |
| Forward P/E | - | EPS next Y | - |
| PEG | 1.89 | EPS past 5Y | 25.97% |
| P/S | 1.74 | EPS next 5Y | 15.00% |
| P/B | 2.51 | EPS Q/Q | 140.83% |
| Dividend | - | Sales Q/Q | 29.13% |
| Insider Own | 10.73% | Inst Own | 60.12% |
| Insider Trans | 1.29% | Inst Trans | -1.15% |
| Short Float | 0.45% | Earnings | Mar 14/a |
| Analyst Recom | 1.00 | Target Price | 17.00 |
| Avg Volume | 25.31K | 52W Range | 6.22 - 11.41 |
|
|
|
|
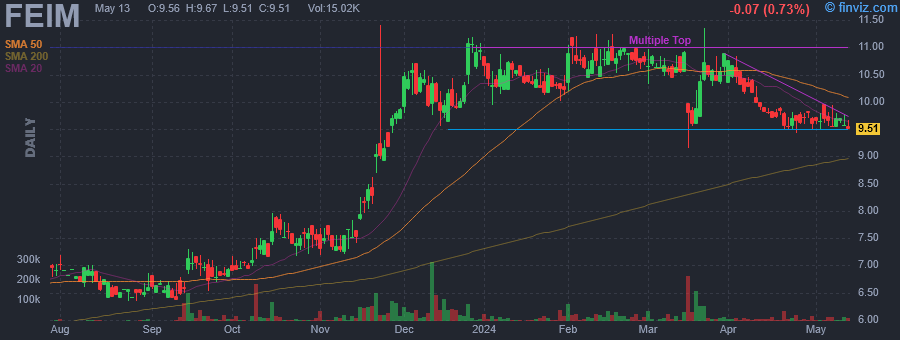
Frequency Electronics, Inc. engages in the design, development, and manufacture of precision time and frequency generation technology. It operates through the FEI-NY and FEI-Zyfer business segments. The FEI-NY segment provides precision time, frequency generation, and synchronization products and subsystems that are found on-board satellites, in ground-based communication stations, and imbedded in moving platforms. The FEI-Zyfer segment designs, develops, and manufactures products for precision time and frequency generation and synchronization, primarily incorporating GPS technology. The company was founded by Martin B. Bloch on August 25, 1961 and is headquartered in Mitchel Field, NY. |
| Insider Trading |
Relationship |
Date |
Transaction |
Cost |
#Shares |
Value ($) |
#Shares Total |
SEC Form 4 |
| Sarachek Russell M | Director | Apr 30 '24 | Buy | 9.50 | 687 | 6,526 | 436,034 | May 01 11:06 AM | | Sarachek Russell M | Director | Apr 19 '24 | Buy | 9.51 | 1,602 | 15,235 | 435,347 | Apr 25 11:07 AM | | Sarachek Russell M | Director | Apr 15 '24 | Buy | 9.77 | 658 | 6,429 | 433,745 | Apr 19 03:03 PM | | Edenbrook Capital, LLC | Director | Mar 20 '24 | Buy | 9.94 | 10,000 | 99,400 | 1,602,306 | Mar 22 04:54 PM | | Sarachek Russell M | Director | Sep 22 '23 | Buy | 6.73 | 4,928 | 33,165 | 433,087 | Sep 27 01:35 PM |
|
|
|
 |
| Market Cap | 41.16M | EPS (ttm) | -0.17 |
| P/E | - | EPS this Y | - |
| Forward P/E | - | EPS next Y | - |
| PEG | - | EPS past 5Y | - |
| P/S | 0.53 | EPS next 5Y | - |
| P/B | 0.40 | EPS Q/Q | 25.71% |
| Dividend | 6.25% | Sales Q/Q | 5.43% |
| Insider Own | 19.53% | Inst Own | 36.25% |
| Insider Trans | 0.35% | Inst Trans | -2.42% |
| Short Float | 0.16% | Earnings | - |
| Analyst Recom | - | Target Price | - |
| Avg Volume | 20.69K | 52W Range | 2.25 - 3.40 |
|
|
|
|
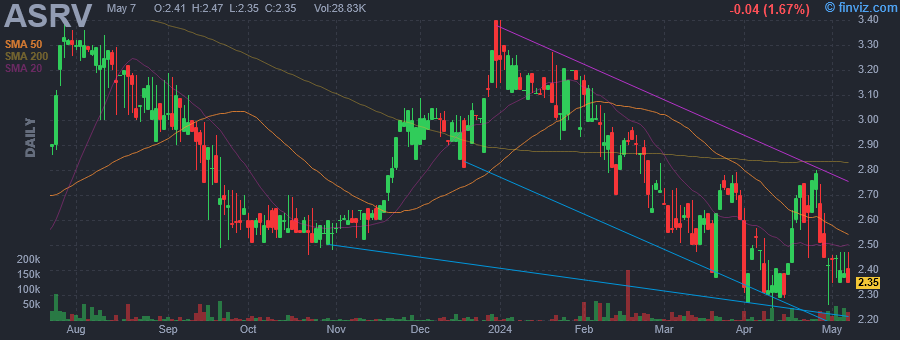
AmeriServ Financial, Inc. is a holding company, which engages in the provision of consumer, mortgage and commercial financial products and services through its subsidiary. It operates through the following segments: Community Banking, Wealth Management, and Investment or Parent. The Community Banking segment includes both retail and commercial banking activities. The Wealth Management segment is involved in the operations of a Trust Company, West Chester Capital Advisors, an investment advisory firm, and Financial Services. The Investment or Parent segment offers investment securities, borrowing activities, and general corporate expenses. The company was founded in January 1983 and is headquartered in Johnstown, PA. |
| Insider Trading |
Relationship |
Date |
Transaction |
Cost |
#Shares |
Value ($) |
#Shares Total |
SEC Form 4 |
| STOPKO JEFFREY A | President & CEO ASRV & Bank | Apr 30 '24 | Buy | 2.40 | 3,000 | 7,200 | 139,189 | May 01 10:49 AM | | STOPKO JEFFREY A | President & CEO ASRV & Bank | Mar 12 '24 | Buy | 2.53 | 2,000 | 5,060 | 136,189 | Mar 13 09:45 AM | | STOPKO JEFFREY A | President & CEO ASRV & Bank | Feb 27 '24 | Buy | 2.74 | 2,000 | 5,480 | 134,189 | Feb 28 10:34 AM | | Bloomingdale Richard W. | Director | Feb 23 '24 | Buy | 2.85 | 1,725 | 4,916 | 9,919 | Feb 26 03:13 PM | | STOPKO JEFFREY A | President & CEO ASRV & Bank | Feb 21 '24 | Buy | 2.94 | 2,000 | 5,880 | 132,189 | Feb 21 03:04 PM |
|
|
|
