 |
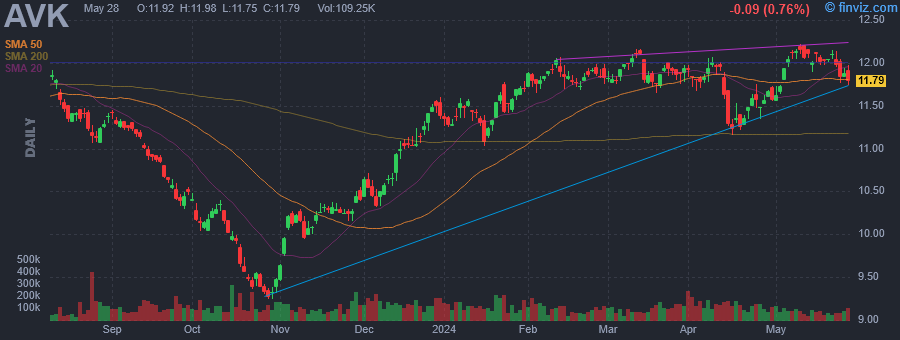
| Market Cap | 413.05M | EPS (ttm) | -0.19 |
| P/E | - | EPS this Y | - |
| Forward P/E | - | EPS next Y | - |
| PEG | - | EPS past 5Y | - |
| P/S | 12.80 | EPS next 5Y | - |
| P/B | 0.97 | EPS Q/Q | - |
| Dividend | 11.78% | Sales Q/Q | 37.90% |
| Insider Own | - | Inst Own | 26.77% |
| Insider Trans | - | Inst Trans | - |
| Short Float | 0.31% | Earnings | - |
| Analyst Recom | - | Target Price | - |
| Avg Volume | 112.31K | 52W Range | 9.24 - 12.16 |
|
|
|
|
Advent Claymore Convertible Securities and Income Fund is a closed-ended fixed income mutual fund launched and managed by Advent Capital Management, LLC. The fund primarily invests in the fixed income markets of the United States. It seeks to invest in securities of companies operating across the diversified sectors. The fund invests approximately 60% of its portfolio in convertible securities and rest in lower-grade non-convertible income securities. It employs fundamental analysis to create its portfolio. Advent Claymore Convertible Securities and Income Fund was formed on April 29, 2003 and is domiciled in the United States. |
| Insider Trading |
Relationship |
Date |
Transaction |
Cost |
#Shares |
Value ($) |
#Shares Total |
SEC Form 4 |
| Stuebe Nancy E. | TRUSTEE | May 02 '24 | Buy | 11.71 | 500 | 5,855 | 4,552 | May 02 03:24 PM | | Stuebe Nancy E. | TRUSTEE | Feb 02 '24 | Buy | 11.86 | 400 | 4,745 | 3,933 | Feb 02 01:11 PM | | MAITLAND TRACY V | CHAIRMAN, PRESIDENT & CEO | Dec 20 '23 | Sale | 11.17 | 7,163 | 80,011 | 34,087 | Dec 22 11:56 AM | | Stuebe Nancy E. | TRUSTEE | Aug 02 '23 | Buy | 11.84 | 375 | 4,440 | 2,922 | Aug 02 10:12 AM | | ADVENT CAPITAL MANAGEMENT /DE/ | INVESTMENT MANAGER | Jul 18 '23 | Sale | 11.72 | 19,048 | 223,191 | 0 | Jul 18 04:47 PM |
|
|
 |
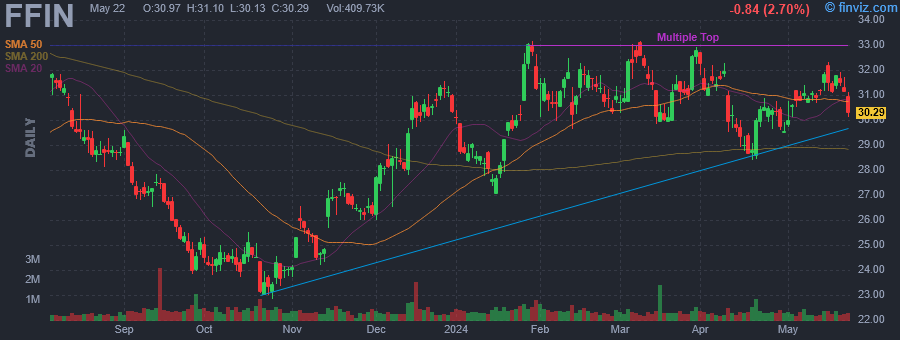 |
| Market Cap | 4.39B | EPS (ttm) | 1.40 |
| P/E | 22.02 | EPS this Y | 4.69% |
| Forward P/E | 19.85 | EPS next Y | 5.01% |
| PEG | 2.20 | EPS past 5Y | 4.67% |
| P/S | 6.61 | EPS next 5Y | 10.00% |
| P/B | 2.93 | EPS Q/Q | 1.61% |
| Dividend | 2.41% | Sales Q/Q | 20.19% |
| Insider Own | 4.11% | Inst Own | 70.10% |
| Insider Trans | 0.11% | Inst Trans | -0.56% |
| Short Float | 6.61% | Earnings | Apr 18/a |
| Analyst Recom | 3.00 | Target Price | 31.40 |
| Avg Volume | 471.73K | 52W Range | 22.84 - 33.15 |
|
|
|
|
First Financial Bankshares, Inc. is a holding company, which engages in the provision of financial and community banking services. It offers mortgage loans, savings and checking accounts, auto and equity loans, online and mobile banking, investment and trust management, and retirement plans. The company was founded in 1956 and is headquartered in Abilene, TX. |
| Insider Trading |
Relationship |
Date |
Transaction |
Cost |
#Shares |
Value ($) |
#Shares Total |
SEC Form 4 |
| Edwards Murray Hamilton | Director | May 02 '24 | Buy | 30.28 | 325 | 9,841 | 40,834 | May 02 03:00 PM | | Nickles Robert Clark Jr | Director | May 01 '24 | Buy | 30.16 | 593 | 17,885 | 93,563 | May 01 05:48 PM | | TROTTER JOHNNY | Director | Apr 30 '24 | Buy | 29.55 | 1,500 | 44,325 | 942,371 | May 01 05:46 PM | | TROTTER JOHNNY | Director | Apr 29 '24 | Buy | 29.65 | 500 | 14,825 | 940,871 | Apr 30 12:54 PM | | TROTTER JOHNNY | Director | Apr 25 '24 | Buy | 30.22 | 1,500 | 45,330 | 940,371 | Apr 29 04:05 PM |
|
|
|
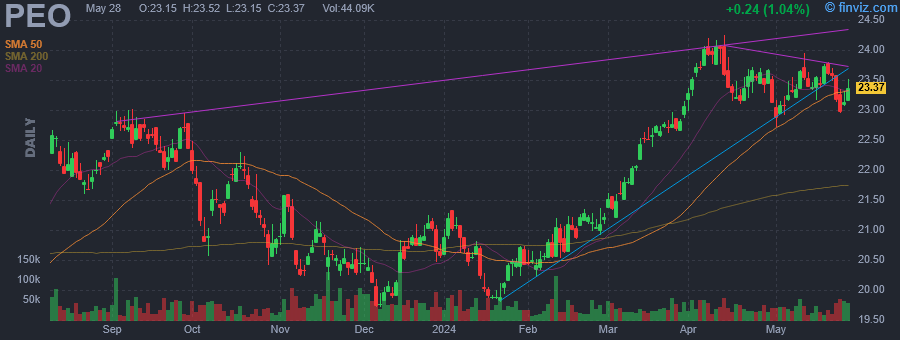 |
| Market Cap | 588.61M | EPS (ttm) | 0.40 |
| P/E | 57.67 | EPS this Y | - |
| Forward P/E | - | EPS next Y | - |
| PEG | - | EPS past 5Y | -39.60% |
| P/S | 27.75 | EPS next 5Y | - |
| P/B | 0.93 | EPS Q/Q | -73.90% |
| Dividend | 2.74% | Sales Q/Q | -12.60% |
| Insider Own | 0.49% | Inst Own | 37.97% |
| Insider Trans | 3.67% | Inst Trans | - |
| Short Float | 1.48% | Earnings | - |
| Analyst Recom | - | Target Price | - |
| Avg Volume | 33.46K | 52W Range | 18.58 - 24.25 |
|
|
|
|
Adams Natural Resources Fund, Inc. is a publicly owned investment manager. The firm invests in the public equity markets across the globe. The firm manages closed-end equity fund focused on the energy and material sectors. It invests in stocks of companies of all market capitalizations operating in the energy and natural resources sector including oil companies, exploration and production, utilities, services, and basic materials sectors. The firm employs a fundamental analysis with a bottom-up stock picking approach while focusing on earnings growth prospects, defendable market position, market competition, macroeconomic backdrop, cash flow generation, valuation, capital allocation, return on capital, mileposts and catalysts, and point in cycle identification to make its investments. It benchmarks the performance of its portfolios against a composite index of 80% Dow Jones Oil and Gas Index and 20% Dow Jones Basic Materials Index. The firm was formerly known as Petroleum & Resources Corporation. Adams Natural Resources Fund, Inc. was founded in 1929 and is based in Baltimore, Maryland with an additional office in Boston, Massachusetts. |
| Insider Trading |
Relationship |
Date |
Transaction |
Cost |
#Shares |
Value ($) |
#Shares Total |
SEC Form 4 |
| Buckley Gregory W. | E.V.P. | May 01 '24 | Buy | 23.06 | 1,070 | 24,690 | 14,053 | May 02 02:49 PM | | Buckley Gregory W. | E.V.P. | Jan 29 '24 | Buy | 20.50 | 3,350 | 68,675 | 12,936 | Jan 29 02:22 PM |
|
|
| |
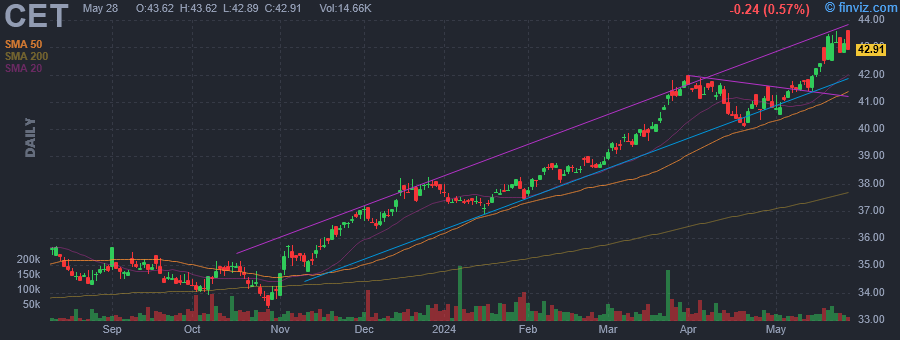 |
| Market Cap | 1.17B | EPS (ttm) | 8.01 |
| P/E | 5.13 | EPS this Y | - |
| Forward P/E | - | EPS next Y | - |
| PEG | - | EPS past 5Y | - |
| P/S | 54.99 | EPS next 5Y | - |
| P/B | 0.88 | EPS Q/Q | 72.70% |
| Dividend | 1.21% | Sales Q/Q | 95.60% |
| Insider Own | 43.55% | Inst Own | 9.39% |
| Insider Trans | 0.02% | Inst Trans | - |
| Short Float | 0.12% | Earnings | - |
| Analyst Recom | - | Target Price | - |
| Avg Volume | 32.95K | 52W Range | 32.59 - 41.99 |
|
|
|
|
Central Securities Corp. is publicly owned investment manager. The firm primarily invests in equity securities. It also invests in money market funds and U.S. treasury bills. The firm employs long term investment strategy to make its investments. Central Securities Corp. was founded in 1929 and is based in New York, New York. |
| Insider Trading |
Relationship |
Date |
Transaction |
Cost |
#Shares |
Value ($) |
#Shares Total |
SEC Form 4 |
| Hill John C | CEO & President | May 02 '24 | Buy | 40.77 | 300 | 12,231 | 68,547 | May 02 02:18 PM | | Hill John C | CEO & President | May 02 '24 | Buy | 40.82 | 200 | 8,164 | 616 | May 02 02:18 PM | | O'Neill Andrew J | Vice President | Apr 19 '24 | Buy | 40.13 | 800 | 32,104 | 83,639 | Apr 22 03:04 PM | | Hill John C | CEO and President | Apr 18 '24 | Buy | 40.43 | 200 | 8,086 | 68,247 | Apr 19 10:20 AM | | Hill John C | CEO and President | Apr 18 '24 | Buy | 40.39 | 200 | 8,078 | 416 | Apr 19 10:20 AM |
|
|
|
 |
| Market Cap | 599.50M | EPS (ttm) | 2.52 |
| P/E | 7.95 | EPS this Y | -42.32% |
| Forward P/E | 7.89 | EPS next Y | 33.45% |
| PEG | 1.09 | EPS past 5Y | -5.64% |
| P/S | 0.88 | EPS next 5Y | 7.30% |
| P/B | 0.48 | EPS Q/Q | -101.44% |
| Dividend | 8.99% | Sales Q/Q | 23.96% |
| Insider Own | 3.30% | Inst Own | 78.41% |
| Insider Trans | -1.54% | Inst Trans | -1.83% |
| Short Float | 7.03% | Earnings | Apr 24/a |
| Analyst Recom | 3.00 | Target Price | 22.67 |
| Avg Volume | 327.73K | 52W Range | 16.72 - 31.97 |
|
|
|
|
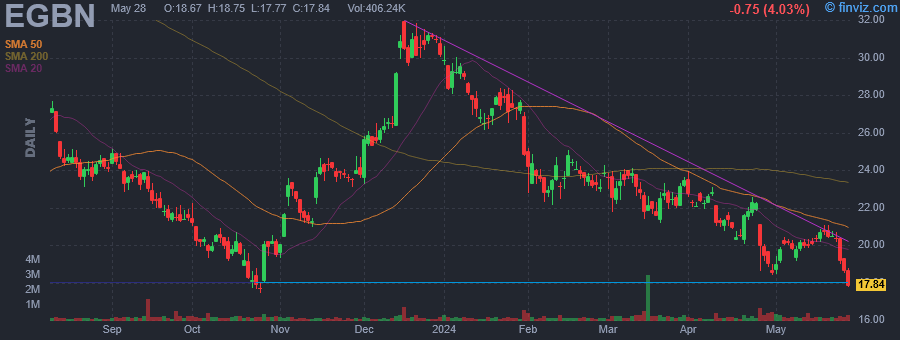
Eagle Bancorp, Inc. operates as a bank holding company, which engages in the provision of commercial banking services. It offers checking accounts, business savings accounts, online and mobile banking, insurance, and investment advisory services, borrowing, and treasury management. Its customers include sole proprietors, small and medium-sized businesses, partnerships, corporations, non-profit organizations and associations, and investors living and working in and near the bank's primary service area. The company was founded on October 28, 1997 and is headquartered in Bethesda, MD. |
| Insider Trading |
Relationship |
Date |
Transaction |
Cost |
#Shares |
Value ($) |
#Shares Total |
SEC Form 4 |
| Williams Janice L. | EVP/CCO | May 01 '24 | Buy | 19.65 | 250 | 4,912 | 108,127 | May 02 02:04 PM | | RIEL SUSAN G | President & CEO | Apr 30 '24 | Buy | 18.73 | 5,260 | 98,511 | 332,210 | May 01 03:24 PM | | Newell Eric R | EVP, Chief Financial Officer | Apr 30 '24 | Buy | 18.63 | 1,000 | 18,631 | 19,000 | May 01 03:32 PM | | Saltzman Paul | EVP/Chief Legal Officer | Apr 30 '24 | Buy | 18.58 | 1,000 | 18,583 | 20,177 | May 02 01:54 PM | | Newell Eric R | EVP, Chief Financial Officer | Apr 29 '24 | Buy | 18.97 | 572 | 10,851 | 18,000 | May 01 03:32 PM |
|
|
| |
 |
| Market Cap | 2.21B | EPS (ttm) | 2.61 |
| P/E | 27.48 | EPS this Y | 24.46% |
| Forward P/E | 13.06 | EPS next Y | 28.01% |
| PEG | 1.13 | EPS past 5Y | 7.64% |
| P/S | 1.76 | EPS next 5Y | 24.40% |
| P/B | 2.59 | EPS Q/Q | 980.96% |
| Dividend | 1.11% | Sales Q/Q | 5.68% |
| Insider Own | 0.52% | Inst Own | 116.32% |
| Insider Trans | -0.31% | Inst Trans | 2.19% |
| Short Float | 12.71% | Earnings | Apr 24/a |
| Analyst Recom | 1.88 | Target Price | 92.38 |
| Avg Volume | 560.64K | 52W Range | 61.05 - 138.47 |
|
|
|
|
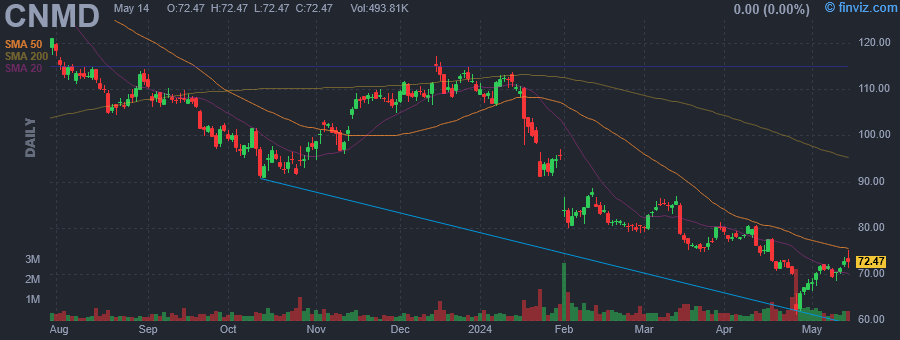
CONMED Corp. is a medical technology company, which engages in providing devices and equipment for surgical procedures. Its products include AirSeal and insufflation, allograft cartilage and tissue, arthroplasty, biliary and endoscopic ultrasound, biomedical sensors and electrodes, biopsy and polypectomy, dilators and accessories, electrosurgical units, fixation devices, hemostasis, implants and suture anchors, infection prevention, patient positioning, and related products. The company was founded by Eugene R. Corasanti in 1970 and is headquartered in Largo, FL. |
| Insider Trading |
Relationship |
Date |
Transaction |
Cost |
#Shares |
Value ($) |
#Shares Total |
SEC Form 4 |
| Beyer Pat | Chief Operating Officer | Apr 30 '24 | Buy | 68.30 | 3,000 | 204,900 | 10,807 | May 02 01:03 PM | | Cohen Heather L | EVP & Chief HR & Legal Officer | Mar 08 '24 | Option Exercise | 68.91 | 52,500 | 3,617,900 | 59,612 | Mar 11 04:42 PM | | Lalomia Brent | Vice President QA and RA | Mar 07 '24 | Option Exercise | 0.00 | 75 | 0 | 983 | Mar 11 11:44 AM | | Peters Stanley W III | President AS and AET | Dec 04 '23 | Option Exercise | 41.93 | 2,300 | 96,439 | 2,363 | Dec 06 12:12 PM | | Peters Stanley W III | President AS and AET | Dec 04 '23 | Sale | 109.93 | 2,300 | 252,833 | 63 | Dec 06 12:12 PM |
|
|
|
 |
| Market Cap | 327.29M | EPS (ttm) | 1.89 |
| P/E | 9.21 | EPS this Y | -35.48% |
| Forward P/E | 6.50 | EPS next Y | 91.14% |
| PEG | 1.15 | EPS past 5Y | 7.14% |
| P/S | 2.96 | EPS next 5Y | 8.00% |
| P/B | 0.97 | EPS Q/Q | -47.83% |
| Dividend | 2.76% | Sales Q/Q | 6.01% |
| Insider Own | 16.75% | Inst Own | 34.07% |
| Insider Trans | 0.22% | Inst Trans | -0.54% |
| Short Float | 1.02% | Earnings | Apr 18/a |
| Analyst Recom | 1.80 | Target Price | 23.00 |
| Avg Volume | 49.37K | 52W Range | 12.59 - 24.47 |
|
|
|
|
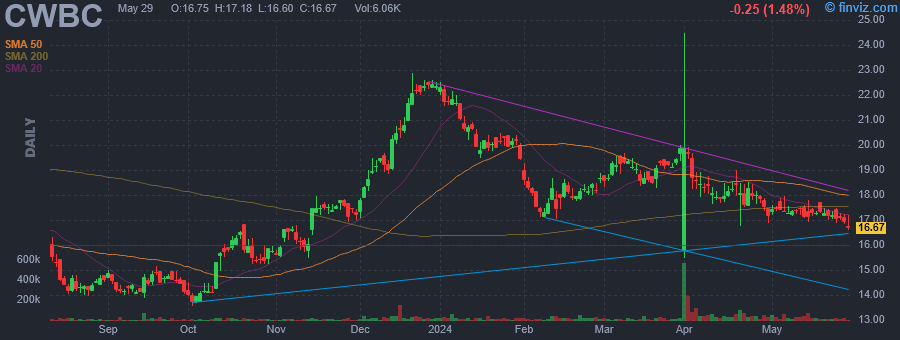
Community West Bancshares is a bank holding company, which engages in the provision of business and personal banking, and wealth management services. It operates through the following portfolios: commercial, real estate, and consumer. The commercial portfolio includes commercial and industrial loans, and agricultural production. The real estate portfolio consists of owner-occupied commercial real estate, land and construction loans, agricultural, investor commercial real estate loans, and others. The consumer portfolio covers equity loans and lines of credit, and installment and other consumer loans. The company was founded in 1979 and is headquartered in Fresno, CA. |
| Insider Trading |
Relationship |
Date |
Transaction |
Cost |
#Shares |
Value ($) |
#Shares Total |
SEC Form 4 |
| BARTLEIN ROBERT | Director | Apr 30 '24 | Buy | 17.15 | 1,000 | 17,150 | 429,056 | May 02 11:52 AM | | STOVESAND KIRK | Director | Mar 01 '24 | Buy | 14.49 | 472 | 6,839 | 86,051 | Mar 05 08:22 PM | | LOKEY JAMES W | Director | Feb 23 '24 | Option Exercise | 7.96 | 11,000 | 87,580 | 24,054 | Feb 27 12:28 PM | | ILLGEN JOHN D | Director | Feb 02 '24 | Option Exercise | 7.19 | 5,000 | 35,950 | 30,000 | Feb 06 07:36 PM | | MOHARRAM SHEREEF | Director | Jan 11 '24 | Option Exercise | 7.19 | 5,000 | 35,950 | 20,925 | Jan 12 08:54 PM |
|
|
| |
 |
| Market Cap | 8.52B | EPS (ttm) | 2.57 |
| P/E | 11.94 | EPS this Y | 4.65% |
| Forward P/E | 10.42 | EPS next Y | 6.75% |
| PEG | 1.19 | EPS past 5Y | 11.06% |
| P/S | 1.13 | EPS next 5Y | 10.00% |
| P/B | 1.30 | EPS Q/Q | 69.19% |
| Dividend | 3.27% | Sales Q/Q | 14.63% |
| Insider Own | 7.30% | Inst Own | 71.42% |
| Insider Trans | -0.01% | Inst Trans | -2.14% |
| Short Float | 1.00% | Earnings | Apr 25/b |
| Analyst Recom | 2.25 | Target Price | 34.00 |
| Avg Volume | 1.82M | 52W Range | 24.17 - 31.22 |
|
|
|
|
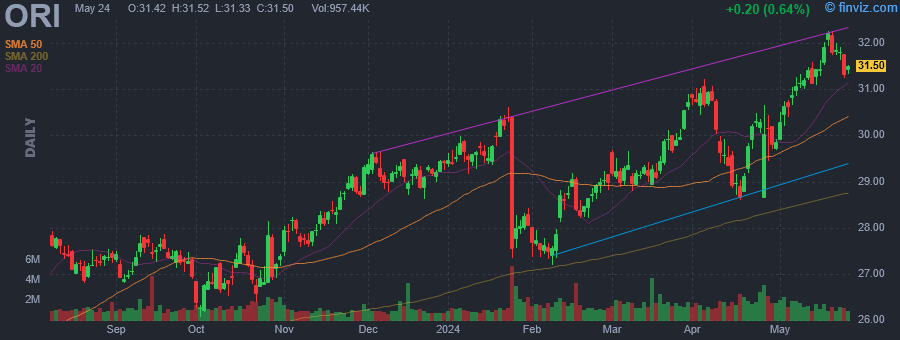
Old Republic International Corp. is a holding company, which engages in the business of insurance underwriting. It operates through the following segments: General Insurance, Title Insurance, Republic Financial Indemnity Group (RFIG) Run-Off, and Corporate and Other. The General Insurance segment provides property and liability insurance primarily to commercial clients. The Title Insurance segment is involved in the issuance of policies to real estate purchasers and investors based upon searches of the public records which contain information concerning interests in real property. The RFIG Run-Off segment focuses on mortgage guaranty and consumer credit indemnity operations. The Corporate and Other segment includes a small life and accident insurance business. The company was founded in 1923 and is headquartered in Chicago, IL. |
| Insider Trading |
Relationship |
Date |
Transaction |
Cost |
#Shares |
Value ($) |
#Shares Total |
SEC Form 4 |
| MONROE CAROLYN | SVP - Title Insurance | May 01 '24 | Option Exercise | 24.31 | 29,970 | 728,571 | 63,526 | May 03 11:18 AM | | ADACHI BARBARA | Director | May 01 '24 | Buy | 30.24 | 442 | 13,366 | 8,287 | May 02 11:06 AM | | MONROE CAROLYN | SVP - Title Insurance | May 01 '24 | Sale | 30.04 | 3,377 | 101,445 | 33,556 | May 03 11:18 AM | | Risch Therace | Director | Apr 30 '24 | Buy | 29.77 | 6,086 | 181,180 | 6,086 | May 02 11:07 AM | | Smiddy Craig R | President & CEO | Mar 06 '24 | Option Exercise | 16.06 | 14,500 | 232,870 | 166,502 | Mar 08 11:59 AM |
|
|
|
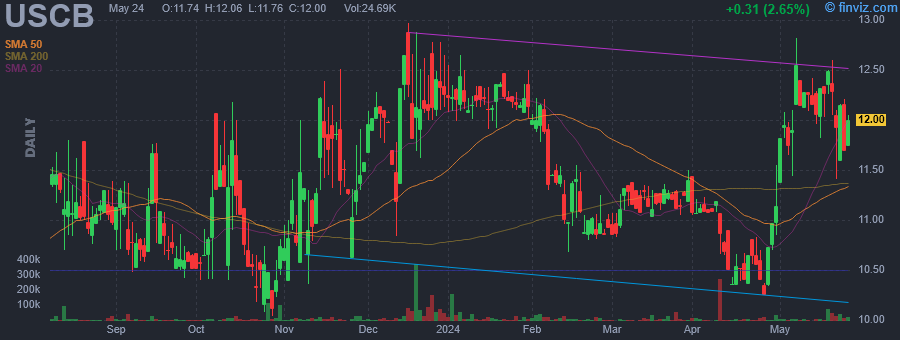 |
| Market Cap | 230.69M | EPS (ttm) | 0.78 |
| P/E | 15.02 | EPS this Y | 19.28% |
| Forward P/E | 9.68 | EPS next Y | 22.47% |
| PEG | - | EPS past 5Y | - |
| P/S | 1.97 | EPS next 5Y | - |
| P/B | 1.20 | EPS Q/Q | -19.64% |
| Dividend | 1.70% | Sales Q/Q | 36.41% |
| Insider Own | 47.38% | Inst Own | 39.26% |
| Insider Trans | 0.77% | Inst Trans | 0.91% |
| Short Float | 0.41% | Earnings | Apr 25/a |
| Analyst Recom | 2.25 | Target Price | 13.25 |
| Avg Volume | 18.57K | 52W Range | 8.56 - 12.97 |
|
|
|
|
USCB Financial Holdings, Inc. operates as a bank holding company. The company was founded on December 17, 2021 and is headquartered in Doral, FL. |
| Insider Trading |
Relationship |
Date |
Transaction |
Cost |
#Shares |
Value ($) |
#Shares Total |
SEC Form 4 |
| Anderson Robert B. | Executive VP and CFO | May 01 '24 | Buy | 11.48 | 987 | 11,331 | 68,408 | May 01 03:48 PM | | Anderson Robert B. | Executive VP and CFO | Apr 30 '24 | Buy | 11.14 | 19,289 | 214,879 | 67,421 | May 01 03:48 PM | | RODRIGUEZ RAMON A | Director | Apr 30 '24 | Buy | 11.18 | 900 | 10,062 | 4,400 | May 02 09:35 AM | | Anderson Robert B. | Executive VP and CFO | Mar 14 '24 | Buy | 11.21 | 4,000 | 44,840 | 48,132 | Mar 14 05:41 PM | | Anderson Robert B. | Executive VP and CFO | Mar 13 '24 | Buy | 11.33 | 3,400 | 38,507 | 44,132 | Mar 14 05:41 PM |
|
|
|
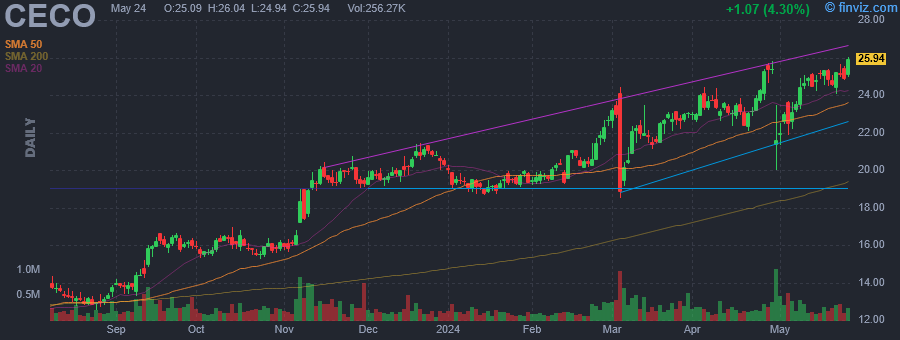 |
| Market Cap | 784.40M | EPS (ttm) | 0.35 |
| P/E | 64.01 | EPS this Y | 20.89% |
| Forward P/E | 17.70 | EPS next Y | 39.89% |
| PEG | 4.27 | EPS past 5Y | - |
| P/S | 1.40 | EPS next 5Y | 15.00% |
| P/B | 3.38 | EPS Q/Q | -25.80% |
| Dividend | - | Sales Q/Q | 12.23% |
| Insider Own | 15.18% | Inst Own | 70.00% |
| Insider Trans | 0.82% | Inst Trans | 1.53% |
| Short Float | 3.62% | Earnings | Apr 30/b |
| Analyst Recom | 1.00 | Target Price | 27.67 |
| Avg Volume | 289.63K | 52W Range | 10.68 - 25.82 |
|
|
|
May-02-24 01:59PM
|
Hedge Fund and Insider Trading News: Simon Sadler, John Paulson, Bill Ackman, Alden Global Capital, Greenlight Capital, Citadel LLC, Point72 Asset Management, CECO Environmental Corp. (CECO), Liberty SiriusXM Group (LSXMA), and More
(Insider Monkey) |
|
Apr-30-24 11:16PM
|
Q1 2024 CECO Environmental Corp Earnings Call
(Thomson Reuters StreetEvents) -14.85% |
|
11:55AM
|
CECO Stock Earnings: CECO Environmental Meets EPS, Misses Revenue for Q1 2024
(InvestorPlace) |
|
08:37AM
|
CECO Environmental Corp (CECO) Q1 2024 Earnings: Mixed Results Amidst Record Revenues
(GuruFocus.com) |
|
08:10AM
|
CECO Environmental (CECO) Q1 Earnings Meet Estimates
(Zacks) |
|
07:07AM
|
CECO: Q1 Earnings Snapshot
(Associated Press Finance) |
|
07:00AM
|
CECO Environmental Reports First Quarter 2024 Results
(GlobeNewswire) |
|
Apr-16-24 07:00AM
|
CECO Environmental to Release First Quarter Earnings and Host Conference Call on April 30
(GlobeNewswire) |
|
Apr-08-24 02:46PM
|
7 Small-Cap Stocks for the Thinking Speculator
(InvestorPlace) |
|
Mar-12-24 05:34PM
|
11 Stocks Insiders are Buying Now
(Insider Monkey) |
|
CECO Environmental Corp. engages in the provision of engineering technology and solutions. It offers services in the field of environment, energy, fluid handling, and filtration. The firm operates through the following segments: Energy Solutions, Industrial Solutions and Fluid Handling Solutions. The Energy Solutions segment improves air quality and solves fluid handling needs with market engineered, and customized solutions for the power generation, oil and gas, and petrochemical industries. The Industrial Solutions segment serves the industrial pollution control market. The Fluid Handling Solutions segment provides pump and filtration solutions that maintain safe and clean operations in some of the most harsh and toxic environments. The company was founded by Phillip DeZwirek in 1966 and is headquartered in Dallas, TX. |
| Insider Trading |
Relationship |
Date |
Transaction |
Cost |
#Shares |
Value ($) |
#Shares Total |
SEC Form 4 |
| WALLMAN RICHARD F | Director | May 01 '24 | Buy | 21.95 | 5,000 | 109,749 | 191,853 | May 02 08:12 AM | | WALLMAN RICHARD F | Director | Mar 06 '24 | Buy | 19.78 | 50,000 | 989,195 | 185,853 | Mar 08 09:28 AM | | SIEGEL LAURIE | Director | Mar 06 '24 | Buy | 19.87 | 2,500 | 49,664 | 7,906 | Mar 08 09:29 AM | | Gleason Todd R | Chief Executive Officer | Dec 21 '23 | Sale | 21.11 | 14,500 | 306,088 | 184,965 | Dec 26 09:28 AM | | WALLMAN RICHARD F | Director | Sep 18 '23 | Buy | 15.99 | 10,000 | 159,900 | 133,205 | Sep 19 07:55 AM |
|
|
|
