 |
| Market Cap | 12.92B | EPS (ttm) | 17.59 |
| P/E | 31.92 | EPS this Y | -8.60% |
| Forward P/E | 7.68 | EPS next Y | 248.01% |
| PEG | 1.59 | EPS past 5Y | 14.40% |
| P/S | 20.46 | EPS next 5Y | 20.03% |
| P/B | 12.39 | EPS Q/Q | 13.90% |
| Dividend | 0.79% | Sales Q/Q | 9.20% |
| Insider Own | 0.82% | Inst Own | 59.40% |
| Insider Trans | 1.11% | Inst Trans | 0.69% |
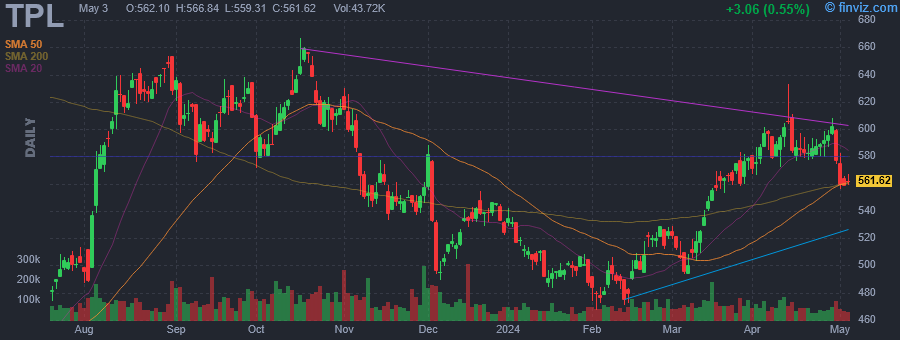
| Short Float | 3.62% | Earnings | May 08/a |
| Analyst Recom | 2.70 | Target Price | 660.71 |
| Avg Volume | 76.15K | 52W Range | 422.07 - 666.67 |
|
|
|
|
Texas Pacific Land Corporation engages in the land and resource management, and water services and operations businesses. The company owns a 1/128th nonparticipating perpetual oil and gas royalty interest (NPRI) under approximately 85,000 acres of land; a 1/16th NPRI under approximately 371,000 acres of land; and approximately 4,000 additional net royalty acres, total of approximately 195,000 NRA located in the western part of Texas. The Land and Resource Management segment manages surface acres of land, and oil and gas royalty interest in West Texas. This segment also engages in easements, such as transporting oil, gas and related hydrocarbons, power line and utility, and subsurface wellbore easements. In addition, this segment leases its land for processing, storage, and compression facilities and roads; and is involved in sale of materials, such as caliche, sand, and other material, as well as sells land. The Water Services and Operations segment provides full-service water offerings, including water sourcing, produced-water treatment, infrastructure development, and disposal solutions to operators in the Permian Basin. This segment also holds produced water royalties. Texas Pacific Land Corporation was founded in 1888 and is headquartered in Dallas, Texas. |
| Insider Trading |
Relationship |
Date |
Transaction |
Cost |
#Shares |
Value ($) |
#Shares Total |
SEC Form 4 |
| HORIZON KINETICS ASSET MANAGEM | 10% Owner | May 02 '24 | Buy | 560.50 | 3 | 1,682 | 1,084,971 | May 03 01:52 PM | | HORIZON KINETICS ASSET MANAGEM | 10% Owner | May 01 '24 | Buy | 558.69 | 3 | 1,676 | 1,084,968 | May 02 12:55 PM | | HORIZON KINETICS ASSET MANAGEM | 10% Owner | Apr 30 '24 | Buy | 576.30 | 3 | 1,729 | 1,084,965 | May 01 11:33 AM | | HORIZON KINETICS ASSET MANAGEM | 10% Owner | Apr 29 '24 | Buy | 602.40 | 3 | 1,807 | 1,084,962 | Apr 30 10:53 AM | | HORIZON KINETICS ASSET MANAGEM | 10% Owner | Apr 26 '24 | Buy | 595.67 | 3 | 1,787 | 1,084,959 | Apr 29 11:48 AM |
|
|
 |
 |
| Market Cap | 240.89M | EPS (ttm) | -0.19 |
| P/E | - | EPS this Y | - |
| Forward P/E | - | EPS next Y | - |
| PEG | - | EPS past 5Y | - |
| P/S | 13.08 | EPS next 5Y | - |
| P/B | 0.89 | EPS Q/Q | - |
| Dividend | 3.64% | Sales Q/Q | 3.60% |
| Insider Own | - | Inst Own | 31.22% |
| Insider Trans | - | Inst Trans | - |
| Short Float | 0.11% | Earnings | - |
| Analyst Recom | - | Target Price | - |
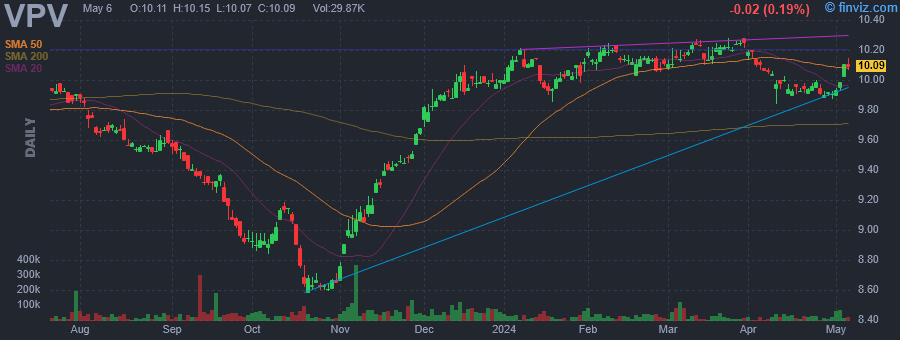
| Avg Volume | 32.07K | 52W Range | 8.58 - 10.28 |
|
|
|
|
Invesco Pennsylvania Value Municipal Income Trust is a closed-ended fixed income mutual fund launched by Invesco Ltd. The fund is co-managed by Invesco Advisers, Inc., INVESCO Asset Management (Japan) Limited, INVESCO Asset Management Deutschland GmbH, INVESCO Asset Management Limited, Invesco Canada Ltd., Invesco Hong Kong Limited, and INVESCO Senior Secured Management, Inc. It invests in the fixed income markets of the United States. The fund primarily invests in investment grade Pennsylvania municipal securities which include municipal bonds, municipal notes, municipal commercial paper, and lease obligations. It employs fundamental analysis with bottom-up security selection approach to create its portfolio. The fund was formerly known as Invesco Van Kampen Pennsylvania Value Municipal Income Trust. Invesco Pennsylvania Value Municipal Income Trust was formed on April 30, 1993 and is domiciled in the United States. |
| Insider Trading |
Relationship |
Date |
Transaction |
Cost |
#Shares |
Value ($) |
#Shares Total |
SEC Form 4 |
| Saba Capital Management, L.P. | 10% Owner | May 02 '24 | Buy | 9.96 | 30,935 | 308,113 | 2,873,641 | May 03 01:24 PM | | Saba Capital Management, L.P. | 10% Owner | Apr 15 '24 | Buy | 9.94 | 2,973 | 29,552 | 2,842,701 | Apr 15 05:15 PM | | Saba Capital Management, L.P. | 10% Owner | Apr 12 '24 | Buy | 10.01 | 13,333 | 133,463 | 2,839,728 | Apr 15 05:15 PM | | Saba Capital Management, L.P. | 10% Owner | Mar 19 '24 | Buy | 10.21 | 11,342 | 115,802 | 2,826,395 | Mar 20 12:14 PM | | Saba Capital Management, L.P. | 10% Owner | Mar 12 '24 | Buy | 10.23 | 6,989 | 71,497 | 2,815,053 | Mar 12 06:07 PM |
|
|
|
 |
| Market Cap | 493.11M | EPS (ttm) | 0.21 |
| P/E | 56.90 | EPS this Y | - |
| Forward P/E | - | EPS next Y | - |
| PEG | - | EPS past 5Y | - |
| P/S | 13.65 | EPS next 5Y | - |
| P/B | 0.89 | EPS Q/Q | - |
| Dividend | 3.46% | Sales Q/Q | -3.10% |
| Insider Own | - | Inst Own | 31.13% |
| Insider Trans | - | Inst Trans | - |
| Short Float | 0.19% | Earnings | - |
| Analyst Recom | - | Target Price | - |
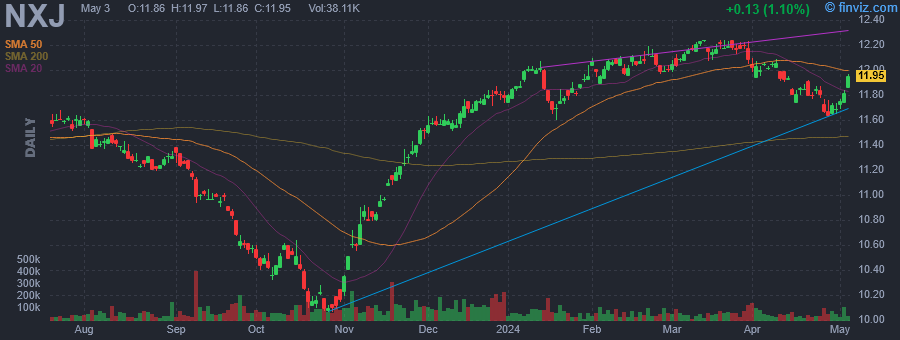
| Avg Volume | 64.49K | 52W Range | 10.06 - 12.24 |
|
|
|
|
Nuveen New Jersey Quality Municipal Income Fund is a closed ended fixed income mutual fund launched by Nuveen Investments, Inc. The fund is co-managed by Nuveen Fund Advisors LLC and Nuveen Asset Management, LLC. It invests in the fixed income markets of New Jersey. The fund invests in undervalued municipal securities and other related investments that are, exempt from regular federal and New Jersey income taxes that are rated Baa or BBB or better. It employs fundamental analysis with bottom-up stock picking approach to create its portfolio. The fund benchmarks the performance of its portfolio against the Standard & Poor's (S&P) New Jersey Municipal Bond Index. The fund was formerly known as Nuveen New Jersey Dividend Advantage Municipal Fund. Nuveen New Jersey Quality Municipal Income Fund was formed on June 1, 1999 and is domiciled in the United States. |
| Insider Trading |
Relationship |
Date |
Transaction |
Cost |
#Shares |
Value ($) |
#Shares Total |
SEC Form 4 |
| Saba Capital Management, L.P. | 10% Owner | May 02 '24 | Buy | 11.79 | 50,596 | 596,527 | 5,972,471 | May 03 01:16 PM | | Saba Capital Management, L.P. | 10% Owner | Apr 29 '24 | Buy | 11.66 | 5,494 | 64,060 | 5,921,875 | May 01 10:30 AM | | Saba Capital Management, L.P. | 10% Owner | Apr 02 '24 | Buy | 11.99 | 27,925 | 334,821 | 5,916,381 | Apr 03 02:01 PM | | Saba Capital Management, L.P. | 10% Owner | Apr 01 '24 | Buy | 12.03 | 54,332 | 653,614 | 5,888,456 | Apr 03 02:01 PM | | Saba Capital Management, L.P. | 10% Owner | Mar 26 '24 | Buy | 12.18 | 6,788 | 82,678 | 5,834,124 | Mar 27 09:27 AM |
|
|
| |
 |
| Market Cap | 434.94M | EPS (ttm) | -0.24 |
| P/E | - | EPS this Y | - |
| Forward P/E | - | EPS next Y | - |
| PEG | - | EPS past 5Y | - |
| P/S | 13.77 | EPS next 5Y | - |
| P/B | 0.91 | EPS Q/Q | - |
| Dividend | 3.38% | Sales Q/Q | 5.80% |
| Insider Own | - | Inst Own | 33.09% |
| Insider Trans | - | Inst Trans | - |
| Short Float | 0.13% | Earnings | - |
| Analyst Recom | - | Target Price | - |
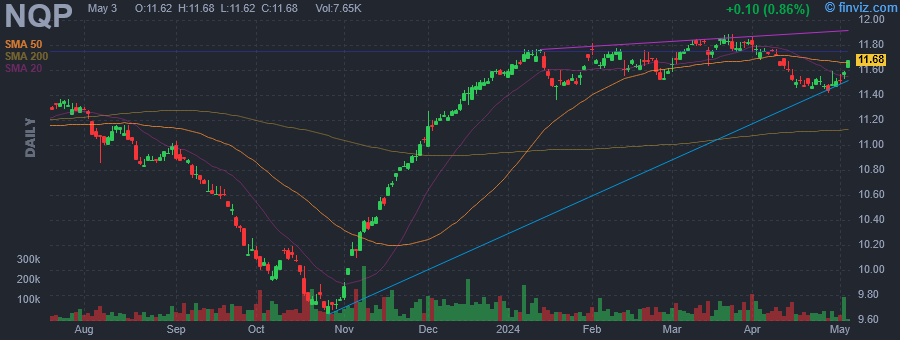
| Avg Volume | 55.64K | 52W Range | 9.65 - 11.89 |
|
|
|
|
Nuveen Pennsylvania Quality Municipal Income Fund is a closed ended fixed income mutual fund launched by Nuveen Investments, Inc. The fund is co-managed by Nuveen Fund Advisors LLC and Nuveen Asset Management, LLC. It invests in the fixed income markets of Pennsylvania. The fund invests in tax exempt municipal bonds, with a rating of Baa/BBB or higher. It employs fundamental analysis, with bottom-up stock picking approach, to create its portfolio. The fund benchmarks the performance of its portfolio against the Standard & Poor's Pennsylvania Municipal Bond Index and Standard & Poor's National Municipal Bond Index. The fund was formerly known a Nuveen Pennsylvania Investment Quality Municipal Fund. Nuveen Pennsylvania Quality Municipal Income Fund was formed on December 20, 1990 and is domiciled in the United States. |
| Insider Trading |
Relationship |
Date |
Transaction |
Cost |
#Shares |
Value ($) |
#Shares Total |
SEC Form 4 |
| Saba Capital Management, L.P. | 10% Owner | May 02 '24 | Buy | 11.55 | 65,807 | 760,071 | 5,161,297 | May 03 01:14 PM | | Saba Capital Management, L.P. | 10% Owner | Apr 29 '24 | Buy | 11.49 | 7,796 | 89,576 | 5,095,490 | May 01 10:28 AM | | Saba Capital Management, L.P. | 10% Owner | Apr 25 '24 | Buy | 11.46 | 31,908 | 365,666 | 5,087,694 | Apr 26 11:51 AM | | Saba Capital Management, L.P. | 10% Owner | Apr 02 '24 | Buy | 11.76 | 49,402 | 580,968 | 5,055,786 | Apr 03 01:55 PM | | Saba Capital Management, L.P. | 10% Owner | Apr 01 '24 | Buy | 11.77 | 35,421 | 416,905 | 5,006,384 | Apr 03 01:55 PM |
|
|
|
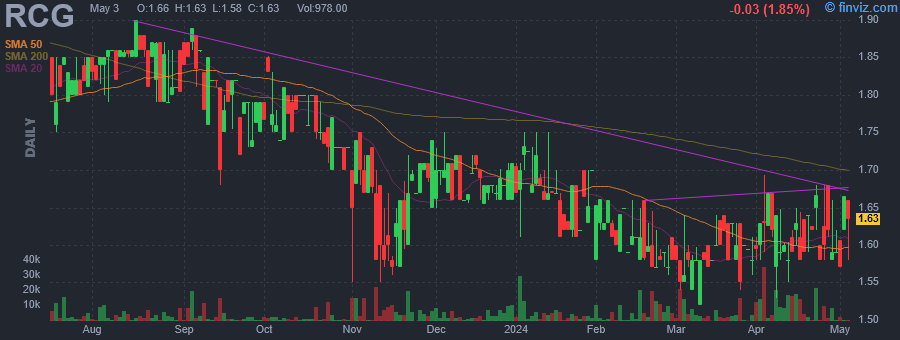 |
| Market Cap | 11.47M | EPS (ttm) | -0.12 |
| P/E | - | EPS this Y | - |
| Forward P/E | - | EPS next Y | - |
| PEG | - | EPS past 5Y | - |
| P/S | 40.13 | EPS next 5Y | - |
| P/B | 0.83 | EPS Q/Q | - |
| Dividend | 0.93% | Sales Q/Q | 26.30% |
| Insider Own | 14.93% | Inst Own | 16.58% |
| Insider Trans | 1.32% | Inst Trans | - |
| Short Float | 0.01% | Earnings | - |
| Analyst Recom | - | Target Price | - |
| Avg Volume | 7.53K | 52W Range | 1.52 - 1.90 |
|
|
|
|
RENN Fund, Inc. is a closed ended equity mutual fund launched by RENN Capital Group, Inc. The fund is co-managed by Horizon Kinetics Asset Management LLC. It invests in the public equity markets of the United States. The fund seeks to invest in stocks of companies operating across diversified sectors. It seeks to invest in stocks of small-cap and mid-cap companies. The fund employs a fundamental analysis with a bottom-up stock picking approach to create its portfolio. It was formerly known as RENN Global Entrepreneurs Fund, Inc. RENN Fund, Inc. was formed on January 20, 1994 and is domiciled in the United States. |
| Insider Trading |
Relationship |
Date |
Transaction |
Cost |
#Shares |
Value ($) |
#Shares Total |
SEC Form 4 |
| STAHL MURRAY | President and CEO | May 02 '24 | Buy | 1.67 | 55 | 92 | 247,642 | May 03 01:13 PM | | STAHL MURRAY | President and CEO | May 02 '24 | Buy | 1.67 | 4 | 7 | 5,037 | May 03 01:13 PM | | STAHL MURRAY | President and CEO | May 01 '24 | Buy | 1.69 | 55 | 93 | 247,618 | May 02 01:17 PM | | STAHL MURRAY | President and CEO | May 01 '24 | Buy | 1.69 | 4 | 7 | 5,033 | May 02 01:17 PM | | STAHL MURRAY | President and CEO | Apr 30 '24 | Buy | 1.65 | 55 | 91 | 247,594 | May 01 11:48 AM |
|
|
| |
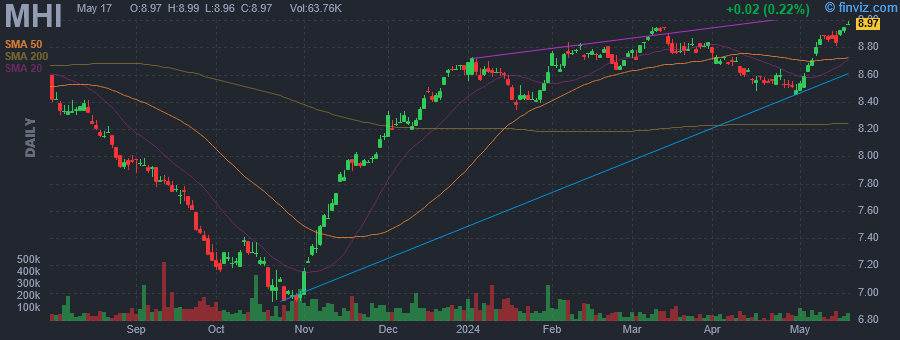 |
| Market Cap | 197.43M | EPS (ttm) | 0.04 |
| P/E | 216.75 | EPS this Y | - |
| Forward P/E | - | EPS next Y | - |
| PEG | - | EPS past 5Y | - |
| P/S | 11.75 | EPS next 5Y | - |
| P/B | 1.03 | EPS Q/Q | - |
| Dividend | 4.04% | Sales Q/Q | 3.50% |
| Insider Own | - | Inst Own | 52.45% |
| Insider Trans | - | Inst Trans | - |
| Short Float | 0.25% | Earnings | - |
| Analyst Recom | - | Target Price | - |
| Avg Volume | 62.75K | 52W Range | 6.93 - 8.95 |
|
|
|
|
Pioneer Municipal High Income Fund, Inc. is a closed-ended fixed income mutual fund launched and managed by Pioneer Investment Management, Inc. It invests in the fixed income markets of the United States. The fund primarily invests in municipal securities. It seeks to invest in securities across the credit rating and maturity spectrum. The fund benchmarks the performance of its portfolio against the Barclays Municipal Bond Index and Barclays High Yield Municipal Bond Index. Pioneer Municipal High Income Fund, Inc. was formed on March 13, 2003 and is domiciled in the United States. |
| Insider Trading |
Relationship |
Date |
Transaction |
Cost |
#Shares |
Value ($) |
#Shares Total |
SEC Form 4 |
| Saba Capital Management, L.P. | 10% Owner | May 02 '24 | Buy | 8.56 | 32,971 | 282,232 | 3,433,815 | May 03 01:12 PM | | Saba Capital Management, L.P. | 10% Owner | Mar 11 '24 | Buy | 8.93 | 30,534 | 272,669 | 3,400,844 | Mar 12 05:54 PM | | Saba Capital Management, L.P. | 10% Owner | Mar 01 '24 | Buy | 8.76 | 5,666 | 49,634 | 3,370,310 | Mar 04 06:09 PM | | Saba Capital Management, L.P. | 10% Owner | Feb 05 '24 | Buy | 8.65 | 80,107 | 692,926 | 3,364,637 | Feb 05 05:54 PM | | Saba Capital Management, L.P. | 10% Owner | Jan 30 '24 | Buy | 8.49 | 17,517 | 148,719 | 3,284,530 | Jan 31 11:53 AM |
|
|
|
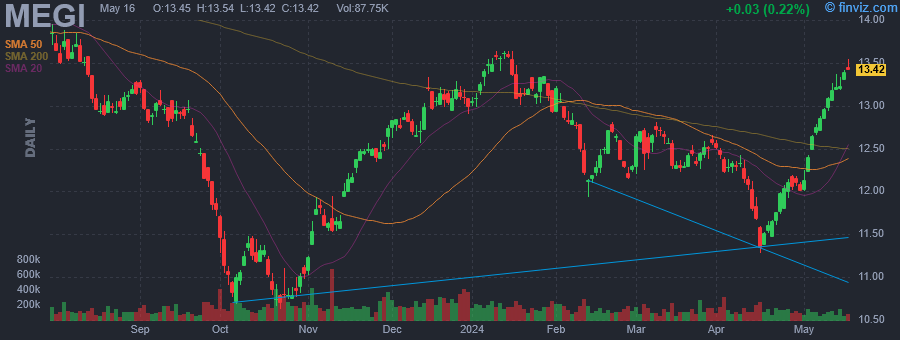 |
| Market Cap | 658.40M | EPS (ttm) | -3.26 |
| P/E | - | EPS this Y | - |
| Forward P/E | - | EPS next Y | - |
| PEG | - | EPS past 5Y | - |
| P/S | - | EPS next 5Y | - |
| P/B | - | EPS Q/Q | - |
| Dividend | 11.46% | Sales Q/Q | - |
| Insider Own | 7.50% | Inst Own | 58.77% |
| Insider Trans | 8.61% | Inst Trans | - |
| Short Float | 0.15% | Earnings | - |
| Analyst Recom | - | Target Price | - |
| Avg Volume | 147.76K | 52W Range | 10.63 - 14.53 |
|
|
|
|
The investment objective of MainStay CBRE Global Infrastructure Megatrends Fund (MEGI) is to seek a high level of total return with an emphasis on current income. |
| Insider Trading |
Relationship |
Date |
Transaction |
Cost |
#Shares |
Value ($) |
#Shares Total |
SEC Form 4 |
| Saba Capital Management, L.P. | 10% Owner | May 02 '24 | Buy | 12.33 | 12,874 | 158,736 | 5,616,886 | May 03 01:10 PM | | Saba Capital Management, L.P. | 10% Owner | Apr 25 '24 | Buy | 12.03 | 45,097 | 542,517 | 5,603,993 | Apr 26 11:47 AM | | Saba Capital Management, L.P. | 10% Owner | Apr 24 '24 | Buy | 11.95 | 26,481 | 316,448 | 5,558,896 | Apr 26 11:47 AM | | Saba Capital Management, L.P. | 10% Owner | Apr 23 '24 | Buy | 11.88 | 25,362 | 301,301 | 5,532,415 | Apr 23 08:02 PM | | Saba Capital Management, L.P. | 10% Owner | Mar 19 '24 | Buy | 12.30 | 22,144 | 272,371 | 5,507,053 | Mar 20 11:53 AM |
|
|
| |
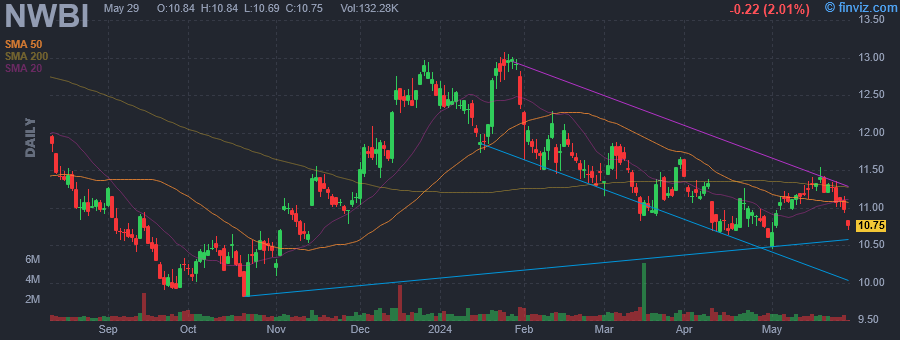 |
| Market Cap | 1.41B | EPS (ttm) | 1.02 |
| P/E | 10.82 | EPS this Y | -17.12% |
| Forward P/E | 11.26 | EPS next Y | 7.86% |
| PEG | 1.55 | EPS past 5Y | 0.80% |
| P/S | 1.92 | EPS next 5Y | 7.00% |
| P/B | 0.91 | EPS Q/Q | -13.60% |
| Dividend | 7.23% | Sales Q/Q | 18.26% |
| Insider Own | 5.17% | Inst Own | 67.68% |
| Insider Trans | 0.22% | Inst Trans | 0.32% |
| Short Float | 3.30% | Earnings | Apr 22/b |
| Analyst Recom | 3.33 | Target Price | 11.40 |
| Avg Volume | 804.28K | 52W Range | 9.80 - 13.07 |
|
|
|
|
Northwest Bancshares, Inc. is a holding company, which engages in the provision of a complete line of business and personal banking products, as well as treasury management solutions, and wealth management services. The company was founded in 1896 and is headquartered in Columbus, OH. |
| Insider Trading |
Relationship |
Date |
Transaction |
Cost |
#Shares |
Value ($) |
#Shares Total |
SEC Form 4 |
| Torchio Louis J | President & CEO | May 02 '24 | Buy | 10.87 | 2,295 | 24,945 | 89,620 | May 03 01:04 PM | | Barnum Carey A. | SVP, Chief Auditor | Apr 25 '24 | Sale | 10.85 | 519 | 5,629 | 4,004 | Apr 26 10:55 AM | | Watson Scott J | EVP, Chief Information Officer | Jan 24 '24 | Buy | 12.90 | 5,000 | 64,512 | 35,282 | Jan 24 03:47 PM | | Fannin Timothy B | Director | Dec 13 '23 | Sale | 12.14 | 6,110 | 74,175 | 22,608 | Dec 15 10:22 AM | | Cygnar Devin T | EVP, Chief Mktg/Comm. Officer | Nov 07 '23 | Buy | 10.96 | 13,692 | 150,000 | 13,692 | Nov 08 09:30 AM |
|
|
|
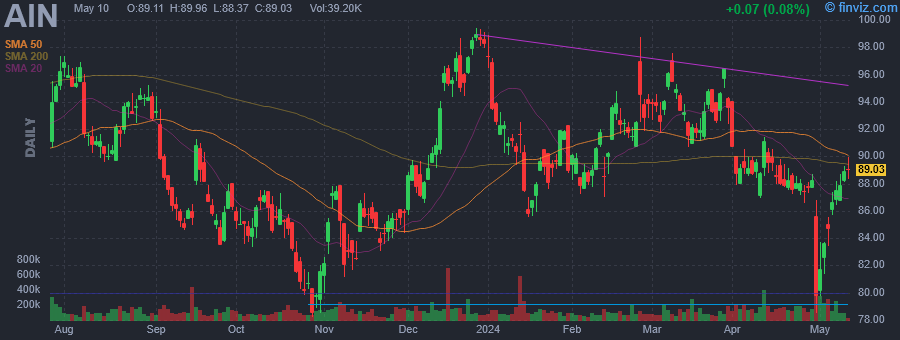 |
| Market Cap | 2.64B | EPS (ttm) | 3.56 |
| P/E | 23.76 | EPS this Y | -4.97% |
| Forward P/E | 18.41 | EPS next Y | 19.17% |
| PEG | 2.40 | EPS past 5Y | 6.72% |
| P/S | 2.22 | EPS next 5Y | 9.90% |
| P/B | 2.73 | EPS Q/Q | 1.25% |
| Dividend | 1.14% | Sales Q/Q | 16.44% |
| Insider Own | 1.02% | Inst Own | 102.29% |
| Insider Trans | 0.32% | Inst Trans | -0.61% |
| Short Float | 0.72% | Earnings | Apr 29/a |
| Analyst Recom | 2.33 | Target Price | 100.00 |
| Avg Volume | 149.37K | 52W Range | 78.20 - 99.41 |
|
|
|
|
Albany International Corp. engages in textiles and materials processing. It operates through the following segments: Machine Clothing and Albany Engineered Composites. The Machine Clothing segment supplies fabrics used in the manufacturing process in the pulp, corrugator, nonwovens, fiber cement, building products, and tannery and textile industries. The Engineered Composites segment provides composite structures to customers in the commercial and defense aerospace industries. The firm offers regular fabric, consultative, diagnostic, and project specific services. The company was founded on March 8, 1895 and is headquartered in Rochester, NH. |
| Insider Trading |
Relationship |
Date |
Transaction |
Cost |
#Shares |
Value ($) |
#Shares Total |
SEC Form 4 |
| Starr Robert D. | CFO & TREASURER | May 03 '24 | Buy | 84.44 | 1,000 | 84,440 | 2,610 | May 03 12:59 PM | | Kleveland Gunnar | President and CEO | Mar 01 '24 | Option Exercise | 0.00 | 9,286 | 0 | 9,286 | Mar 04 03:41 PM | | Gaug Joseph M | VP-General Counsel & Secretary | Mar 01 '24 | Option Exercise | 0.00 | 2,274 | 0 | 7,955 | Mar 04 03:46 PM | | McCarvill Alice | Exec VP Human Resources | Mar 01 '24 | Option Exercise | 0.00 | 1,346 | 0 | 8,719 | Mar 04 03:47 PM | | Harwell Gregory N | President- AEC | Mar 01 '24 | Option Exercise | 0.00 | 2,417 | 0 | 31,036 | Mar 04 03:57 PM |
|
|
|
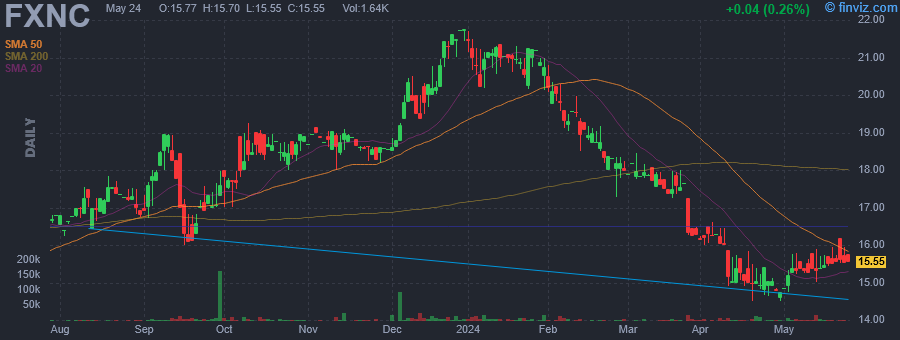 |
| Market Cap | 96.71M | EPS (ttm) | 1.43 |
| P/E | 10.76 | EPS this Y | 16.99% |
| Forward P/E | 7.06 | EPS next Y | 21.79% |
| PEG | - | EPS past 5Y | -5.60% |
| P/S | 1.31 | EPS next 5Y | - |
| P/B | 0.82 | EPS Q/Q | -16.64% |
| Dividend | 3.90% | Sales Q/Q | 25.01% |
| Insider Own | 17.84% | Inst Own | 35.16% |
| Insider Trans | 0.62% | Inst Trans | 0.28% |
| Short Float | 0.16% | Earnings | Apr 30/b |
| Analyst Recom | 3.00 | Target Price | 18.50 |
| Avg Volume | 4.16K | 52W Range | 13.55 - 21.75 |
|
|
|
|
First National Corp. operates as a bank holding company, which engages in the provision of consumer and business banking services through its subsidiary. It offers savings, checking, mortgage lending, home equity, treasury management, construction loan, commercial mortgage, and rental properties. The company was founded on September 7, 1983 and is headquartered in Strasburg, VA. |
| Insider Trading |
Relationship |
Date |
Transaction |
Cost |
#Shares |
Value ($) |
#Shares Total |
SEC Form 4 |
| WILKINS III JAMES R | Director | May 02 '24 | Buy | 15.01 | 4,257 | 63,905 | 283,034 | May 02 04:46 PM | | AIKENS JASON C | Director | May 02 '24 | Buy | 15.23 | 1,000 | 15,229 | 6,899 | May 03 12:21 PM | | HARVARD SCOTT C | President & CEO | May 02 '24 | Buy | 14.90 | 1,000 | 14,900 | 69,729 | May 02 04:45 PM | | Holt George Edwin III | Director | May 02 '24 | Buy | 14.75 | 597 | 8,806 | 38,665 | May 03 12:24 PM | | Smith Gerald F JR | Director | Sep 29 '23 | Buy | 17.30 | 686 | 11,868 | 18,558 | Oct 02 04:51 PM |
|
|
|
