 |
| Market Cap | 1.45M | EPS (ttm) | -77.72 |
| P/E | - | EPS this Y | 69.16% |
| Forward P/E | - | EPS next Y | 49.47% |
| PEG | - | EPS past 5Y | 32.73% |
| P/S | 0.10 | EPS next 5Y | - |
| P/B | - | EPS Q/Q | 91.17% |
| Dividend | - | Sales Q/Q | 32.77% |
| Insider Own | 12.96% | Inst Own | 2.80% |
| Insider Trans | -42.85% | Inst Trans | - |
| Short Float | 18.80% | Earnings | Apr 01/b |
| Analyst Recom | 1.00 | Target Price | 40.00 |
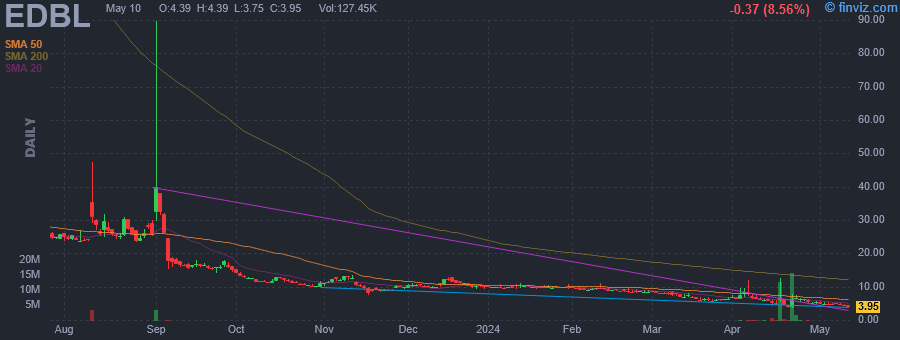
| Avg Volume | 582.94K | 52W Range | 3.62 - 89.60 |
|
|
|
|
Edible Garden AG, Inc. is a controlled environment agriculture (CEA) farming company, which engages in the usage of traditional agricultural growing techniques together with technology to grow organic food. Its products include lettuces, potted herbs, and cut herbs. The company was founded by James E. Kras and Michael C. James on March 28, 2020 and is headquartered in Belvidere, NJ. |
| Insider Trading |
Relationship |
Date |
Transaction |
Cost |
#Shares |
Value ($) |
#Shares Total |
SEC Form 4 |
| UBS Group AG | 10% Owner | Apr 25 '24 | Buy | 6.07 | 1,005 | 6,105 | 35,077 | May 03 12:04 PM | | UBS Group AG | 10% Owner | Apr 25 '24 | Sale | 5.43 | 30,056 | 163,307 | 5,025 | May 03 12:04 PM | | UBS Group AG | 10% Owner | Apr 24 '24 | Sale | 6.30 | 106 | 668 | 34,076 | May 03 12:04 PM | | DonAroma Pamela | Director | Jun 02 '23 | Buy | 1.51 | 1,000 | 1,510 | 1,000 | Jun 06 04:30 PM | | Kras James E. | President and CEO | May 18 '23 | Buy | 1.68 | 1,000 | 1,678 | 47,265 | May 19 05:10 PM |
|
|
 |
 |
| Market Cap | 87.18B | EPS (ttm) | 8.63 |
| P/E | 3.15 | EPS this Y | 203.32% |
| Forward P/E | 12.95 | EPS next Y | 100.06% |
| PEG | 0.31 | EPS past 5Y | 48.81% |
| P/S | 1.22 | EPS next 5Y | 10.12% |
| P/B | 1.01 | EPS Q/Q | -185.00% |
| Dividend | 2.94% | Sales Q/Q | 121.68% |
| Insider Own | 12.14% | Inst Own | 49.99% |
| Insider Trans | 0.00% | Inst Trans | - |
| Short Float | 0.43% | Earnings | May 07/b |
| Analyst Recom | 2.37 | Target Price | 30.81 |
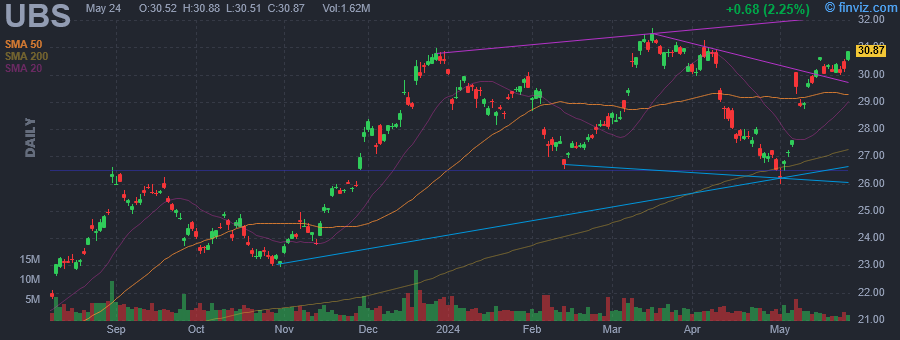
| Avg Volume | 2.94M | 52W Range | 18.47 - 31.71 |
|
|
|
|
UBS Group AG is a holding company, which engages in the provision of financial management solutions. It operates through the following segments: Global Wealth Management, Personal and Corporate Banking, Asset Management, Investment Bank, Non-Core and Legacy, and Group Items. The Global Wealth Management segment involves the provision of advice and solutions and offers investment management, estate planning and corporate finance, banking products and services. The Personal and Corporate segment focuses on offering retirement, financing, investments and strategic transactions through its branch network and digital channels. The Asset Management segment consists of capabilities and styles, and advisory support. The Investment Bank segment includes research, advisory services, facilitating clients raising debt and equity from the public, private, and capital markets, cash and derivatives trading. The Non-Core and Legacy segment refers to assets and liabilities prior to the acquisition. The Group Items segment consists of Technology, Corporate Services, Human Resources, Finance, Legal, Risk Control, Compliance, Regulatory and Governance, Communications and Branding, Group Sustainability and Impact, Chief Strategy Office, and Group Treasury. The company was founded on June 29, 1998 and is headquartered in Zurich, Switzerland. |
| Insider Trading |
Relationship |
Date |
Transaction |
Cost |
#Shares |
Value ($) |
#Shares Total |
SEC Form 4 |
| UBS Group AG | 10% Owner | Apr 25 '24 | Buy | 6.07 | 1,005 | 6,105 | 35,077 | May 03 12:04 PM | | UBS Group AG | 10% Owner | Apr 25 '24 | Sale | 5.43 | 30,056 | 163,307 | 5,025 | May 03 12:04 PM | | UBS Group AG | 10% Owner | Apr 24 '24 | Sale | 6.30 | 106 | 668 | 34,076 | May 03 12:04 PM |
|
|
|
 |
| Market Cap | 126.52M | EPS (ttm) | 3.13 |
| P/E | 9.22 | EPS this Y | - |
| Forward P/E | - | EPS next Y | - |
| PEG | - | EPS past 5Y | 17.42% |
| P/S | 1.27 | EPS next 5Y | - |
| P/B | 0.94 | EPS Q/Q | 3.31% |
| Dividend | 5.55% | Sales Q/Q | 41.16% |
| Insider Own | 6.16% | Inst Own | 24.39% |
| Insider Trans | 0.58% | Inst Trans | - |
| Short Float | 0.19% | Earnings | Jan 30/a |
| Analyst Recom | - | Target Price | - |
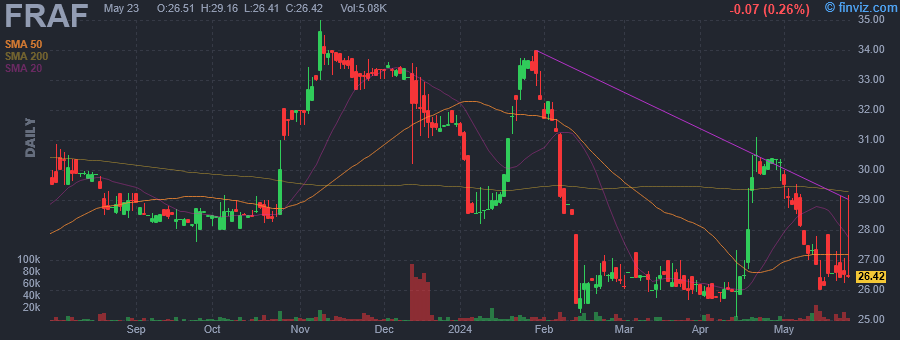
| Avg Volume | 4.41K | 52W Range | 23.96 - 35.00 |
|
|
|
|
Franklin Financial Services Corp. is a bank holding company, which engages in financial services and offers traditional banking. It offers commercial and retail financial services, including the taking of time, savings and demand deposits, the making of commercial, consumer and mortgage loans, and the providing of safe deposit services. The company was founded on June 1, 1983 and is headquartered in Chambersburg, PA. |
| Insider Trading |
Relationship |
Date |
Transaction |
Cost |
#Shares |
Value ($) |
#Shares Total |
SEC Form 4 |
| JENNINGS ALLAN E JR | Director | May 01 '24 | Buy | 30.14 | 1,000 | 30,140 | 26,307 | May 03 10:27 AM | | Rzomp Kimberly | Director | May 01 '24 | Buy | 30.14 | 500 | 15,070 | 7,008 | May 03 10:31 AM | | Carroll Charles Benner Jr | COO | Apr 29 '24 | Buy | 30.36 | 50 | 1,518 | 2,550 | Apr 30 09:32 AM | | Hollar Mark R | CFO | Dec 19 '23 | Option Exercise | 26.35 | 150 | 3,952 | 9,985 | Dec 20 02:45 PM | | Carmack Karen K | SVP | Sep 20 '23 | Buy | 28.48 | 1 | 28 | 2,528 | Sep 21 11:22 AM |
|
|
| |
 |
| Market Cap | 217.22M | EPS (ttm) | 1.30 |
| P/E | 16.39 | EPS this Y | 1.75% |
| Forward P/E | 16.83 | EPS next Y | 9.48% |
| PEG | - | EPS past 5Y | 3.72% |
| P/S | 2.61 | EPS next 5Y | - |
| P/B | 1.97 | EPS Q/Q | -0.95% |
| Dividend | 3.72% | Sales Q/Q | -14.12% |
| Insider Own | 20.08% | Inst Own | 35.70% |
| Insider Trans | 0.18% | Inst Trans | -15.07% |
| Short Float | 1.05% | Earnings | May 06/b |
| Analyst Recom | 1.00 | Target Price | 27.00 |
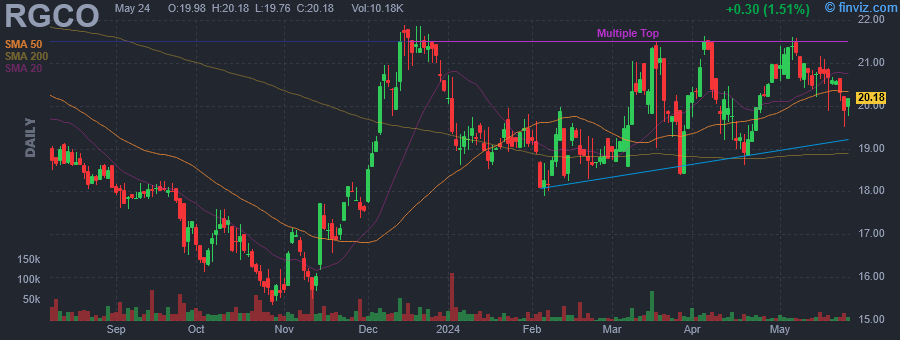
| Avg Volume | 14.96K | 52W Range | 15.36 - 22.53 |
|
|
|
|
RGC Resources, Inc. is a holding company, which engages in the distribution and sale of natural gas to residential, commercial, and industrial users in its service territory. The firm operates through the following segments: Gas Utility, Investment in Affiliates, and Parent and Other. The Gas Utility segment focuses on tariff rates and other regulatory mechanisms through which it provides for the sale and distribution of natural gas to customers. The Investment in Affiliates includes investment activities in MVP and Southgate projects. The Parent and Other segment consists of unregulated activities and corporate eliminations. The company was founded on July 31, 1998 and is headquartered in Roanoke, VA. |
| Insider Trading |
Relationship |
Date |
Transaction |
Cost |
#Shares |
Value ($) |
#Shares Total |
SEC Form 4 |
| Oliver Lawrence T. | VP and Secretary | May 01 '24 | Buy | 20.94 | 10 | 200 | 17,619 | May 03 09:53 AM | | Miles Christen Brooke | VP, Human Resources | May 01 '24 | Buy | 20.94 | 5 | 100 | 3,783 | May 03 09:51 AM | | Oliver Lawrence T. | VP and Secretary | Apr 01 '24 | Buy | 20.32 | 10 | 200 | 17,471 | Apr 03 10:58 AM | | Miles Christen Brooke | VP, Human Resources | Apr 01 '24 | Buy | 20.32 | 5 | 100 | 3,742 | Apr 03 10:57 AM | | Oliver Lawrence T. | VP and Secretary | Mar 01 '24 | Buy | 18.91 | 11 | 200 | 17,461 | Mar 05 01:07 PM |
|
|
|
 |
| Market Cap | 120.09M | EPS (ttm) | 1.94 |
| P/E | 8.56 | EPS this Y | - |
| Forward P/E | - | EPS next Y | - |
| PEG | - | EPS past 5Y | 1.51% |
| P/S | 0.90 | EPS next 5Y | - |
| P/B | 0.65 | EPS Q/Q | 27.17% |
| Dividend | 2.41% | Sales Q/Q | 34.28% |
| Insider Own | 40.12% | Inst Own | 15.00% |
| Insider Trans | 0.26% | Inst Trans | 4.12% |
| Short Float | 0.12% | Earnings | Apr 17/b |
| Analyst Recom | 1.00 | Target Price | 18.50 |
| Avg Volume | 6.00K | 52W Range | 13.62 - 18.86 |
|
|
|
|
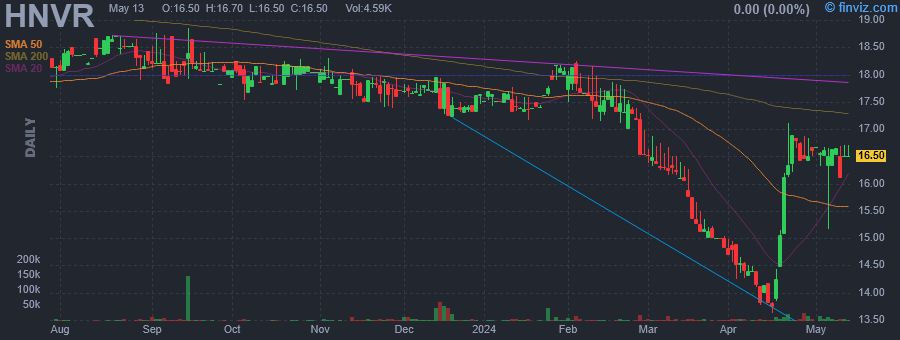
Hanover Bancorp, Inc. is a bank holding company, which engages in the provision of financial services and commercial banking products and services. It also offers multi-family and commercial mortgages, residential loans, business loans, and lines of credit. The company was founded on November 4, 2008 and is headquartered in New York, NY. |
| Insider Trading |
Relationship |
Date |
Transaction |
Cost |
#Shares |
Value ($) |
#Shares Total |
SEC Form 4 |
| Burke Lance P | EVP & Chief Financial Officer | May 02 '24 | Buy | 16.57 | 200 | 3,314 | 21,771 | May 03 09:29 AM | | Burke Lance P | EVP & Chief Financial Officer | May 01 '24 | Buy | 16.67 | 200 | 3,334 | 21,571 | May 03 09:29 AM | | PUORRO MICHAEL P | Chairman & CEO | Apr 30 '24 | Buy | 16.60 | 500 | 8,300 | 278,388 | May 01 10:49 AM | | Wilcox McClelland W | President | Apr 30 '24 | Buy | 16.60 | 250 | 4,150 | 81,537 | May 01 11:19 AM | | Burke Lance P | EVP & Chief Financial Officer | Apr 30 '24 | Buy | 16.60 | 200 | 3,320 | 21,371 | May 01 10:39 AM |
|
|
| |
 |
| Market Cap | 247.85M | EPS (ttm) | 0.21 |
| P/E | 82.96 | EPS this Y | - |
| Forward P/E | - | EPS next Y | - |
| PEG | - | EPS past 5Y | -16.49% |
| P/S | 2.77 | EPS next 5Y | - |
| P/B | 1.06 | EPS Q/Q | -33.20% |
| Dividend | 1.26% | Sales Q/Q | 15.90% |
| Insider Own | 13.51% | Inst Own | 38.81% |
| Insider Trans | 0.23% | Inst Trans | -15.26% |
| Short Float | 0.57% | Earnings | - |
| Analyst Recom | - | Target Price | - |
| Avg Volume | 16.02K | 52W Range | 14.38 - 24.84 |
|
|
|
Apr-25-24 09:56PM
|
JMSB Stock Earnings: John Marshall Bancorp Reported Results for Q1 2024
(InvestorPlace) |
|
09:05AM
|
John Marshall Bancorp, Inc. Announces Annual Cash Dividend
(Business Wire) |
|
09:00AM
|
John Marshall Bancorp, Inc. Reports First Quarter 2024 Results
(Business Wire) |
|
Apr-10-24 09:00AM
|
John Marshall Bank Hires Sean Biehl as Vice President, Commercial Lender in Northern Virginia
(Business Wire) |
|
Apr-08-24 09:00AM
|
John Marshall Bank Announces Escrow Optimizer, a New Digital Platform for Escrow Deposits
(Business Wire) |
|
Mar-04-24 09:00AM
|
John Marshall Bank Hires Lianne Wang as Senior Vice President, Regional Executive in Alexandria Market
(Business Wire) |
|
Feb-07-24 09:00AM
|
John Marshall Bank Hires Marie Brooks as Vice President, Branch Manager in the Loudoun Region
(Business Wire) |
|
Feb-06-24 09:00AM
|
John Marshall Bank Hires Brittany Wismer as VP, Business Development Officer Fiduciary Banking, to Support Growing Sales Efforts
(Business Wire) |
|
Jan-24-24 09:00AM
|
John Marshall Bancorp, Inc. Reports Higher Net Interest Margin, Strong Loan Growth and Pristine Asset Quality
(Business Wire) |
|
Dec-04-23 09:00AM
|
John Marshall Bank Announces Inclusion into the Small Business Administration Preferred Lender Program
(Business Wire) -9.09% |
|
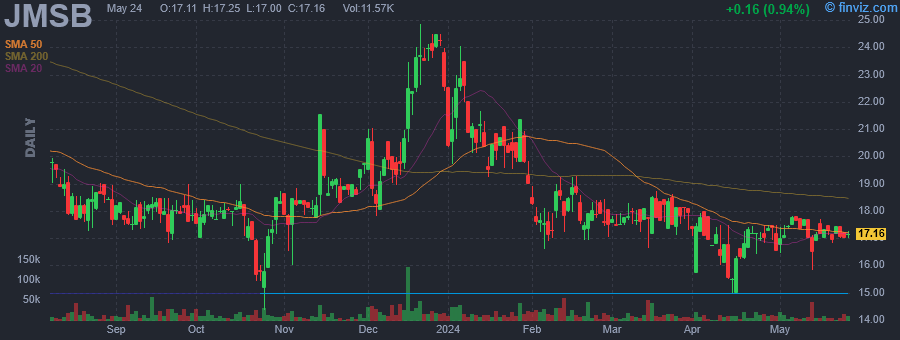
John Marshall Bancorp, Inc. operates as a bank holding company, which offers deposit and checking services, loans and lending solutions, cash management, and credit cards. The company was founded in May 2006 and is headquartered in Reston, VA. |
| Insider Trading |
Relationship |
Date |
Transaction |
Cost |
#Shares |
Value ($) |
#Shares Total |
SEC Form 4 |
| Kinney Jonathan Craig | Director | May 01 '24 | Buy | 16.50 | 260 | 4,290 | 108,398 | May 03 09:04 AM | | Kinney Jonathan Craig | Director | Apr 30 '24 | Buy | 17.06 | 1,019 | 17,386 | 174,617 | May 01 04:30 PM | | Kinney Jonathan Craig | Director | Apr 30 '24 | Buy | 16.50 | 40 | 660 | 108,138 | May 01 04:30 PM | | Kinney Jonathan Craig | Director | Apr 29 '24 | Buy | 17.14 | 2,000 | 34,280 | 173,598 | May 01 04:30 PM | | Kinney Jonathan Craig | Director | Apr 29 '24 | Buy | 17.15 | 1,181 | 20,250 | 108,098 | May 01 04:30 PM |
|
|
|
 |
| Market Cap | 1.34B | EPS (ttm) | -10.93 |
| P/E | - | EPS this Y | -140.63% |
| Forward P/E | - | EPS next Y | -72.56% |
| PEG | - | EPS past 5Y | -45.15% |
| P/S | 0.09 | EPS next 5Y | - |
| P/B | 2.66 | EPS Q/Q | -88.89% |
| Dividend | - | Sales Q/Q | -11.99% |
| Insider Own | 1.99% | Inst Own | 66.75% |
| Insider Trans | 5.01% | Inst Trans | 0.64% |
| Short Float | 14.20% | Earnings | Apr 30/a |
| Analyst Recom | 3.79 | Target Price | 1.51 |
| Avg Volume | 11.72M | 52W Range | 0.78 - 2.70 |
|
|
|
May-03-24 01:36PM
|
Hedge Fund and Insider Trading News: Boaz Weinstein, David Einhorn, Segantii Capital, ExodusPoint Capital, Tremblant Capital, Lumen Technologies Inc (LUMN), Reliance Inc (RS), and More
(Insider Monkey) |
|
08:58AM
|
Lumen Technologies Insider Bought Shares Worth $959,850, According to a Recent SEC Filing
(MT Newswires) |
|
May-01-24 01:16PM
|
Rates Staying Higher for Longer Could Mean More Big Goodwill Write-Downs Ahead
(The Wall Street Journal) |
|
12:02PM
|
Analyst Report: Lumen Technologies, Inc.
(Morningstar Research) |
|
11:02AM
|
Lumen (LUMN) Q1 Earnings Miss Estimates, Revenues Down Y/Y
(Zacks) |
|
08:35AM
|
Lumen unveils AI-powered threat defense tool for businesses
(PR Newswire) |
|
07:27AM
|
Q1 2024 Lumen Technologies Inc Earnings Call
(Thomson Reuters StreetEvents) |
|
03:30AM
|
Lumen Technologies Inc (LUMN) Q1 2024 Earnings Call Transcript Highlights: Strategic Shifts and ...
(GuruFocus.com) |
|
12:30AM
|
Lumen Technologies (LUMN) Q1 2024 Earnings Call Transcript
(Motley Fool) |
|
Apr-30-24 08:57PM
|
LUMN Stock Earnings: Lumen Technologies Misses Revenue for Q1 2024
(InvestorPlace) |
|
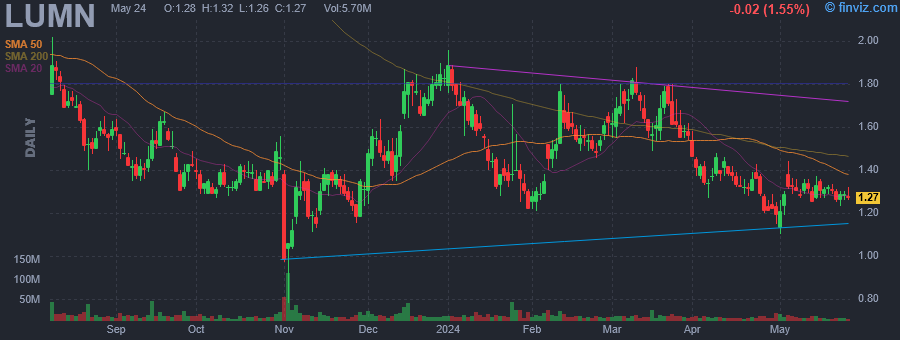
Lumen Technologies, Inc. is an investment holding company, which engages in the provision of integrated communications to residential and business customers. It operates through the following segments: Business and Mass Markets. Business segment provides products and services under four sales channels to enterprise and commercial customers. Mass Markets segment focuses on consumer and small business customers. The company was founded in 1930 and is headquartered in Monroe, LA. |
| Insider Trading |
Relationship |
Date |
Transaction |
Cost |
#Shares |
Value ($) |
#Shares Total |
SEC Form 4 |
| Johnson Kathleen E | President & CEO | May 02 '24 | Buy | 1.28 | 750,000 | 959,850 | 7,756,290 | May 03 08:18 AM | | SIEGEL LAURIE | Director | Mar 01 '24 | Buy | 1.60 | 30,000 | 47,997 | 30,000 | Mar 05 05:13 PM | | GLENN T MICHAEL | Director | Feb 26 '24 | Buy | 1.47 | 50,000 | 73,300 | 272,019 | Feb 27 04:52 PM | | Fowler James | Director | Feb 13 '24 | Buy | 1.68 | 33,500 | 56,428 | 216,538 | Feb 14 04:46 PM | | Fowler James | Director | Feb 09 '24 | Buy | 1.50 | 30,000 | 45,000 | 183,038 | Feb 12 05:39 PM |
|
|
| |
 |
| Market Cap | 74.65M | EPS (ttm) | -0.00 |
| P/E | - | EPS this Y | - |
| Forward P/E | - | EPS next Y | - |
| PEG | - | EPS past 5Y | - |
| P/S | - | EPS next 5Y | - |
| P/B | 8.19 | EPS Q/Q | -216.22% |
| Dividend | - | Sales Q/Q | - |
| Insider Own | 95.22% | Inst Own | 31.17% |
| Insider Trans | 2.37% | Inst Trans | - |
| Short Float | 4.26% | Earnings | - |
| Analyst Recom | - | Target Price | - |
| Avg Volume | 4.88K | 52W Range | 10.15 - 15.00 |
|
|
|
|
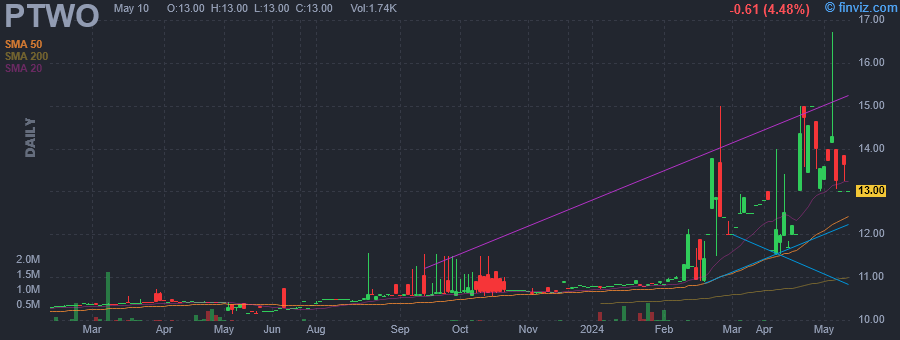
Pono Capital Two, Inc. operates as a blank check company, which was formed for the purpose of effecting a merger, capital stock exchange, asset acquisition, stock purchase, reorganization, or similar business combination with one or more businesses. The company was founded on March 11, 2022 and is headquartered in Honolulu, HI. |
| Insider Trading |
Relationship |
Date |
Transaction |
Cost |
#Shares |
Value ($) |
#Shares Total |
SEC Form 4 |
| ZUU Co. Ltd. | 10% Owner | Apr 30 '24 | Buy | 13.00 | 47 | 611 | 1,457,722 | May 02 09:03 PM | | ZUU Co. Ltd. | 10% Owner | Apr 23 '24 | Buy | 12.97 | 2,615 | 33,911 | 1,457,675 | Apr 25 09:00 PM | | ZUU Co. Ltd. | 10% Owner | Apr 11 '24 | Buy | 12.80 | 4 | 51 | 1,455,060 | Apr 11 09:00 PM | | ZUU Co. Ltd. | 10% Owner | Apr 09 '24 | Buy | 12.80 | 1 | 13 | 1,455,056 | Apr 11 09:00 PM | | ZUU Co. Ltd. | 10% Owner | Apr 05 '24 | Buy | 12.80 | 2 | 26 | 1,455,055 | Apr 08 09:48 PM |
|
|
|
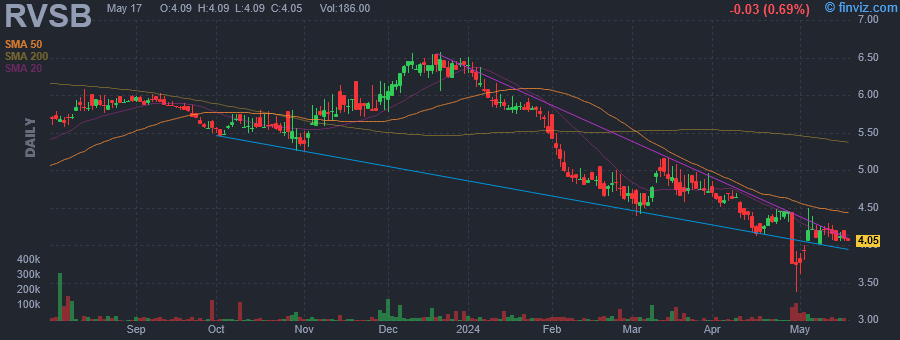 |
| Market Cap | 88.66M | EPS (ttm) | 0.18 |
| P/E | 23.42 | EPS this Y | -30.56% |
| Forward P/E | 9.33 | EPS next Y | 80.00% |
| PEG | 1.95 | EPS past 5Y | -25.09% |
| P/S | 1.33 | EPS next 5Y | 12.00% |
| P/B | 0.57 | EPS Q/Q | -200.86% |
| Dividend | 5.71% | Sales Q/Q | -12.58% |
| Insider Own | 7.44% | Inst Own | 64.72% |
| Insider Trans | 2.93% | Inst Trans | -1.98% |
| Short Float | 0.20% | Earnings | Apr 25/a |
| Analyst Recom | 2.00 | Target Price | 5.25 |
| Avg Volume | 25.51K | 52W Range | 3.37 - 6.57 |
|
|
|
|
Riverview Bancorp, Inc. operates as a holding company. It provides community banking services to small and medium size businesses, professionals, and individuals. It offers a range of deposit products, including demand deposits, negotiable order of withdrawal accounts, money market accounts, savings accounts, certificates of deposit, and retirement savings plans. The company also provides commercial business, commercial real estate, other real estate mortgage, and real estate construction loans, and consumer loans, such as one-to-four family mortgage loans, home equity lines of credit, land loans, and other secured and unsecured consumer loans. In addition, it is involved in the provision of mortgage brokerage and mortgage loan servicing activities, as well as offering asset management services consisting of trust, estate planning, and investment management services. The company was founded in 1997 and is headquartered in Vancouver, WA. |
| Insider Trading |
Relationship |
Date |
Transaction |
Cost |
#Shares |
Value ($) |
#Shares Total |
SEC Form 4 |
| Wills Bessie Ross | Director | May 02 '24 | Buy | 3.94 | 4,000 | 15,760 | 45,000 | May 02 07:34 PM | | Benke Robert | EVP/CCO | May 01 '24 | Buy | 3.83 | 5,000 | 19,150 | 15,994 | May 02 06:12 PM | | Carlson Bradley | Director | May 01 '24 | Buy | 3.75 | 1,000 | 3,750 | 20,421 | May 02 06:14 PM | | Eby Patricia | Director | Apr 30 '24 | Buy | 3.75 | 5,000 | 18,750 | 22,000 | May 01 07:25 PM | | Eby Patricia | Director | Apr 30 '24 | Buy | 3.75 | 2,000 | 7,500 | 4,400 | May 01 07:25 PM |
|
|
|
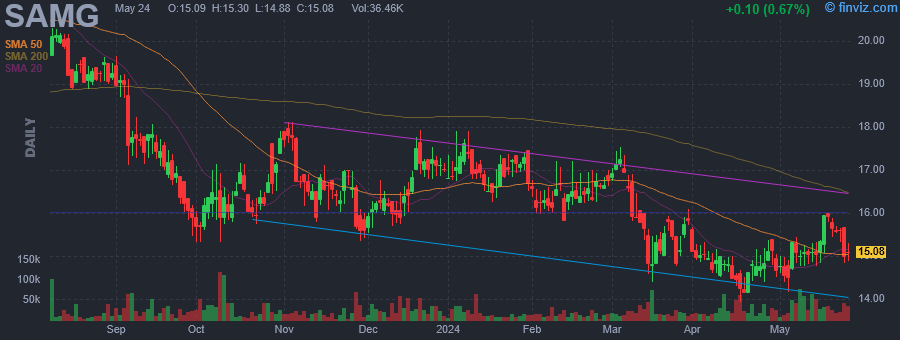 |
| Market Cap | 137.22M | EPS (ttm) | 0.94 |
| P/E | 15.40 | EPS this Y | 39.29% |
| Forward P/E | 8.62 | EPS next Y | 7.69% |
| PEG | 1.75 | EPS past 5Y | -3.63% |
| P/S | 1.16 | EPS next 5Y | 8.80% |
| P/B | 1.64 | EPS Q/Q | -5.74% |
| Dividend | 5.32% | Sales Q/Q | 2.85% |
| Insider Own | 0.88% | Inst Own | 72.78% |
| Insider Trans | 10.97% | Inst Trans | -0.63% |
| Short Float | 0.41% | Earnings | May 03/b |
| Analyst Recom | 1.00 | Target Price | 23.17 |
| Avg Volume | 23.13K | 52W Range | 13.93 - 23.20 |
|
|
|
|
Silvercrest Asset Management Group, Inc. operates as a wealth management firm. The firm provides traditional and alternative investment advisory and family office services to wealthy families and select institutional investors. It also offers portfolio, equity, and fixed income management and outsourced investment services. The company was founded in April 2002 and is headquartered in New York, NY. |
| Insider Trading |
Relationship |
Date |
Transaction |
Cost |
#Shares |
Value ($) |
#Shares Total |
SEC Form 4 |
| HOUGH RICHARD R III | Chairman and CEO | Apr 30 '24 | Option Exercise | 14.54 | 60,742 | 883,189 | 668,910 | May 02 05:55 PM | | Long Path Smaller Companies Fu | 10% Owner | Apr 30 '24 | Buy | 15.05 | 5,112 | 76,936 | 940,798 | May 02 07:27 PM | | Gray John Allen | Managing Director | Mar 13 '24 | Buy | 15.84 | 3,135 | 49,658 | 21,110 | Mar 14 04:30 PM | | HOUGH RICHARD R III | Chairman and CEO | Sep 13 '23 | Option Exercise | 13.97 | 105,398 | 1,472,410 | 691,496 | Sep 15 08:47 PM |
|
|
|
