 |
| Market Cap | 3.06B | EPS (ttm) | 2.48 |
| P/E | 20.71 | EPS this Y | 7.18% |
| Forward P/E | 17.92 | EPS next Y | 56.73% |
| PEG | - | EPS past 5Y | 10.75% |
| P/S | 1.72 | EPS next 5Y | -2.00% |
| P/B | 22.62 | EPS Q/Q | -8.33% |
| Dividend | 4.18% | Sales Q/Q | 12.74% |
| Insider Own | 15.98% | Inst Own | 84.62% |
| Insider Trans | -0.08% | Inst Trans | -1.82% |
| Short Float | 3.26% | Earnings | May 07/a |
| Analyst Recom | 1.73 | Target Price | 62.29 |
| Avg Volume | 443.77K | 52W Range | 37.17 - 63.28 |
|
|
|
May-16-24 03:12AM
|
Red Rock Resorts Insider Bought Shares Worth $40,312,000, According to a Recent SEC Filing
(MT Newswires) |
|
03:10AM
|
Red Rock Resorts Insider Sold Shares Worth $40,312,000, According to a Recent SEC Filing
(MT Newswires) |
|
May-14-24 11:00AM
|
Here's Why Diamond Hill Small Cap Believes in Lancaster Colony Corporation (LANC)'s Prospects
(Insider Monkey) |
|
09:42AM
|
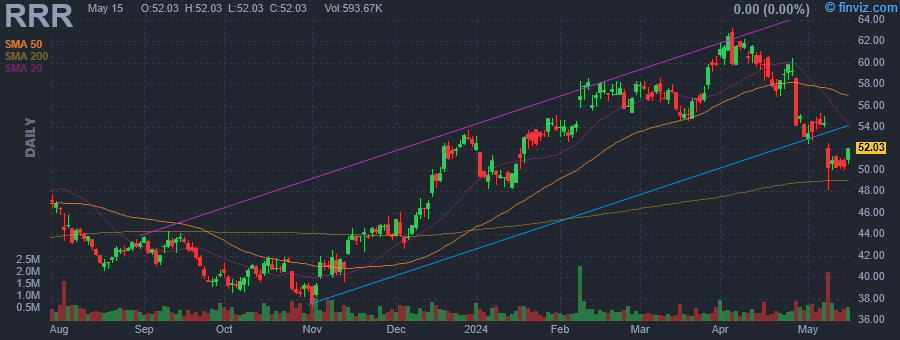
Is Red Rock Resorts (RRR) Trading at an Attractive Valuation?
(Insider Monkey) |
|
May-13-24 09:50AM
|
Ibotta initiated, Cisco upgraded: Wall Street's top analyst calls
(The Fly) |
|
09:36AM
|
BofA Securities Upgrades Red Rock Resorts to Neutral From Underperform, Adjusts Price Target to $55 From $57
(MT Newswires) |
|
May-08-24 02:50PM
|
Red Rock Resorts, Inc. (NASDAQ:RRR) Q1 2024 Earnings Call Transcript
(Insider Monkey) -7.62% |
|
12:18PM
|
Red Rock Resorts (RRR) Q1 Earnings Top Estimates, Revenues Lag
(Zacks) |
|
10:47AM
|
Stifel Adjusts Price Target on Red Rock Resorts to $59 From $61, Maintains Hold Rating
(MT Newswires) |
|
10:46AM
|
Wells Fargo Adjusts Red Rock Resorts' Price Target to $63 From $66, Keeps Overweight Rating
(MT Newswires) |
|
Red Rock Resorts, Inc. is a holding company, which engages in the management and development of gaming and entertainment facilities. The firm operates through the Las Vegas Operations and Native American Management segments. It offers gaming wagers, sales of food, beverage, hotel rooms and other amenities, and agreements to provide management services. The company was founded in 1976 and is headquartered in Las Vegas, NV. |
| Insider Trading |
Relationship |
Date |
Transaction |
Cost |
#Shares |
Value ($) |
#Shares Total |
SEC Form 4 |
| FERTITTA LORENZO J | Vice President | May 13 '24 | Buy | 50.39 | 800,000 | 40,312,000 | 47,447,301 | May 15 08:27 PM | | FERTITTA FRANK J III | Chief Executive Officer | May 13 '24 | Sale | 50.39 | 800,000 | 40,312,000 | 45,847,301 | May 15 08:31 PM | | Cootey Stephen Lawrence | EVP & Chief Financial Officer | Feb 23 '24 | Sale | 57.74 | 7,520 | 434,234 | 243,808 | Feb 27 06:09 PM | | Cootey Stephen Lawrence | EVP & Chief Financial Officer | Feb 15 '24 | Option Exercise | 30.13 | 156,429 | 4,713,206 | 383,101 | Feb 16 09:03 PM | | Welch Jeffrey T | EVP and Chief Legal Officer | Feb 15 '24 | Option Exercise | 20.48 | 220,690 | 4,519,731 | 361,592 | Feb 16 08:57 PM |
|
|
 |
 |
| Market Cap | 2.30B | EPS (ttm) | 0.13 |
| P/E | 186.68 | EPS this Y | -20.43% |
| Forward P/E | 12.39 | EPS next Y | 6.87% |
| PEG | 23.33 | EPS past 5Y | -32.97% |
| P/S | 3.23 | EPS next 5Y | 8.00% |
| P/B | 0.79 | EPS Q/Q | -25.32% |
| Dividend | 5.55% | Sales Q/Q | -1.42% |
| Insider Own | 2.32% | Inst Own | 94.27% |
| Insider Trans | -2.93% | Inst Trans | -1.26% |
| Short Float | 1.68% | Earnings | Apr 24/b |
| Analyst Recom | 2.29 | Target Price | 25.71 |
| Avg Volume | 554.59K | 52W Range | 17.86 - 30.13 |
|
|
|
|
Pacific Premier Bancorp, Inc. is a bank holding company, which engages in the provision of banking services through its subsidiary, Pacific Premier Bank. It offers deposit products and services for business and consumer customers, including checking, money market and savings accounts, cash management services, electronic banking, and on-line bill payment. The company was founded in 1997 and is headquartered in Irvine, CA. |
| Insider Trading |
Relationship |
Date |
Transaction |
Cost |
#Shares |
Value ($) |
#Shares Total |
SEC Form 4 |
| Wright Lori R | Sr. EVP, Deputy CFO | May 15 '24 | Sale | 23.59 | 4,668 | 110,132 | 31,259 | May 16 06:44 PM | | Wendoll Tamara | Pres. of Pacific Premier Trust | May 13 '24 | Buy | 23.14 | 43 | 1,000 | 24,152 | May 15 08:19 PM | | POLSKY BARBARA | Director | Mar 21 '24 | Buy | 23.92 | 1,200 | 28,704 | 14,507 | Mar 25 05:57 PM | | JONES JEFF C | Director | Jan 02 '24 | Option Exercise | 15.68 | 7,500 | 117,600 | 15,686 | Jan 03 05:34 PM | | Karr Michael S | SEVP & Chief Risk Officer | Dec 19 '23 | Option Exercise | 15.16 | 19,925 | 302,063 | 48,210 | Dec 21 04:58 PM |
|
|
|
 |
| Market Cap | 50.73B | EPS (ttm) | 11.02 |
| P/E | 26.20 | EPS this Y | -6.46% |
| Forward P/E | 26.73 | EPS next Y | 4.38% |
| PEG | - | EPS past 5Y | 5.31% |
| P/S | 11.07 | EPS next 5Y | - |
| P/B | 9.06 | EPS Q/Q | -1.86% |
| Dividend | 4.19% | Sales Q/Q | 5.76% |
| Insider Own | 10.19% | Inst Own | 83.25% |
| Insider Trans | -0.65% | Inst Trans | 0.61% |
| Short Float | 2.08% | Earnings | Apr 30/a |
| Analyst Recom | 2.11 | Target Price | 311.00 |
| Avg Volume | 713.83K | 52W Range | 233.18 - 312.25 |
|
|
|
|
Public Storage operates as a real estate investment trust, which engages in acquiring, developing, owning and operating self-storage facilities. It operates through the following segments: Self-storage Operations, Ancillary Operations, and Other Items. The Self-storage Operations segment reflects the rental operations from all self-storage facilities. The Ancillary Operations segment deals with the sale of merchandise and reinsurance of policies against losses to goods stored by self-storage tenants, activities which are incidental to the primary self-storage rental activities. The Other Items segment includes general, administrative, and investment costs. The company was founded by Bradley Wayne Hughes, Sr. and Kenneth Q. Volk, Jr. in 1972 and is headquartered in Glendale, CA. |
| Insider Trading |
Relationship |
Date |
Transaction |
Cost |
#Shares |
Value ($) |
#Shares Total |
SEC Form 4 |
| Pipes Kristy | Director | May 14 '24 | Buy | 278.96 | 2,149 | 599,485 | 2,149 | May 15 07:44 PM | | Vitan Nathaniel A. | Chief Legal Officer | Dec 13 '23 | Sale | 282.17 | 265 | 74,775 | 13,021 | Dec 15 10:57 AM | | REYES JOHN | Director | Dec 12 '23 | Option Exercise | 161.42 | 53,275 | 8,599,650 | 227,467 | Dec 12 08:25 PM | | REYES JOHN | Director | Dec 12 '23 | Sale | 272.97 | 53,275 | 14,542,560 | 174,192 | Dec 12 08:25 PM | | REYES JOHN | Director | Dec 11 '23 | Option Exercise | 161.42 | 50,000 | 8,071,000 | 224,192 | Dec 12 10:15 AM |
|
|
| |
 |
| Market Cap | 753.78M | EPS (ttm) | -1.01 |
| P/E | - | EPS this Y | 11.21% |
| Forward P/E | - | EPS next Y | 18.95% |
| PEG | - | EPS past 5Y | - |
| P/S | - | EPS next 5Y | - |
| P/B | 28.82 | EPS Q/Q | 17.68% |
| Dividend | - | Sales Q/Q | - |
| Insider Own | 24.06% | Inst Own | 19.47% |
| Insider Trans | 0.35% | Inst Trans | -9.29% |
| Short Float | 4.97% | Earnings | May 10/b |
| Analyst Recom | 1.40 | Target Price | 8.00 |
| Avg Volume | 1.63M | 52W Range | 1.96 - 7.02 |
|
|
|
May-16-24 02:20PM
|
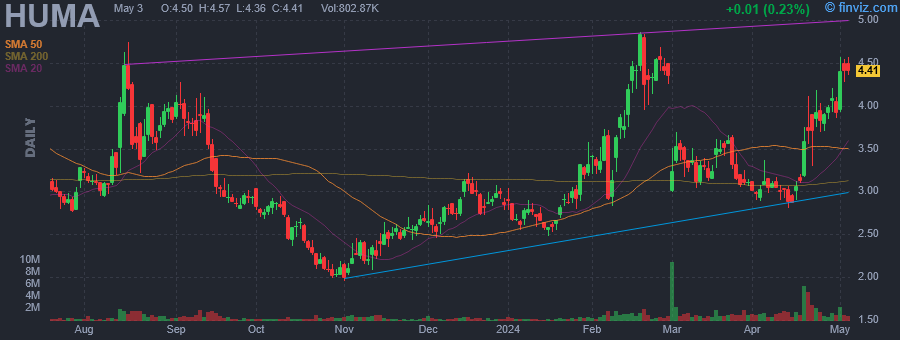
Hedge Fund and Insider Trading News: Michael Burry, Leon Cooperman, Ray Dalio, Stanley Druckenmiller, Millennium Management, Paulson & Co, Rokos Capital Management, Humacyte Inc (HUMA), GeneDx Holdings Corp. (WGS), and More
(Insider Monkey) |
|
May-13-24 08:00AM
|
Humacyte to Participate at Upcoming Investor Conferences in May
(GlobeNewswire) +16.60% |
|
May-10-24 02:43PM
|
Humacyte Inc (HUMA) Q1 2024 Earnings: Aligns with Analyst Projections Amid Strategic Advances
(GuruFocus.com) |
|
11:54AM
|
HUMA Stock Earnings: Humacyte Misses EPS for Q1 2024
(InvestorPlace) |
|
07:00AM
|
Humacyte First Quarter 2024 Financial Results and Business Update
(GlobeNewswire) |
|
May-06-24 08:00AM
|
Humacyte to Present First Quarter Financial Results and Provide Corporate Update on May 10, 2024
(GlobeNewswire) |
|
Apr-21-24 08:39AM
|
10 Stocks American Politicians are Buying in 2024
(Insider Monkey) |
|
Mar-26-24 04:05PM
|
Humacyte to Host Virtual KOL Event Hemodialysis Access: A Crossroads of Care, on March 28, 2024
(GlobeNewswire) |
|
Mar-23-24 10:16AM
|
Humacyte, Inc. (NASDAQ:HUMA) Q4 2023 Earnings Call Transcript
(Insider Monkey) |
|
Mar-22-24 11:53AM
|
HUMA Stock Earnings: Humacyte Meets EPS for Q4 2023
(InvestorPlace) -8.06% |
|
Humacyte, Inc. engages in the business of developing and manufacturing off-the-shelf, universally implantable, bioengineered human tissues, advanced tissue constructs, and organ systems with the goal of improving the lives of patients and transforming the practice of medicine. The company was founded by Laura E. Niklason, Shannon Dahl, and Juliana L. Blum on October 13, 2004 and is headquartered in Durham, NC. |
| Insider Trading |
Relationship |
Date |
Transaction |
Cost |
#Shares |
Value ($) |
#Shares Total |
SEC Form 4 |
| Binder Gordon M | Director | May 15 '24 | Buy | 6.78 | 50,000 | 339,000 | 160,000 | May 15 07:24 PM | | Binder Gordon M | Director | May 15 '24 | Buy | 6.57 | 50,000 | 328,500 | 50,000 | May 15 07:24 PM | | Dougan Brady W | Director | Oct 10 '23 | Option Exercise | 1.19 | 114,420 | 136,160 | 1,384,660 | Oct 10 04:11 PM | | Niklason Laura E | President, CEO and Director | Oct 10 '23 | Option Exercise | 1.19 | 114,420 | 136,160 | 1,384,660 | Oct 10 04:08 PM | | Niklason Laura E | President, CEO and Director | Sep 14 '23 | Sale | 2.78 | 2,000,000 | 5,560,000 | 6,191,140 | Sep 15 04:06 PM |
|
|
|
 |
| Market Cap | 59.26B | EPS (ttm) | 5.69 |
| P/E | 33.05 | EPS this Y | 8.01% |
| Forward P/E | 27.77 | EPS next Y | 11.82% |
| PEG | 3.72 | EPS past 5Y | 11.58% |
| P/S | 3.89 | EPS next 5Y | 8.89% |
| P/B | 5.48 | EPS Q/Q | 18.75% |
| Dividend | 1.16% | Sales Q/Q | 7.84% |
| Insider Own | 35.00% | Inst Own | 59.77% |
| Insider Trans | -0.01% | Inst Trans | -0.15% |
| Short Float | 1.36% | Earnings | Apr 30/a |
| Analyst Recom | 2.36 | Target Price | 204.64 |
| Avg Volume | 1.27M | 52W Range | 140.07 - 196.76 |
|
|
|
|
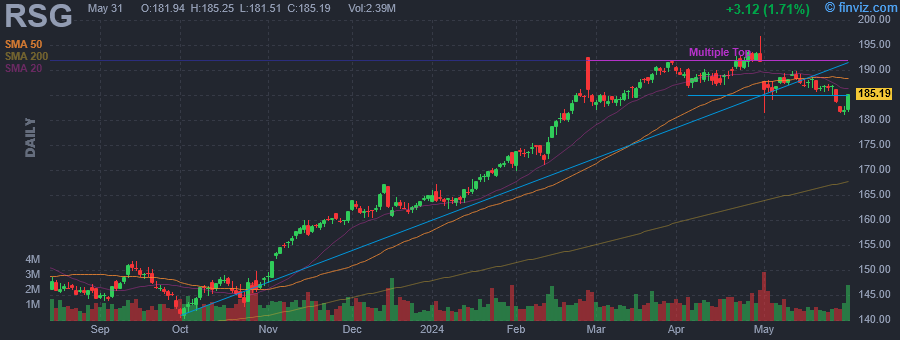
Republic Services, Inc. engages in the provision of environmental services. It operates through the following segments: Group 1, Group 2, and Group 3. The Group 1 segment focuses on the business of recycling and solid waste in geographic areas located in western United States. The Group 2 segment includes the recycling and solid waste business in geographic areas located in the southeastern and mid-western and the eastern seaboard of the United States. The Group 3 segment includes environmental solutions business in geographic areas located across the United States and Canada. The company was founded in 1996 and is headquartered in Phoenix, AZ. |
| Insider Trading |
Relationship |
Date |
Transaction |
Cost |
#Shares |
Value ($) |
#Shares Total |
SEC Form 4 |
| Volpe Sandra M | Director | May 15 '24 | Buy | 187.38 | 79 | 14,803 | 179 | May 15 06:27 PM | | Hodges Amanda | EVP, Chief Marketing Officer | May 06 '24 | Sale | 186.02 | 6,500 | 1,209,130 | 6,831 | May 07 08:25 PM | | TYLER BRIAN S. | Director | Apr 30 '24 | Option Exercise | 0.00 | 1,819 | 0 | 1,824 | May 02 07:20 PM | | Rodriguez Courtney | EVP, Chief HR Officer | Apr 28 '24 | Option Exercise | 0.00 | 1,050 | 0 | 1,394 | Apr 29 08:31 PM | | Vander Ark Jon | CEO and President | Mar 04 '24 | Sale | 184.10 | 5,446 | 1,002,609 | 85,113 | Mar 05 06:49 PM |
|
|
| |
 |
| Market Cap | 260.13M | EPS (ttm) | 0.13 |
| P/E | 38.12 | EPS this Y | -61.11% |
| Forward P/E | 64.04 | EPS next Y | 64.29% |
| PEG | - | EPS past 5Y | 19.26% |
| P/S | 5.17 | EPS next 5Y | - |
| P/B | 10.21 | EPS Q/Q | 280.65% |
| Dividend | - | Sales Q/Q | 30.04% |
| Insider Own | 38.43% | Inst Own | 27.18% |
| Insider Trans | 8.42% | Inst Trans | 7.21% |
| Short Float | 3.68% | Earnings | May 07/a |
| Analyst Recom | 1.00 | Target Price | 6.12 |
| Avg Volume | 477.61K | 52W Range | 1.67 - 4.98 |
|
|
|
|
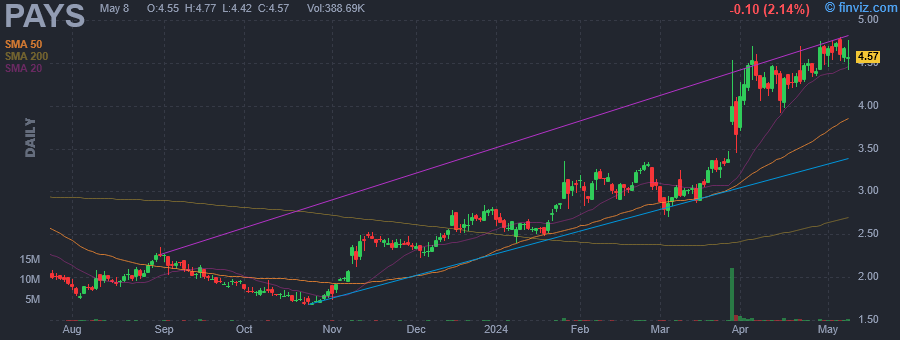
PaySign, Inc. engages in the provision of prepaid card programs and processing services for corporate, consumer and government applications. It specializes in corporate incentive products, payroll cards, general purpose re-loadable cards, and travel cards. It markets its prepaid solutions through its PaySign brand. The company was founded by Mark R. Newcomer and Daniel H. Spencer on August 24, 1995 and is headquartered in Henderson, NV. |
| Insider Trading |
Relationship |
Date |
Transaction |
Cost |
#Shares |
Value ($) |
#Shares Total |
SEC Form 4 |
| Mina Bruce A | Director | May 14 '24 | Buy | 4.81 | 1,206 | 5,801 | 218,500 | May 15 06:19 PM | | Topline Capital Partners, LP | 10% Owner | Mar 18 '24 | Buy | 3.07 | 7,242 | 22,233 | 6,160,742 | Mar 18 08:51 PM | | Topline Capital Management, LL | | Mar 18 '24 | Buy | 3.07 | 7,242 | 22,233 | 6,160,742 | Mar 18 08:57 PM | | Topline Capital Partners, LP | 10% Owner | Mar 15 '24 | Buy | 2.97 | 54,183 | 160,924 | 6,153,500 | Mar 18 08:51 PM | | Topline Capital Management, LL | | Mar 15 '24 | Buy | 2.97 | 54,183 | 160,924 | 6,153,500 | Mar 18 08:57 PM |
|
|
|
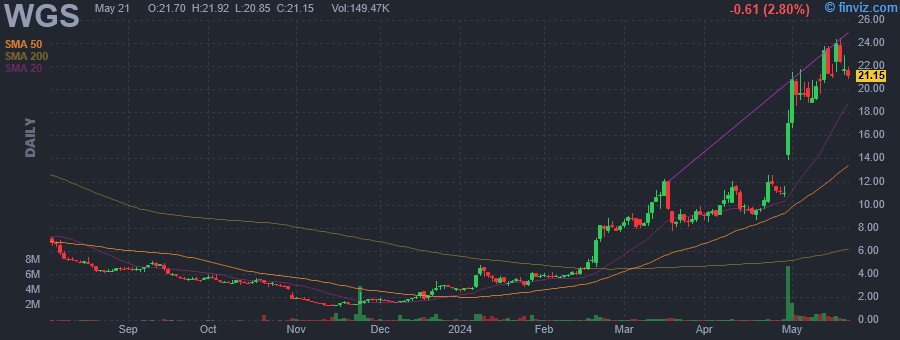 |
| Market Cap | 585.50M | EPS (ttm) | -5.25 |
| P/E | - | EPS this Y | 65.21% |
| Forward P/E | - | EPS next Y | 62.29% |
| PEG | - | EPS past 5Y | - |
| P/S | 2.64 | EPS next 5Y | - |
| P/B | 2.82 | EPS Q/Q | 74.45% |
| Dividend | - | Sales Q/Q | 44.70% |
| Insider Own | 37.80% | Inst Own | 49.30% |
| Insider Trans | 1.62% | Inst Trans | -11.87% |
| Short Float | 7.15% | Earnings | Apr 29/a |
| Analyst Recom | 2.00 | Target Price | 15.25 |
| Avg Volume | 449.09K | 52W Range | 1.16 - 24.32 |
|
|
|
May-16-24 02:20PM
|
Hedge Fund and Insider Trading News: Michael Burry, Leon Cooperman, Ray Dalio, Stanley Druckenmiller, Millennium Management, Paulson & Co, Rokos Capital Management, Humacyte Inc (HUMA), GeneDx Holdings Corp. (WGS), and More
(Insider Monkey) +13.52% |
|
Apr-30-24 07:31AM
|
Today's Biggest Pre-Market Stock Movers: 10 Top Gainers and Losers on Tuesday
(InvestorPlace) +55.18% |
|
Apr-29-24 08:55PM
|
WGS Stock Earnings: GeneDx Hldgs Beats EPS, Beats Revenue for Q1 2024
(InvestorPlace) |
|
05:50PM
|
GeneDx Holdings Corp. (WGS) Reports Q1 Loss, Tops Revenue Estimates
(Zacks) |
|
04:05PM
|
GeneDx Reports First Quarter 2024 Financial Results and Business Highlights
(GlobeNewswire) |
|
Apr-23-24 08:30AM
|
GeneDx Announces Partnership with Komodo Health to Expand Access to World's Largest Rare Disease Dataset
(GlobeNewswire) +15.50% |
|
Apr-04-24 04:05PM
|
GeneDx to Report First Quarter 2024 Financial Results on Monday, April 29, 2024
(GlobeNewswire) |
|
Mar-21-24 09:55AM
|
Here's Why GENEDX HOLDINGS (WGS) Could be Great Choice for a Bottom Fisher
(Zacks) +7.87% |
|
Mar-14-24 08:30AM
|
GeneDx to Present Data at the 2024 American College of Medical Genetics (ACMG) Annual Meeting Demonstrating Clinical Superiority of its Exome, Paving the Way for the Future of Genomics
(GlobeNewswire) |
|
Feb-26-24 04:05PM
|
GeneDx to Participate in 44th Annual Cowen Health Care Conference
(GlobeNewswire) |
|
GeneDx Holdings Corp. is a patient centered health intelligence company. It engages in transforming healthcare by applying AI and machine learning to multidimensional, longitudinal clinical and genomic data to build dynamic models of human health and defining optimal, individualized health trajectories. The firm, through its Centrellis health intelligence platform, generates a more complete understanding of disease and wellness and provides science-driven solutions to the most pressing medical needs. The company was founded by Eric Schadt in October 2015 and is headquartered in Stamford, CT. |
| Insider Trading |
Relationship |
Date |
Transaction |
Cost |
#Shares |
Value ($) |
#Shares Total |
SEC Form 4 |
| Casdin Capital, LLC | Director | May 13 '24 | Buy | 23.31 | 50,000 | 1,165,295 | 2,753,509 | May 15 06:16 PM | | PFENNIGER RICHARD C JR | Director | May 02 '24 | Option Exercise | 0.00 | 918 | 0 | 21,836 | May 03 04:04 PM | | Feeley Kevin | CHIEF FINANCIAL OFFICER | Apr 29 '24 | Option Exercise | 0.00 | 3,013 | 0 | 31,940 | Apr 30 04:27 PM | | Stueland Katherine | Chief Executive Officer | Apr 29 '24 | Option Exercise | 0.00 | 15,496 | 0 | 82,194 | Apr 30 04:30 PM | | Stueland Katherine | Chief Executive Officer | Apr 29 '24 | Sale | 11.04 | 6,325 | 69,808 | 75,869 | Apr 30 04:30 PM |
|
|
| |
 |
| Market Cap | 37.11M | EPS (ttm) | -1.42 |
| P/E | - | EPS this Y | 60.52% |
| Forward P/E | - | EPS next Y | 85.00% |
| PEG | - | EPS past 5Y | -64.63% |
| P/S | 0.11 | EPS next 5Y | - |
| P/B | 0.71 | EPS Q/Q | 13.23% |
| Dividend | - | Sales Q/Q | -9.08% |
| Insider Own | 39.57% | Inst Own | 21.43% |
| Insider Trans | -6.69% | Inst Trans | -11.61% |
| Short Float | 1.71% | Earnings | May 09/a |
| Analyst Recom | 1.00 | Target Price | 4.50 |
| Avg Volume | 64.39K | 52W Range | 1.32 - 8.20 |
|
|
|
|
Fathom Holdings, Inc. is a national, technology driven, end to end real estate services company, which engages in the provision of residential, brokerage, mortgage, title, insurance, and SaaS offerings for brokers and agents. It operates through the following segments: Real Estate Brokerage, Mortgage, Technology, and Corporate and Other Services. The company was founded by Joshua Harley in January 2010 and is headquartered in Cary, NC. |
| Insider Trading |
Relationship |
Date |
Transaction |
Cost |
#Shares |
Value ($) |
#Shares Total |
SEC Form 4 |
| Flanders Scott N | Director | May 15 '24 | Buy | 1.49 | 25,000 | 37,278 | 521,100 | May 15 06:03 PM | | Flanders Scott N | Director | May 14 '24 | Buy | 1.49 | 25,000 | 37,370 | 496,100 | May 15 06:03 PM | | Flanders Scott N | Director | May 13 '24 | Buy | 1.50 | 25,000 | 37,568 | 471,100 | May 15 06:03 PM | | Hood David C. | Director | May 13 '24 | Buy | 1.51 | 15,000 | 22,646 | 34,875 | May 14 04:48 PM | | Murray Stephen H. | Director | Dec 14 '23 | Buy | 2.66 | 18,817 | 50,053 | 34,249 | Dec 18 04:10 PM |
|
|
|
 |
| Market Cap | 12.38M | EPS (ttm) | -0.91 |
| P/E | - | EPS this Y | - |
| Forward P/E | - | EPS next Y | - |
| PEG | - | EPS past 5Y | -8.12% |
| P/S | 1.17 | EPS next 5Y | - |
| P/B | 0.90 | EPS Q/Q | 209.74% |
| Dividend | 0.54% | Sales Q/Q | 12.09% |
| Insider Own | 41.35% | Inst Own | 1.63% |
| Insider Trans | 8.62% | Inst Trans | -38.14% |
| Short Float | 0.13% | Earnings | - |
| Analyst Recom | 1.00 | Target Price | 9.00 |
| Avg Volume | 6.87K | 52W Range | 4.12 - 6.13 |
|
|
|
Mar-27-24 12:30PM
|
3 REITs Shunned By Wall Street: Any Hope For A Turn-Around?
(Benzinga) |
|
Mar-13-24 01:26AM
|
CEO & President, 10% Owner Frank Kavanaugh Acquires 36,801 Shares of Medalist Diversified ...
(GuruFocus.com) |
|
Sep-14-23 01:24PM
|
Director Emanuel Neuman Buys 4,142 Shares of Medalist Diversified REIT Inc (MDRR)
(GuruFocus.com) |
|
Aug-23-23 04:15PM
|
Medalist Diversified REIT, Inc. Releases Update From Interim CEO and President
(Business Wire) |
|
Aug-09-23 04:15PM
|
Medalist Diversified REIT, Inc. Grants Waiver to Shareholder Francis P. Kavanaugh to Increase Common Share Ownership
(Business Wire) |
|
Aug-07-23 04:25PM
|
Medalist Diversified REIT, Inc. Shifts to Long-Term Value Creation Amid Current Market Conditions
(Business Wire) |
|
Jul-18-23 05:18PM
|
Medalist Diversified REIT, Inc. Announces Transition to Internalized Management and Leadership Changes
(Business Wire) -5.90% |
|
Jul-12-23 04:59PM
|
Medalist Diversified REIT, Inc. Concludes Strategic Alternatives Process With Potential Asset Sale and Expected Transition to Internalized Management
(Business Wire) |
|
May-24-23 04:30PM
|
Medalist Diversified REIT, Inc. Announces the Appointment of Francis P. Kavanaugh to its Board of Directors
(Business Wire) |
|
May-22-23 04:45PM
|
Medalist Diversified REIT, Inc. Regains Compliance With Nasdaq Minimum Bid Price Requirement
(Business Wire) |
|
Medalist Diversified REIT, Inc. engages in the acquisition, reposition, renovate, lease, and management of income-producing properties. It focuses on commercial properties, including flex-industrial and retail properties, multi-family residential properties, and limited-service hotel properties. It operates through the following segments: Hotel Properties, Retail Center Properties, and Flex Center Property. The company was founded on September 28, 2015 and is headquartered in Richmond, VA. |
| Insider Trading |
Relationship |
Date |
Transaction |
Cost |
#Shares |
Value ($) |
#Shares Total |
SEC Form 4 |
| Winn Charles Brent Jr. | CHIEF FINANCIAL OFFICER | May 15 '24 | Buy | 5.60 | 1,254 | 7,022 | 69,448 | May 15 05:40 PM | | Winn Charles Brent Jr. | CHIEF FINANCIAL OFFICER | May 14 '24 | Buy | 5.60 | 2,250 | 12,600 | 68,194 | May 15 05:40 PM | | Winn Charles Brent Jr. | CHIEF FINANCIAL OFFICER | Mar 15 '24 | Buy | 5.85 | 1,311 | 7,669 | 65,944 | Mar 15 02:49 PM | | KAVANAUGH FRANK | CEO & PRESIDENT | Mar 14 '24 | Buy | 5.89 | 7,705 | 45,355 | 273,492 | Mar 14 05:45 PM | | Winn Charles Brent Jr. | CHIEF FINANCIAL OFFICER | Mar 14 '24 | Buy | 5.72 | 689 | 3,941 | 64,633 | Mar 15 02:49 PM |
|
|
|
 |
| Market Cap | 2.36B | EPS (ttm) | -0.20 |
| P/E | - | EPS this Y | -25.50% |
| Forward P/E | 8.20 | EPS next Y | -12.70% |
| PEG | - | EPS past 5Y | 8.03% |
| P/S | 2.68 | EPS next 5Y | 5.00% |
| P/B | 0.63 | EPS Q/Q | - |
| Dividend | 12.72% | Sales Q/Q | -0.90% |
| Insider Own | 26.69% | Inst Own | 10.11% |
| Insider Trans | 0.81% | Inst Trans | - |
| Short Float | 7.76% | Earnings | May 08/a |
| Analyst Recom | 3.50 | Target Price | 5.00 |
| Avg Volume | 1.87M | 52W Range | 5.03 - 6.69 |
|
|
|
|
Prospect Capital Corporation is a business development company. It specializes in middle market, mature, mezzanine finance, later stage, emerging growth, leveraged buyouts, refinancing, acquisitions, recapitalizations, turnaround, growth capital, development, capital expenditures and subordinated debt tranches of collateralized loan obligations, cash flow term loans, market place lending and bridge transactions. It also makes real estate investments particularly in multi-family residential real estate asset class. The fund makes secured debt, senior debt, senior and secured term loans, unitranche debt, first-lien and second lien, private debt, private equity, mezzanine debt, and equity investments in private and microcap public businesses. It focuses on both primary origination and secondary loans/portfolios and invests in situations like debt financings for private equity sponsors, acquisitions, dividend recapitalizations, growth financings, bridge loans, cash flow term loans, real estate financings/investments. It also focuses on investing in small-sized and medium-sized private companies rather than large public companies. The fund typically invests across all industry sectors, with a particular expertise in the energy and industrial sectors. It invests in aerospace and defense, chemicals, conglomerate services, consumer services, ecological, electronics, financial services, machinery, manufacturing, media, pharmaceuticals, retail, software, specialty minerals, textiles and leather, transportation, oil and gas production, coal production, materials, industrials, consumer discretionary, information technology, utilities, pipeline, storage, power generation and distribution, renewable and clean energy, oilfield services, healthcare, food and beverage, education, business services, and other select sectors. It prefers to invest in the United States and Canada. The fund seeks to invest between $10 million to $500 million per transaction in companies with EBITDA between $5 million and $150 million, sales value between $25 million and $500 million, and enterprise value between $5 million and $1000 million. It fund also co-invests for larger deals. The fund seeks control acquisitions by providing multiple levels of the capital structure. The fund focuses on sole, agented, club, or syndicated deals. |
| Insider Trading |
Relationship |
Date |
Transaction |
Cost |
#Shares |
Value ($) |
#Shares Total |
SEC Form 4 |
| Barry John F | CHIEF EXECUTIVE OFFICER | May 13 '24 | Buy | 5.47 | 4,099 | 22,407 | 65,796,357 | May 15 05:36 PM | | Barry John F | CHIEF EXECUTIVE OFFICER | May 10 '24 | Buy | 5.48 | 798,901 | 4,377,477 | 65,792,258 | May 14 04:01 PM | | Van Dask Kristin Lea | CFO, TREASURER, SECRETARY, CCO | Mar 11 '24 | Buy | 5.44 | 5,000 | 27,200 | 10,000 | Mar 13 04:03 PM | | Eliasek M Grier | Chief Operating Officer | Dec 06 '23 | Buy | 5.67 | 10,000 | 56,700 | 1,616,130 | Dec 08 04:01 PM | | Eliasek M Grier | Chief Operating Officer | Dec 05 '23 | Buy | 5.64 | 10,000 | 56,391 | 1,606,130 | Dec 07 05:04 PM |
|
|
|
