 |
| Market Cap | 14.03B | EPS (ttm) | 18.82 |
| P/E | 32.43 | EPS this Y | -8.60% |
| Forward P/E | 8.35 | EPS next Y | 244.95% |
| PEG | 1.62 | EPS past 5Y | 14.40% |
| P/S | 21.28 | EPS next 5Y | 20.03% |
| P/B | 12.50 | EPS Q/Q | 32.60% |
| Dividend | 0.72% | Sales Q/Q | 18.90% |
| Insider Own | 0.82% | Inst Own | 59.40% |
| Insider Trans | 1.11% | Inst Trans | 0.69% |
| Short Float | 3.46% | Earnings | May 08/a |
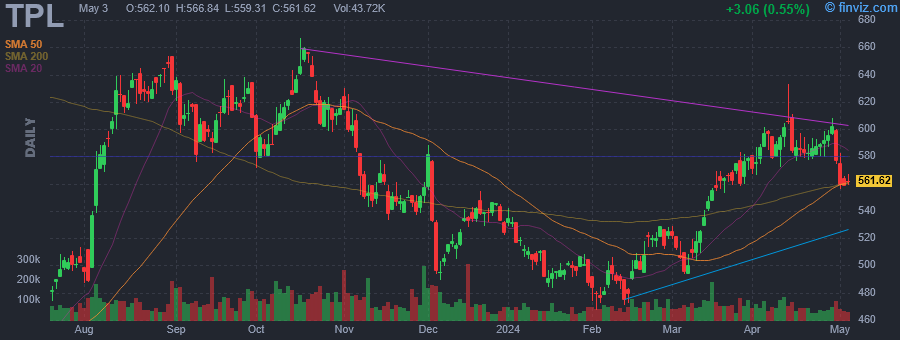
| Analyst Recom | 2.70 | Target Price | 660.71 |
| Avg Volume | 75.91K | 52W Range | 422.07 - 666.67 |
|
|
|
|
Texas Pacific Land Corporation engages in the land and resource management, and water services and operations businesses. The company owns a 1/128th nonparticipating perpetual oil and gas royalty interest (NPRI) under approximately 85,000 acres of land; a 1/16th NPRI under approximately 371,000 acres of land; and approximately 4,000 additional net royalty acres, total of approximately 195,000 NRA located in the western part of Texas. The Land and Resource Management segment manages surface acres of land, and oil and gas royalty interest in West Texas. This segment also engages in easements, such as transporting oil, gas and related hydrocarbons, power line and utility, and subsurface wellbore easements. In addition, this segment leases its land for processing, storage, and compression facilities and roads; and is involved in sale of materials, such as caliche, sand, and other material, as well as sells land. The Water Services and Operations segment provides full-service water offerings, including water sourcing, produced-water treatment, infrastructure development, and disposal solutions to operators in the Permian Basin. This segment also holds produced water royalties. Texas Pacific Land Corporation was founded in 1888 and is headquartered in Dallas, Texas. |
| Insider Trading |
Relationship |
Date |
Transaction |
Cost |
#Shares |
Value ($) |
#Shares Total |
SEC Form 4 |
| HORIZON KINETICS ASSET MANAGEM | 10% Owner | May 16 '24 | Buy | 604.85 | 3 | 1,815 | 1,085,001 | May 17 12:03 PM | | Cook Donald G | Director | May 15 '24 | Buy | 611.17 | 10 | 6,112 | 244 | May 17 05:12 PM | | HORIZON KINETICS ASSET MANAGEM | 10% Owner | May 15 '24 | Buy | 602.07 | 3 | 1,806 | 1,084,998 | May 16 11:12 AM | | HORIZON KINETICS ASSET MANAGEM | 10% Owner | May 14 '24 | Buy | 607.39 | 3 | 1,822 | 1,084,995 | May 15 11:20 AM | | HORIZON KINETICS ASSET MANAGEM | 10% Owner | May 13 '24 | Buy | 606.71 | 3 | 1,820 | 1,084,992 | May 14 10:12 AM |
|
|
 |
 |
| Market Cap | 25.96M | EPS (ttm) | -0.20 |
| P/E | - | EPS this Y | -886.50% |
| Forward P/E | - | EPS next Y | - |
| PEG | - | EPS past 5Y | - |
| P/S | 15.27 | EPS next 5Y | - |
| P/B | - | EPS Q/Q | 91.90% |
| Dividend | - | Sales Q/Q | -62.50% |
| Insider Own | 87.34% | Inst Own | - |
| Insider Trans | 24.34% | Inst Trans | - |
| Short Float | 2.29% | Earnings | - |
| Analyst Recom | - | Target Price | - |
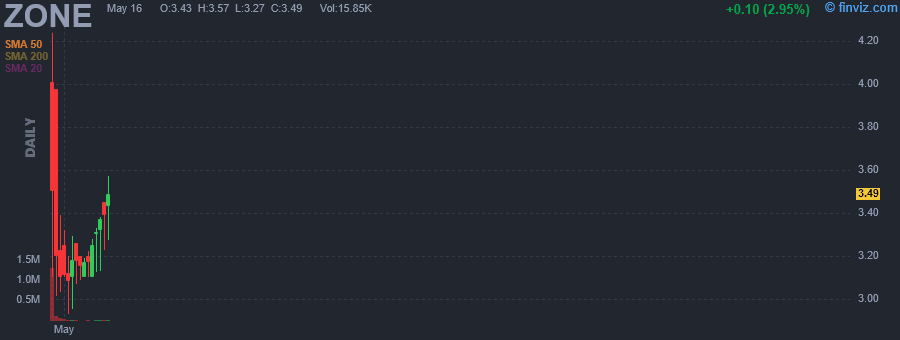
| Avg Volume | 117.16K | 52W Range | 2.93 - 4.24 |
|
|
|
|
CleanCore Solutions, Inc. engages in developing, manufacturing, and selling cleaning products that produces pure aqueous ozone for professional, industrial, and home use. The company's product includes fill station, power caddy, and power minicaddy, ice treatment machine, commercial laundry, and residential laundry. It offers products and solutions that are marketed for janitorial and sanitation, ice machine cleaning, laundry, and industrial industries. CleanCore Solutions, Inc. was formerly known as CC Acquisition Corp. and changed its name to CleanCore Solutions, Inc. in November 2022. The company was incorporated in 2022 and is based in Omaha, Nebraska. |
| Insider Trading |
Relationship |
Date |
Transaction |
Cost |
#Shares |
Value ($) |
#Shares Total |
SEC Form 4 |
| Adams Clayton | 10% Owner | May 16 '24 | Buy | 3.57 | 5,000 | 17,850 | 475,000 | May 17 05:02 PM | | Cox Brent | Director | May 10 '24 | Buy | 0.26 | 880,000 | 224,928 | 880,000 | May 14 06:06 AM | | Ansari Mohammad Jawad | 10% Owner | Apr 30 '24 | Buy | 4.01 | 125,000 | 501,250 | 1,461,207 | May 08 04:09 PM | | Adams Clayton | 10% Owner | Apr 30 '24 | Buy | 3.10 | 5,000 | 15,500 | 470,000 | May 02 05:53 PM | | Adams Clayton | 10% Owner | Apr 26 '24 | Buy | 4.01 | 145,000 | 581,450 | 465,000 | Apr 26 04:05 PM |
|
|
|
 |
| Market Cap | 65.00M | EPS (ttm) | 0.20 |
| P/E | 6.94 | EPS this Y | -18.18% |
| Forward P/E | 7.67 | EPS next Y | 0.00% |
| PEG | 0.33 | EPS past 5Y | 12.18% |
| P/S | 1.13 | EPS next 5Y | 21.00% |
| P/B | 1.12 | EPS Q/Q | -44.47% |
| Dividend | - | Sales Q/Q | -6.27% |
| Insider Own | 24.94% | Inst Own | 43.57% |
| Insider Trans | 0.07% | Inst Trans | 2.23% |
| Short Float | 1.85% | Earnings | May 08/a |
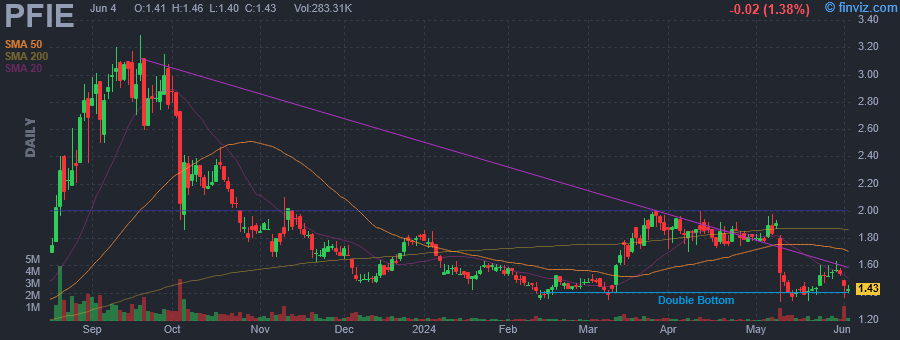
| Analyst Recom | 1.00 | Target Price | 3.75 |
| Avg Volume | 208.31K | 52W Range | 1.18 - 3.29 |
|
|
|
|
Profire Energy, Inc. engages in the manufacture of industrial combustion appliances. The firm offers products and services including fuel trains, flare and pilots, field, preventative maintenance installation, controllers, flame arrestors, monitoring and safety valves and solenoids, power distributions, installation components, consulting, burners, instrumentation, engineering and design, and startup and commissioning. It operates through the United States and Canada geographical segments. The company was founded on May 5, 2003 and is headquartered in Lindon, UT. |
| Insider Trading |
Relationship |
Date |
Transaction |
Cost |
#Shares |
Value ($) |
#Shares Total |
SEC Form 4 |
| Oviatt Ryan W | Co-CEO | May 17 '24 | Buy | 1.45 | 3,950 | 5,728 | 701,951 | May 17 04:45 PM | | Oviatt Ryan W | Co-CEO | May 16 '24 | Buy | 1.42 | 4,223 | 5,997 | 698,001 | May 17 04:45 PM | | Tidball Cameron M. | Co-CEO | Sep 13 '23 | Option Exercise | 0.84 | 100,000 | 84,390 | 741,452 | Sep 15 07:14 PM | | Oviatt Ryan W | Co-CEO | Sep 13 '23 | Option Exercise | 0.84 | 100,000 | 84,390 | 650,748 | Sep 15 07:00 PM | | Fisher Patrick David | VP of Product Development | Sep 13 '23 | Option Exercise | 0.79 | 66,000 | 51,810 | 237,418 | Sep 15 07:02 PM |
|
|
| |
 |
| Market Cap | 245.30M | EPS (ttm) | 0.21 |
| P/E | 82.50 | EPS this Y | - |
| Forward P/E | - | EPS next Y | - |
| PEG | - | EPS past 5Y | -16.49% |
| P/S | 2.75 | EPS next 5Y | - |
| P/B | 1.05 | EPS Q/Q | -33.40% |
| Dividend | 1.28% | Sales Q/Q | 15.39% |
| Insider Own | 13.55% | Inst Own | 40.24% |
| Insider Trans | 0.32% | Inst Trans | -15.26% |
| Short Float | 0.60% | Earnings | - |
| Analyst Recom | - | Target Price | - |
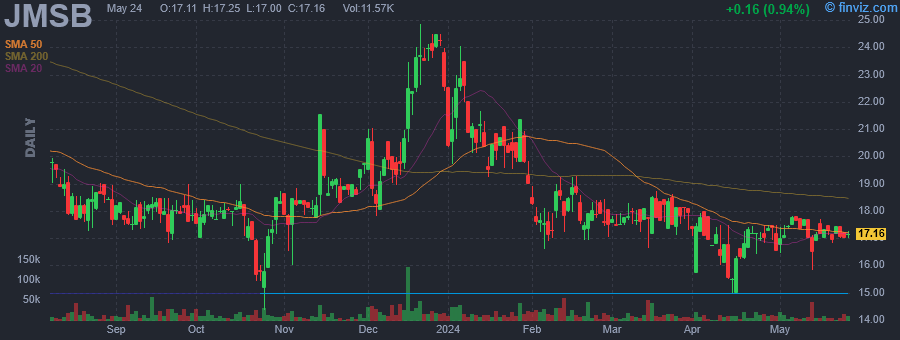
| Avg Volume | 13.76K | 52W Range | 14.38 - 24.84 |
|
|
|
May-13-24 09:00AM
|
John Marshall Bank Hires Ross A. Berman as Senior Vice President, Commercial Team Lead in Rockville
(Business Wire) |
|
Apr-25-24 09:56PM
|
JMSB Stock Earnings: John Marshall Bancorp Reported Results for Q1 2024
(InvestorPlace) |
|
09:05AM
|
John Marshall Bancorp, Inc. Announces Annual Cash Dividend
(Business Wire) |
|
09:00AM
|
John Marshall Bancorp, Inc. Reports First Quarter 2024 Results
(Business Wire) |
|
Apr-10-24 09:00AM
|
John Marshall Bank Hires Sean Biehl as Vice President, Commercial Lender in Northern Virginia
(Business Wire) |
|
Apr-08-24 09:00AM
|
John Marshall Bank Announces Escrow Optimizer, a New Digital Platform for Escrow Deposits
(Business Wire) |
|
Mar-04-24 09:00AM
|
John Marshall Bank Hires Lianne Wang as Senior Vice President, Regional Executive in Alexandria Market
(Business Wire) |
|
Feb-07-24 09:00AM
|
John Marshall Bank Hires Marie Brooks as Vice President, Branch Manager in the Loudoun Region
(Business Wire) |
|
Feb-06-24 09:00AM
|
John Marshall Bank Hires Brittany Wismer as VP, Business Development Officer Fiduciary Banking, to Support Growing Sales Efforts
(Business Wire) |
|
Jan-24-24 09:00AM
|
John Marshall Bancorp, Inc. Reports Higher Net Interest Margin, Strong Loan Growth and Pristine Asset Quality
(Business Wire) |
|
John Marshall Bancorp, Inc. operates as a bank holding company, which offers deposit and checking services, loans and lending solutions, cash management, and credit cards. The company was founded in May 2006 and is headquartered in Reston, VA. |
| Insider Trading |
Relationship |
Date |
Transaction |
Cost |
#Shares |
Value ($) |
#Shares Total |
SEC Form 4 |
| Kinney Jonathan Craig | Director | May 16 '24 | Buy | 17.02 | 300 | 5,106 | 108,998 | May 17 04:45 PM | | Kinney Jonathan Craig | Director | May 13 '24 | Buy | 16.69 | 800 | 13,353 | 175,698 | May 14 04:05 PM | | Kinney Jonathan Craig | Director | May 10 '24 | Buy | 17.20 | 300 | 5,160 | 108,698 | May 14 04:05 PM | | Kinney Jonathan Craig | Director | May 10 '24 | Buy | 17.55 | 181 | 3,177 | 174,898 | May 14 04:05 PM | | Kinney Jonathan Craig | Director | May 08 '24 | Buy | 17.50 | 100 | 1,750 | 174,717 | May 09 04:59 PM |
|
|
|
 |
| Market Cap | 263.36M | EPS (ttm) | -0.44 |
| P/E | - | EPS this Y | -67.18% |
| Forward P/E | - | EPS next Y | 60.23% |
| PEG | - | EPS past 5Y | - |
| P/S | 1.88 | EPS next 5Y | - |
| P/B | 1.71 | EPS Q/Q | 33.69% |
| Dividend | - | Sales Q/Q | -15.91% |
| Insider Own | 25.54% | Inst Own | 61.45% |
| Insider Trans | 1.20% | Inst Trans | 1.02% |
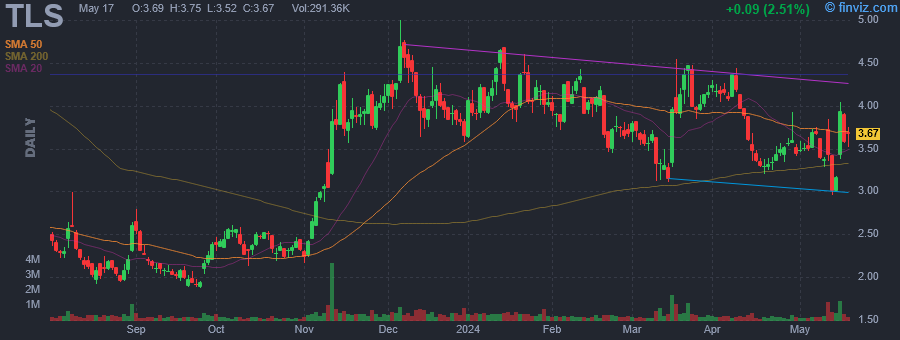
| Short Float | 1.32% | Earnings | May 10/b |
| Analyst Recom | 2.00 | Target Price | 5.40 |
| Avg Volume | 407.82K | 52W Range | 1.87 - 5.00 |
|
|
|
|
Telos Corp. engages in the design and provision of advanced technologies to deliver solutions that empower and protect the demanding enterprises. Its solutions include cyber security, cyber risk management and compliance, secure mobility, identity management, and information technology and enterprise solutions. The company was founded in October 1971 and is headquartered in Ashburn, VA. |
| Insider Trading |
Relationship |
Date |
Transaction |
Cost |
#Shares |
Value ($) |
#Shares Total |
SEC Form 4 |
| Schaufeld Fredrick | Director | May 17 '24 | Buy | 3.67 | 44,821 | 164,493 | 386,265 | May 17 04:25 PM | | Wood John B | Chairman and CEO | May 15 '24 | Buy | 3.93 | 25,000 | 98,250 | 4,868,281 | May 16 05:13 PM | | Schaufeld Fredrick | Director | May 15 '24 | Buy | 3.48 | 1,932 | 6,723 | 341,444 | May 16 05:09 PM | | Schaufeld Fredrick | Director | May 14 '24 | Buy | 3.14 | 84,063 | 263,958 | 339,512 | May 14 05:41 PM | | Wood John B | Chairman and CEO | May 14 '24 | Buy | 3.11 | 50,000 | 155,500 | 4,843,281 | May 14 05:43 PM |
|
|
| |
 |
| Market Cap | 8.78B | EPS (ttm) | 45.08 |
| P/E | 20.79 | EPS this Y | - |
| Forward P/E | - | EPS next Y | - |
| PEG | - | EPS past 5Y | - |
| P/S | 1.32 | EPS next 5Y | - |
| P/B | 5.49 | EPS Q/Q | 26.75% |
| Dividend | 0.21% | Sales Q/Q | 1.27% |
| Insider Own | 44.28% | Inst Own | 42.39% |
| Insider Trans | 0.00% | Inst Trans | -5.14% |
| Short Float | 2.38% | Earnings | May 06/a |
| Analyst Recom | 3.00 | Target Price | 144.00 |
| Avg Volume | 48.13K | 52W Range | 602.97 - 1030.00 |
|
|
|
|
Coca-Cola Consolidated, Inc. engages in the production, marketing, and distribution of nonalcoholic beverages. Its products include sparkling and still beverages as well as energy products and noncarbonated beverages such as bottled water, tea, ready to drink coffee, enhanced water, juices, and sports drinks. It operates through the Nonalcoholic Beverages, and All Other segments. The company was founded by J. B. Harrison in 1902 and is headquartered in Charlotte, NC. |
| Insider Trading |
Relationship |
Date |
Transaction |
Cost |
#Shares |
Value ($) |
#Shares Total |
SEC Form 4 |
| Everett Morgan Harrison | Vice Chair | Dec 18 '23 | Buy | 856.00 | 2 | 1,712 | 2 | May 17 04:22 PM |
|
|
|
 |
| Market Cap | 328.58M | EPS (ttm) | 4.68 |
| P/E | 10.17 | EPS this Y | -5.25% |
| Forward P/E | 9.68 | EPS next Y | 6.84% |
| PEG | - | EPS past 5Y | 8.99% |
| P/S | 2.26 | EPS next 5Y | - |
| P/B | 1.10 | EPS Q/Q | -13.12% |
| Dividend | 0.75% | Sales Q/Q | 18.32% |
| Insider Own | 37.60% | Inst Own | 21.98% |
| Insider Trans | -0.12% | Inst Trans | -1.50% |
| Short Float | 0.50% | Earnings | Apr 25/a |
| Analyst Recom | 1.00 | Target Price | 62.00 |
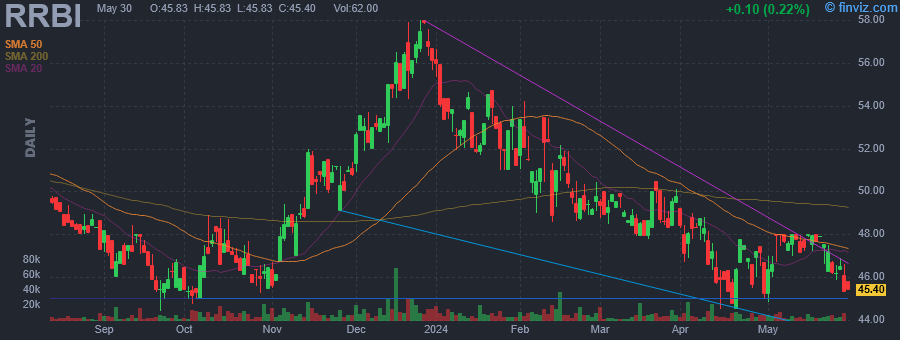
| Avg Volume | 7.93K | 52W Range | 44.15 - 58.00 |
|
|
|
|
Red River Bancshares, Inc. is a bank holding company, which engages in the provision of banking products and services for commercial and retail customers through its subsidiary. It offers real estate and commercial loans, treasury management, retail banking networks, private banking, residential mortgage lending, and investment services. The company was founded on March 16, 1998 and is headquartered in Alexandria, LA. |
| Insider Trading |
Relationship |
Date |
Transaction |
Cost |
#Shares |
Value ($) |
#Shares Total |
SEC Form 4 |
| BROWN MICHAEL J | Director | May 16 '24 | Buy | 47.68 | 197 | 9,393 | 3,000 | May 17 04:06 PM | | BROWN MICHAEL J | Director | May 15 '24 | Buy | 47.95 | 700 | 33,568 | 2,803 | May 17 04:06 PM | | BROWN MICHAEL J | Director | May 14 '24 | Buy | 47.77 | 202 | 9,650 | 2,103 | May 15 04:08 PM | | BROWN MICHAEL J | Director | May 13 '24 | Buy | 47.75 | 401 | 19,147 | 1,901 | May 15 04:08 PM | | Price Teddy Ray | Director | May 03 '24 | Buy | 47.08 | 738 | 34,742 | 367,478 | May 03 02:22 PM |
|
|
| |
 |
| Market Cap | 762.57M | EPS (ttm) | 1.09 |
| P/E | 30.79 | EPS this Y | -19.73% |
| Forward P/E | 12.21 | EPS next Y | 27.99% |
| PEG | 3.08 | EPS past 5Y | - |
| P/S | 0.59 | EPS next 5Y | 10.00% |
| P/B | 1.17 | EPS Q/Q | -72.01% |
| Dividend | 1.55% | Sales Q/Q | -11.12% |
| Insider Own | 2.18% | Inst Own | 92.63% |
| Insider Trans | 0.61% | Inst Trans | -1.64% |
| Short Float | 2.02% | Earnings | May 01/b |
| Analyst Recom | 2.33 | Target Price | 40.67 |
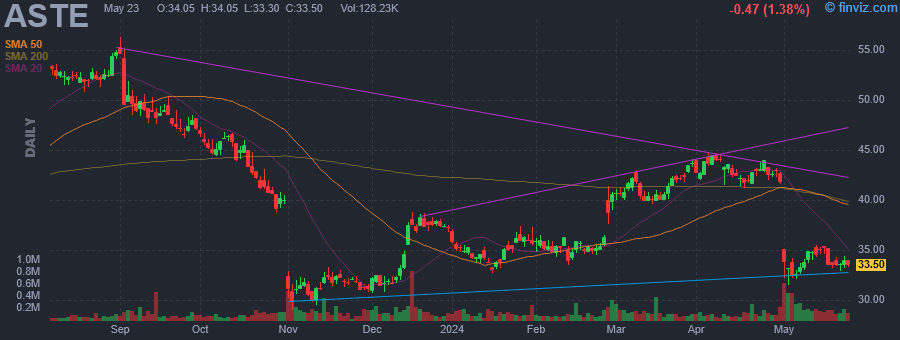
| Avg Volume | 163.72K | 52W Range | 28.97 - 56.33 |
|
|
|
|
Astec Industries, Inc. engages in the design, engineer, manufacture, and market of equipment and components used in road building and construction activities. It operates through the following segments: Infrastructure Solutions, Material Solutions, and Corporate and Other. The Infrastructure Solutions segment designs, engineers, manufactures, and markets a complete line of asphalt plants, concrete plants, and ancillary equipment, as well as supplying asphalt road construction equipment, industrial thermal systems, and heavy equipment. The Material Solutions segment designs and manufactures heavy processing equipment, in addition to servicing and supplying parts for the aggregate, metallic mining, recycling, ports, and bulk handling industries. The Corporate and Other segment is involved in the controls and automation business, through the firm's parent company, Astec Insurance. The company was founded by J. Don Brock in 1972 and is headquartered in Chattanooga, TN. |
| Insider Trading |
Relationship |
Date |
Transaction |
Cost |
#Shares |
Value ($) |
#Shares Total |
SEC Form 4 |
| Merwe Jaco van der | Chief Executive Officer | May 16 '24 | Buy | 33.70 | 2,000 | 67,400 | 73,878 | May 17 04:05 PM | | NORRIS MICHAEL PAUL | GROUP PRESIDENT | May 08 '24 | Buy | 33.46 | 1,000 | 33,460 | 15,886 | May 08 04:57 PM |
|
|
|
 |
| Market Cap | 439.01M | EPS (ttm) | 2.47 |
| P/E | 13.06 | EPS this Y | 28.83% |
| Forward P/E | 10.52 | EPS next Y | 21.47% |
| PEG | 1.31 | EPS past 5Y | - |
| P/S | 0.90 | EPS next 5Y | 10.00% |
| P/B | 0.67 | EPS Q/Q | 380.37% |
| Dividend | 4.34% | Sales Q/Q | -25.59% |
| Insider Own | 50.07% | Inst Own | 38.62% |
| Insider Trans | 0.15% | Inst Trans | -1.05% |
| Short Float | 0.11% | Earnings | May 08/b |
| Analyst Recom | 3.00 | Target Price | 55.00 |
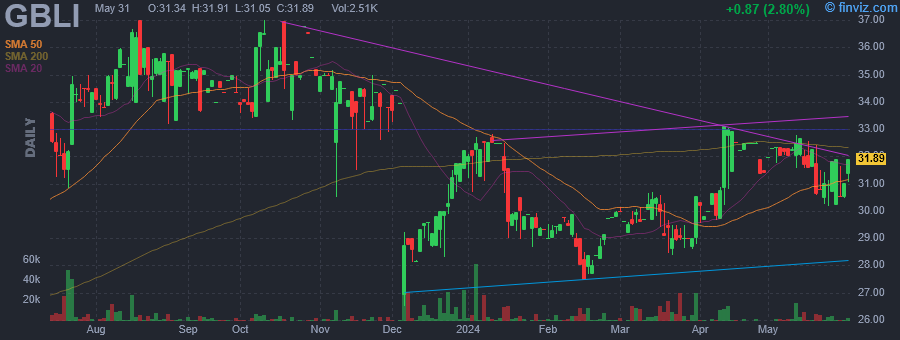
| Avg Volume | 5.36K | 52W Range | 25.21 - 37.00 |
|
|
|
|
Global Indemnity Group LLC engages in providing diversified insurance and reinsurance services. It operates through the following segments: Commercial Specialty, Reinsurance Operations, and Exited Lines. The Commercial Specialty segment provides specialty and casualty products designed for product lines such as small business binding authority, property brokerage, vacant express and programs. The Specialty Property segment offers specialty personal lines property and casualty insurance products. The Reinsurance Operations segment provides reinsurance solutions through brokers and primary writers including insurance and reinsurance companies. The company was founded in 2003 and is headquartered in Bala Cynwyd, PA. |
| Insider Trading |
Relationship |
Date |
Transaction |
Cost |
#Shares |
Value ($) |
#Shares Total |
SEC Form 4 |
| BROWN JOSEPH W | Chief Executive | May 15 '24 | Buy | 32.00 | 2,000 | 64,000 | 157,404 | May 17 04:02 PM | | BROWN JOSEPH W | Chief Executive | May 13 '24 | Buy | 32.47 | 8,000 | 259,745 | 155,404 | May 15 04:02 PM |
|
|
|
 |
| Market Cap | 139.82M | EPS (ttm) | 0.56 |
| P/E | 25.74 | EPS this Y | - |
| Forward P/E | - | EPS next Y | - |
| PEG | - | EPS past 5Y | - |
| P/S | 2.25 | EPS next 5Y | - |
| P/B | 2.90 | EPS Q/Q | 363.61% |
| Dividend | 1.19% | Sales Q/Q | 3.29% |
| Insider Own | 30.48% | Inst Own | 30.26% |
| Insider Trans | 1.04% | Inst Trans | 1.01% |
| Short Float | 7.18% | Earnings | Feb 14/b |
| Analyst Recom | - | Target Price | - |
| Avg Volume | 171.62K | 52W Range | 4.91 - 29.92 |
|
|
|
|
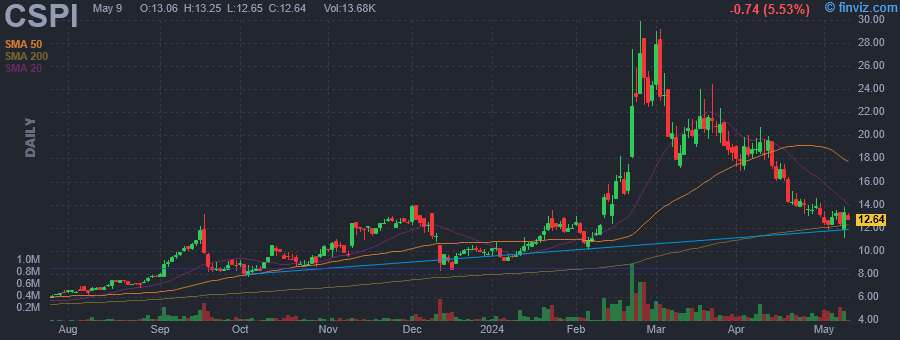
CSP, Inc. engages in the development and marketing of information technology integration solutions. It operates through the Technology Solutions (TS) and High-Performance Products (HPP) segments. The TS segment focuses on generating product revenues by reselling third-party computer hardware and software as a value-added reseller. The HPP segment involves the cybersecurity solution marketed as ARIA, Myricom network adapters and related software, and legacy Multicomputer product portfolio for digital signal processing. The company was founded in 1968 and is headquartered in Lowell, MA. |
| Insider Trading |
Relationship |
Date |
Transaction |
Cost |
#Shares |
Value ($) |
#Shares Total |
SEC Form 4 |
| NERGES JOSEPH R | 10% Owner | May 17 '24 | Buy | 14.32 | 1,905 | 27,284 | 1,342,721 | May 17 03:59 PM | | NERGES JOSEPH R | 10% Owner | May 15 '24 | Buy | 13.62 | 600 | 8,172 | 1,340,816 | May 17 03:59 PM | | NERGES JOSEPH R | Confidentiality agreement | May 14 '24 | Buy | 13.53 | 1,000 | 13,531 | 1,340,221 | May 14 03:57 PM | | NERGES JOSEPH R | Confidentiality agreement | May 13 '24 | Buy | 13.49 | 605 | 8,163 | 1,339,221 | May 14 03:57 PM | | NERGES JOSEPH R | Confidentiality agreement | May 10 '24 | Buy | 13.16 | 600 | 7,899 | 1,338,616 | May 14 03:57 PM |
|
|
|
