 |
| Market Cap | 277.96B | EPS (ttm) | 4.21 |
| P/E | 68.12 | EPS this Y | 19.16% |
| Forward P/E | 25.87 | EPS next Y | 13.04% |
| PEG | 4.20 | EPS past 5Y | 24.06% |
| P/S | 7.97 | EPS next 5Y | 16.22% |
| P/B | 4.66 | EPS Q/Q | 1576.91% |
| Dividend | 0.12% | Sales Q/Q | 10.77% |
| Insider Own | 3.06% | Inst Own | 82.51% |
| Insider Trans | -10.16% | Inst Trans | -0.97% |
| Short Float | 0.88% | Earnings | May 29/a |
| Analyst Recom | 1.66 | Target Price | 336.93 |
| Avg Volume | 5.61M | 52W Range | 193.68 - 318.71 |
|
|
|
|
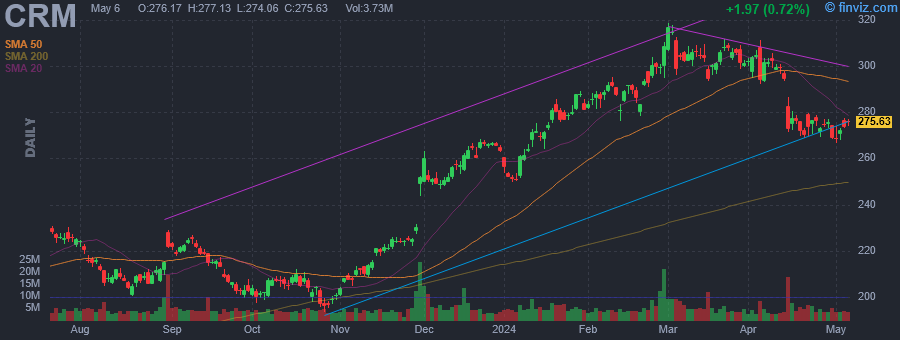
Salesforce, Inc. engages in the design and development of cloud-based enterprise software for customer relationship management. Its solutions include sales force automation, customer service and support, marketing automation, digital commerce, community management, collaboration, industry-specific solutions, and salesforce platform. The firm also provides guidance, support, training, and advisory services. The company was founded by Marc Russell Benioff and Parker Harris in 1999 and is headquartered in San Francisco, CA. |
| Insider Trading |
Relationship |
Date |
Transaction |
Cost |
#Shares |
Value ($) |
#Shares Total |
SEC Form 4 |
| Millham Brian | President and COO | May 15 '24 | Option Exercise | 218.21 | 2,106 | 459,550 | 2,106 | May 16 04:53 PM | | Benioff Marc | Chair and CEO | May 15 '24 | Sale | 284.73 | 15,000 | 4,270,881 | 12,557,327 | May 16 04:45 PM | | Millham Brian | President and COO | May 15 '24 | Sale | 280.00 | 2,106 | 589,680 | 0 | May 16 04:53 PM | | Harris Parker | Co-Founder and CTO, Slack | May 14 '24 | Option Exercise | 118.04 | 4,200 | 495,768 | 119,962 | May 15 04:37 PM | | Benioff Marc | Chair and CEO | May 14 '24 | Sale | 276.85 | 15,000 | 4,152,698 | 12,572,327 | May 15 04:51 PM |
|
|
 |
 |
| Market Cap | 1.96B | EPS (ttm) | -3.50 |
| P/E | - | EPS this Y | 13.82% |
| Forward P/E | - | EPS next Y | 55.97% |
| PEG | - | EPS past 5Y | -16.93% |
| P/S | 6.73 | EPS next 5Y | - |
| P/B | 2.53 | EPS Q/Q | -7.51% |
| Dividend | - | Sales Q/Q | 38.78% |
| Insider Own | 0.54% | Inst Own | 42.51% |
| Insider Trans | -11.16% | Inst Trans | -1.97% |
| Short Float | 4.44% | Earnings | May 08/a |
| Analyst Recom | 1.15 | Target Price | 51.82 |
| Avg Volume | 640.61K | 52W Range | 13.48 - 37.92 |
|
|
|
|
Zai Lab Ltd. is a biopharmaceutical company, which engages in the developing and commercializing therapies that address medical conditions with unmet needs in oncology, autoimmune disorders, infectious diseases, and neuroscience. Its products include Zejula, Optune, Qinlock, and Nuzyra. The company was founded by Samantha Ying Du and Marietta Wu in April 2014 and is headquartered in Shanghai, China. |
| Insider Trading |
Relationship |
Date |
Transaction |
Cost |
#Shares |
Value ($) |
#Shares Total |
SEC Form 4 |
| Edmondson Frazor Titus III | Chief Legal Officer | May 14 '24 | Sale | 21.33 | 10,000 | 213,346 | 16,408 | May 16 04:52 PM | | Smiley Joshua L | See Remarks | May 13 '24 | Buy | 21.40 | 3,000 | 64,200 | 31,684 | May 15 04:03 PM | | Reinhart Harald | See Remarks | Apr 04 '24 | Sale | 15.67 | 2,105 | 32,992 | 51,800 | Apr 05 05:48 PM | | Smiley Joshua L | See Remarks | Apr 04 '24 | Sale | 15.67 | 1,988 | 31,158 | 28,684 | Apr 05 05:48 PM | | Amado Rafael | See Remarks | Apr 04 '24 | Sale | 15.67 | 1,952 | 30,594 | 23,532 | Apr 05 05:47 PM |
|
|
|
 |
| Market Cap | 11.29B | EPS (ttm) | 0.69 |
| P/E | 50.31 | EPS this Y | -14.59% |
| Forward P/E | 15.45 | EPS next Y | 16.45% |
| PEG | 4.57 | EPS past 5Y | -9.86% |
| P/S | 2.11 | EPS next 5Y | 11.00% |
| P/B | 2.52 | EPS Q/Q | -100.96% |
| Dividend | 2.51% | Sales Q/Q | -16.25% |
| Insider Own | 1.29% | Inst Own | 90.25% |
| Insider Trans | -7.48% | Inst Trans | -0.69% |
| Short Float | 3.79% | Earnings | Apr 25/a |
| Analyst Recom | 3.00 | Target Price | 40.06 |
| Avg Volume | 3.35M | 52W Range | 24.87 - 38.04 |
|
|
|
|
Juniper Networks, Inc. engages in the business of designing, developing, and selling products and services for networks to enable customers to build networks for their businesses. The firm also offers routing, switching, Wi-Fi, network security, artificial intelligence-enabled enterprise networking operations, and software-defined networking technologies. The company was founded by Pradeep S. Sindhu on February 6, 1996 and is headquartered in Sunnyvale, CA. |
| Insider Trading |
Relationship |
Date |
Transaction |
Cost |
#Shares |
Value ($) |
#Shares Total |
SEC Form 4 |
| Miller Kenneth Bradley | EVP CFO | May 15 '24 | Sale | 34.47 | 15,000 | 517,083 | 69,435 | May 16 04:50 PM | | Gorjanc Christine Marie | Director | May 10 '24 | Option Exercise | 0.00 | 7,682 | 0 | 44,125 | May 13 07:08 PM | | DENUCCIO KEVIN A | Director | May 10 '24 | Option Exercise | 0.00 | 7,682 | 0 | 21,550 | May 13 07:09 PM | | DOLCE JAMES A JR | Director | May 10 '24 | Option Exercise | 0.00 | 7,682 | 0 | 31,995 | May 13 07:08 PM | | Fernandez Steven | Director | May 10 '24 | Option Exercise | 0.00 | 7,682 | 0 | 14,789 | May 13 07:08 PM |
|
|
| |
 |
| Market Cap | 21.06B | EPS (ttm) | 13.41 |
| P/E | 29.26 | EPS this Y | 6.56% |
| Forward P/E | 22.39 | EPS next Y | 7.25% |
| PEG | 4.18 | EPS past 5Y | 16.51% |
| P/S | 3.84 | EPS next 5Y | 7.00% |
| P/B | 7.19 | EPS Q/Q | -18.88% |
| Dividend | 1.25% | Sales Q/Q | 8.85% |
| Insider Own | 0.36% | Inst Own | 91.31% |
| Insider Trans | -15.60% | Inst Trans | 1.55% |
| Short Float | 2.43% | Earnings | Apr 30/b |
| Analyst Recom | 1.92 | Target Price | 418.00 |
| Avg Volume | 442.07K | 52W Range | 248.37 - 429.61 |
|
|
|
|
Hubbell, Inc. engages in the designing, manufacturing, and sale of electrical and electronic products for non-residential and residential construction, industrial, and utility applications. It operates through the Electrical Solutions and Utility Solutions segments. The Electrical Solutions segment manufactures and sells wiring and electrical, lighting fixtures, and controls for indoor and outdoor applications as well as specialty lighting and communications products. The Utility Solutions segment is involved in the design, manufacture, and sale of electrical distribution, transmission, substation, and telecommunications products. The company was founded by Harvey Hubbell II in 1888 and is headquartered in Shelton, CT. |
| Insider Trading |
Relationship |
Date |
Transaction |
Cost |
#Shares |
Value ($) |
#Shares Total |
SEC Form 4 |
| FLYNN ALYSSA R | Chief Human Resources Officer | May 15 '24 | Sale | 403.82 | 7 | 2,783 | 4,226 | May 16 04:48 PM | | FLYNN ALYSSA R | Chief Human Resources Officer | May 14 '24 | Sale | 399.82 | 1 | 346 | 4,233 | May 16 04:48 PM | | Mikes Mark Eugene | President Electrical Solutions | May 13 '24 | Sale | 401.34 | 1,942 | 779,410 | 3,436 | May 15 04:42 PM | | FLYNN ALYSSA R | Chief Human Resources Officer | May 10 '24 | Option Exercise | 105.48 | 1,361 | 143,565 | 6,129 | May 14 04:47 PM | | FLYNN ALYSSA R | Chief Human Resources Officer | May 10 '24 | Sale | 406.79 | 1,106 | 449,910 | 4,234 | May 14 04:47 PM |
|
|
|
 |
| Market Cap | 437.89M | EPS (ttm) | 0.94 |
| P/E | 33.71 | EPS this Y | 6.00% |
| Forward P/E | 15.84 | EPS next Y | 7.82% |
| PEG | - | EPS past 5Y | -4.81% |
| P/S | 0.83 | EPS next 5Y | - |
| P/B | 2.13 | EPS Q/Q | 205.64% |
| Dividend | - | Sales Q/Q | 19.38% |
| Insider Own | 6.53% | Inst Own | 69.58% |
| Insider Trans | -26.24% | Inst Trans | 8.97% |
| Short Float | 3.49% | Earnings | May 02/a |
| Analyst Recom | 1.00 | Target Price | 34.50 |
| Avg Volume | 70.22K | 52W Range | 15.87 - 34.81 |
|
|
|
|
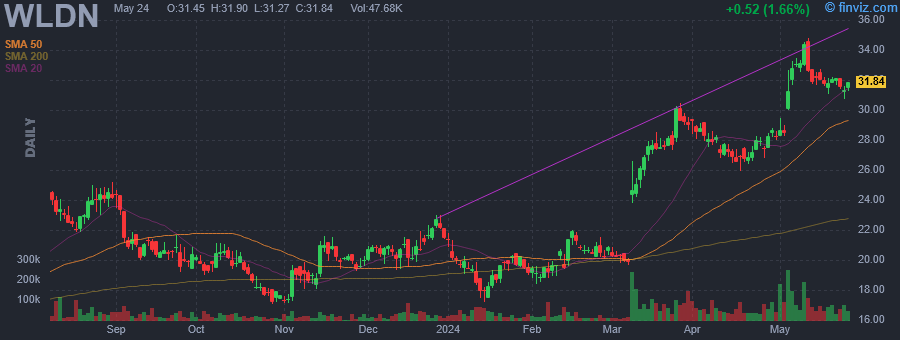
Willdan Group, Inc. engages in the provision of technical and consulting services. It operates through the Energy and the Engineering and Consulting segments. The Energy segment offers energy and sustainability consulting services to utilities, public agencies and private industry. The Engineering and Consulting segment provides civil engineering-related construction management, building and safety, city engineering office management, city planning, civil design, geotechnical, material testing and other engineering consulting services. The company was founded in May 1964 and is headquartered in Anaheim, CA. |
| Insider Trading |
Relationship |
Date |
Transaction |
Cost |
#Shares |
Value ($) |
#Shares Total |
SEC Form 4 |
| Forager Fund, L.P. | 10% Owner | May 16 '24 | Sale | 32.01 | 1,060 | 33,931 | 1,510,430 | May 16 04:48 PM | | Forager Fund, L.P. | 10% Owner | May 15 '24 | Sale | 32.60 | 5,505 | 179,486 | 1,511,490 | May 16 04:48 PM | | Forager Fund, L.P. | 10% Owner | May 14 '24 | Sale | 32.07 | 5,900 | 189,188 | 1,516,995 | May 16 04:48 PM | | Forager Fund, L.P. | 10% Owner | May 13 '24 | Sale | 32.32 | 1,799 | 58,140 | 1,522,895 | May 13 04:58 PM | | Forager Fund, L.P. | 10% Owner | May 10 '24 | Sale | 33.15 | 15,580 | 516,495 | 1,524,694 | May 13 04:58 PM |
|
|
| |
 |
| Market Cap | 117.28M | EPS (ttm) | 0.49 |
| P/E | 25.77 | EPS this Y | - |
| Forward P/E | - | EPS next Y | - |
| PEG | - | EPS past 5Y | - |
| P/S | 1.97 | EPS next 5Y | - |
| P/B | 0.71 | EPS Q/Q | -30.23% |
| Dividend | - | Sales Q/Q | 30.18% |
| Insider Own | 14.98% | Inst Own | 23.25% |
| Insider Trans | 0.39% | Inst Trans | - |
| Short Float | 0.19% | Earnings | - |
| Analyst Recom | - | Target Price | - |
| Avg Volume | 6.16K | 52W Range | 9.82 - 13.63 |
|
|
|
|
ECB Bancorp, Inc. is a bank holding company. It intends to pursue other business activities permitted by applicable laws and regulations, which may include the acquisition of other banking and financial services companies. The company was founded in March 2022 and is headquartered in Everett, MA. |
| Insider Trading |
Relationship |
Date |
Transaction |
Cost |
#Shares |
Value ($) |
#Shares Total |
SEC Form 4 |
| CITRANO John A | EVP, COO and CFO | May 15 '24 | Buy | 12.35 | 399 | 4,928 | 46,000 | May 16 05:16 PM | | CITRANO John A | EVP, COO and CFO | May 14 '24 | Buy | 12.10 | 1,400 | 16,944 | 45,601 | May 16 05:16 PM | | CITRANO John A | EVP, COO and CFO | May 13 '24 | Buy | 12.21 | 4,800 | 58,618 | 44,201 | May 14 04:58 PM | | CITRANO John A | EVP, COO and CFO | May 10 '24 | Buy | 11.83 | 3,500 | 41,402 | 39,401 | May 14 04:58 PM | | CITRANO John A | EVP, COO and CFO | May 09 '24 | Buy | 11.87 | 901 | 10,695 | 35,901 | May 13 04:31 PM |
|
|
|
 |
| Market Cap | 8.47B | EPS (ttm) | -0.14 |
| P/E | - | EPS this Y | 47.68% |
| Forward P/E | 25.10 | EPS next Y | 45.90% |
| PEG | - | EPS past 5Y | - |
| P/S | 0.70 | EPS next 5Y | 40.00% |
| P/B | 3.17 | EPS Q/Q | 49.50% |
| Dividend | - | Sales Q/Q | 3.95% |
| Insider Own | 22.46% | Inst Own | 75.71% |
| Insider Trans | -0.04% | Inst Trans | 1.78% |
| Short Float | 5.07% | Earnings | May 02/a |
| Analyst Recom | 1.64 | Target Price | 116.92 |
| Avg Volume | 892.59K | 52W Range | 44.65 - 123.33 |
|
|
|
|
MasTec, Inc. engages in the provision of infrastructure construction services. It operates through the following segments: Communications, Oil and Gas, Clean Energy and Infrastructure, and Other. The Communications segment performs engineering, construction, maintenance, and customer fulfillment activities related to communications infrastructure, primarily for wireless and wireline/fiber communications, and install-to-the-home customers. The Oil and Gas segment offers services on oil and natural gas pipelines and processing facilities for the energy and utilities industries. The Clean Energy and Infrastructure segment serves energy, utility and other end-markets through the installation and construction of power generation facilities, including from clean energy and renewable sources such as wind, solar and biomass, as well as various types of heavy civil and industrial infrastructure. The Other segment consists of equity investors, other small business units that perform construction, and other services for a variety of international end-markets. The company was founded by Jorge Mas Canosa on July 26, 1968, and is headquartered in Coral Gables, FL. |
| Insider Trading |
Relationship |
Date |
Transaction |
Cost |
#Shares |
Value ($) |
#Shares Total |
SEC Form 4 |
| Campbell C Robert | Director | May 14 '24 | Sale | 108.00 | 3,000 | 324,000 | 52,289 | May 16 04:42 PM | | Palomarez Javier Alberto | Director | May 14 '24 | Sale | 108.00 | 650 | 70,200 | 10,016 | May 15 04:57 PM | | Palomarez Javier Alberto | Director | May 13 '24 | Sale | 106.67 | 2,850 | 304,018 | 10,666 | May 15 04:57 PM | | DiMarco Paul | CFO | Oct 02 '23 | Sale | 71.35 | 1,332 | 95,038 | 16,620 | Oct 04 04:29 PM | | Love Timothy Michael | CAO | Oct 02 '23 | Sale | 71.46 | 1,095 | 78,249 | 10,525 | Oct 04 04:30 PM |
|
|
| |
 |
| Market Cap | 39.21B | EPS (ttm) | 0.78 |
| P/E | 71.74 | EPS this Y | 5.01% |
| Forward P/E | 16.29 | EPS next Y | 22.27% |
| PEG | 5.31 | EPS past 5Y | - |
| P/S | 2.33 | EPS next 5Y | 13.50% |
| P/B | 1.58 | EPS Q/Q | -28.24% |
| Dividend | 1.21% | Sales Q/Q | -8.03% |
| Insider Own | 0.16% | Inst Own | 84.03% |
| Insider Trans | -6.89% | Inst Trans | -0.09% |
| Short Float | 1.47% | Earnings | May 01/a |
| Analyst Recom | 1.58 | Target Price | 63.29 |
| Avg Volume | 3.33M | 52W Range | 43.22 - 58.81 |
|
|
|
|
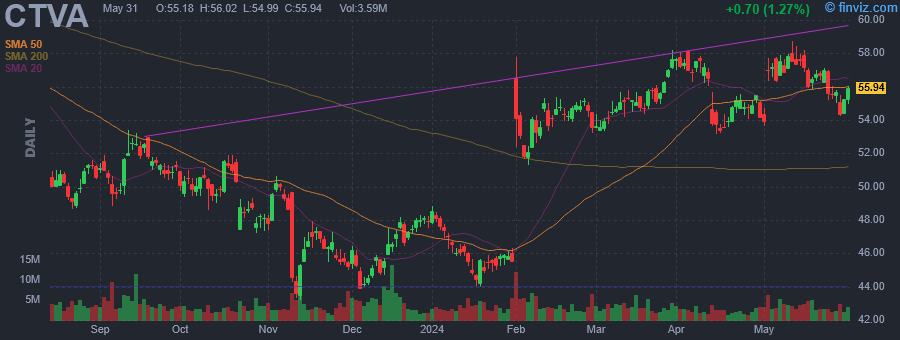
Corteva, Inc. engages in the provision of seed and crop protection solutions, which engages in the agriculture industry and food supply. It operates through the Seed and Crop Protection segments. The Seed segment involves the development and supply of advanced germplasm and traits that produce yield for farms. The Crop Protection segment includes the global agricultural input industry with products for weeds, insects, other pests, and diseases protection, through nitrogen management and seed-applied technologies. The company was founded in 1802 and is headquartered in Indianapolis, IN. |
| Insider Trading |
Relationship |
Date |
Transaction |
Cost |
#Shares |
Value ($) |
#Shares Total |
SEC Form 4 |
| FUERER CORNEL B | SVP, Gen Counsel and Secretary | May 14 '24 | Option Exercise | 31.22 | 39,736 | 1,240,558 | 166,334 | May 16 04:40 PM | | FUERER CORNEL B | SVP, Gen Counsel and Secretary | May 14 '24 | Sale | 57.41 | 39,736 | 2,281,244 | 126,628 | May 16 04:40 PM | | Eathington Samuel R | See Remarks | May 09 '24 | Option Exercise | 33.48 | 31,686 | 1,060,847 | 85,511 | May 13 04:42 PM | | Eathington Samuel R | See Remarks | May 09 '24 | Sale | 57.64 | 31,686 | 1,826,381 | 53,854 | May 13 04:42 PM | | TITUS BRIAN | See Remarks | May 06 '24 | Option Exercise | 41.94 | 2,134 | 89,500 | 25,625 | May 08 04:44 PM |
|
|
|
 |
| Market Cap | 3.57B | EPS (ttm) | -0.94 |
| P/E | - | EPS this Y | 25.18% |
| Forward P/E | - | EPS next Y | 21.17% |
| PEG | - | EPS past 5Y | -12.71% |
| P/S | 5.79 | EPS next 5Y | 27.00% |
| P/B | 7.58 | EPS Q/Q | 23.54% |
| Dividend | - | Sales Q/Q | 26.22% |
| Insider Own | 14.65% | Inst Own | 78.71% |
| Insider Trans | -4.35% | Inst Trans | 15.53% |
| Short Float | 12.54% | Earnings | May 09/a |
| Analyst Recom | 1.89 | Target Price | 29.25 |
| Avg Volume | 3.00M | 52W Range | 8.64 - 34.45 |
|
|
|
May-16-24 04:42PM
|
Sweetgreen Insider Sold Shares Worth $4,695,375, According to a Recent SEC Filing
(MT Newswires) |
|
May-14-24 06:00AM
|
How Sweetgreen has benefitted from its recent success
(Nation's Restaurant News) |
|
May-13-24 03:07PM
|
Sweetgreen beats sad desk salad vibes to soar above fast-food competitors. It can thank fancy foods, high pricesand robots
(Fortune) |
|
May-10-24 05:56PM
|
Fed rates, Tesla Supercharger backpedal, Novavax's 'new chapter': Market Domination
(Yahoo Finance Video) +33.96% |
|
04:27PM
|
Sweetgreen, This Year's Fastest-Rising Restaurant Stock, Is Making Another Big Move
(Investor's Business Daily) |
|
02:27PM
|
Sweetgreen sees 5% same-store sales increases amid rising labor costs in California
(Nation's Restaurant News) |
|
02:24PM
|
Sweetgreen's Shares Surge as RBC Points to Ongoing Comparable Sales Momentum
(MT Newswires) |
|
01:55PM
|
Sweetgreen Is Flying. Its a Growth Stock With Salad Robots.
(Barrons.com) |
|
01:27PM
|
Biden's reported tariffs, Novavax and Sweetgreen shares: Yahoo Finance
(Yahoo Finance Video) |
|
01:23PM
|
Top Stock Movers Now: TSMC, Moderna, Sweetgreen, and More
(Investopedia) |
|
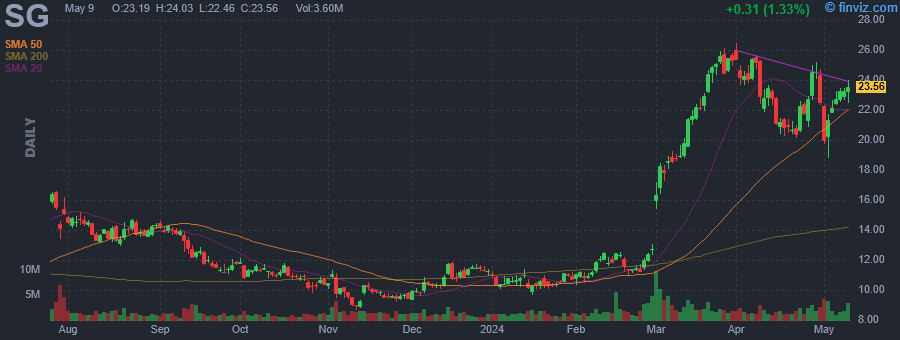
Sweetgreen, Inc. owns and operates a chain of salad restaurants. It offers drinks, sides, local bowls, salads, plates, and warm bowls. The company was founded by Nicolas Jammet, Jonathan Neman and Nathaniel E. Ru in November 2006 and is headquartered in Los Angeles, CA. |
| Insider Trading |
Relationship |
Date |
Transaction |
Cost |
#Shares |
Value ($) |
#Shares Total |
SEC Form 4 |
| Neman Jonathan | CHIEF EXECUTIVE OFFICER | May 15 '24 | Sale | 31.30 | 200,000 | 6,260,500 | 0 | May 16 04:38 PM | | Ru Nathaniel | Chief Brand Officer | May 15 '24 | Sale | 31.30 | 150,000 | 4,695,375 | 0 | May 16 04:36 PM | | Jammet Nicolas | Chief Concept Officer | May 15 '24 | Sale | 31.30 | 150,000 | 4,695,375 | 0 | May 16 04:37 PM | | Reback Mitch | CHIEF FINANCIAL OFFICER | Mar 12 '24 | Sale | 21.01 | 29,475 | 619,270 | 405,584 | Mar 12 06:36 PM | | Neman Jonathan | CHIEF EXECUTIVE OFFICER | Mar 01 '24 | Sale | 16.36 | 58,067 | 950,120 | 0 | Mar 04 07:37 PM |
|
|
|
 |
| Market Cap | 5.42B | EPS (ttm) | 12.29 |
| P/E | 11.16 | EPS this Y | -11.98% |
| Forward P/E | 12.18 | EPS next Y | 5.62% |
| PEG | - | EPS past 5Y | 87.73% |
| P/S | 0.78 | EPS next 5Y | - |
| P/B | 2.40 | EPS Q/Q | 7.32% |
| Dividend | 0.58% | Sales Q/Q | 6.55% |
| Insider Own | 1.00% | Inst Own | 97.83% |
| Insider Trans | -7.05% | Inst Trans | -0.79% |
| Short Float | 2.89% | Earnings | May 06/a |
| Analyst Recom | 2.57 | Target Price | 149.33 |
| Avg Volume | 352.12K | 52W Range | 67.12 - 154.67 |
|
|
|
|
Boise Cascade Co. engages in the manufacture and distribution of engineered wood products (EWP) and plywood. It operates through the Wood Products and Building Materials Distribution (BMD) segments. The Wood Products segment manufactures and sells engineered wood products, plywood, particleboard, studs and ponderosa pine lumber. The Building Materials Distribution segment distributes and sells a broad line of building materials, including engineered wood products, oriented strand board, plywood, lumber, and general line items such as siding, metal products, insulation, roofing, and composite decking. The company was founded in 1957 and is headquartered in Boise, ID. |
| Insider Trading |
Relationship |
Date |
Transaction |
Cost |
#Shares |
Value ($) |
#Shares Total |
SEC Form 4 |
| Strom Jeffrey Robert | EVP, BMD | May 15 '24 | Sale | 140.00 | 3,000 | 420,000 | 40,353 | May 16 04:36 PM | | Twedt Jill | SVP General Counsel & Corp Sec | May 13 '24 | Sale | 135.00 | 1,852 | 250,020 | 37,437 | May 13 04:53 PM | | Strom Jeffrey Robert | EVP, BMD | May 09 '24 | Sale | 135.00 | 2,500 | 337,500 | 43,353 | May 13 04:50 PM | | HOGANS MACK L | Director | Apr 05 '24 | Sale | 149.15 | 0 | 17 | 3,055 | Apr 08 04:55 PM | | Brown Dean Michael | EVP, Wood Products | Mar 04 '24 | Sale | 139.09 | 11,117 | 1,546,239 | 40,237 | Mar 05 06:24 PM |
|
|
|
