 |
| Market Cap | 20.72B | EPS (ttm) | 4.41 |
| P/E | 110.68 | EPS this Y | 18.16% |
| Forward P/E | 46.66 | EPS next Y | 13.47% |
| PEG | 10.44 | EPS past 5Y | 1.09% |
| P/S | 10.40 | EPS next 5Y | 10.60% |
| P/B | 6.85 | EPS Q/Q | 73.02% |
| Dividend | - | Sales Q/Q | 8.58% |
| Insider Own | 0.74% | Inst Own | 95.62% |
| Insider Trans | -33.82% | Inst Trans | 1.19% |
| Short Float | 2.41% | Earnings | Apr 24/a |
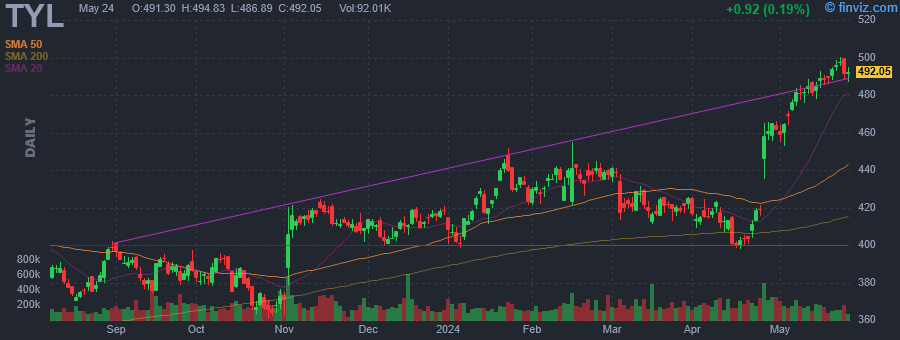
| Analyst Recom | 1.65 | Target Price | 500.67 |
| Avg Volume | 228.65K | 52W Range | 361.16 - 492.57 |
|
|
|
May-16-24 05:56PM
|
Tyler Technologies Insider Sold Shares Worth $5,840,373, According to a Recent SEC Filing
(MT Newswires) |
|
May-15-24 11:32AM
|
Tyler (TYL) Equips FDC With its Digital Payment Solution
(Zacks) |
|
May-14-24 09:17AM
|
Third Largest State Prison System Goes Live with Tyler Technologies Solution Suite
(Business Wire) |
|
May-09-24 04:56PM
|
Tyler Technologies Insider Sold Shares Worth $5,391,260, According to a Recent SEC Filing
(MT Newswires) |
|
May-07-24 04:55PM
|
Tyler Technologies Insider Sold Shares Worth $1,242,107, According to a Recent SEC Filing
(MT Newswires) |
|
09:17AM
|
Tyler Technologies to Provide Complete Public Safety Suite to Evanston, Illinois, Police Department
(Business Wire) |
|
Apr-30-24 01:18PM
|
Tyler Technologies, Inc. (NYSE:TYL) Q1 2024 Earnings Call Transcript
(Insider Monkey) |
|
09:45AM
|
Why Tyler Technologies (TYL) is a Top Growth Stock for the Long-Term
(Zacks) |
|
Apr-29-24 09:17AM
|
Tyler Technologies Announces 2024 Maine App Challenge Winners
(Business Wire) |
|
Apr-26-24 09:59AM
|
DA Davidson Adjusts Tyler Technologies' Price Target to $444 From $434
(MT Newswires) |
|
Tyler Technologies, Inc. engages in the provision of integrated technology and management solutions and services for the public sector with a focus on local governments. It operates through the following segments: Enterprise Software and Platform Technologies. The Enterprise Software segment provides public sector entities with software systems to meet their information technology and automation needs for mission-critical back-office functions such as financial management, courts and justice processes. The Platform Technologies (PT) segment provides public sector entities with software solutions to platform and transformative solutions including digital solutions, payment processing, streamline data processing, and improve operations and workflows. The company was founded in 1966 and is headquartered in Plano, TX. |
| Insider Trading |
Relationship |
Date |
Transaction |
Cost |
#Shares |
Value ($) |
#Shares Total |
SEC Form 4 |
| MARR JOHN S JR | Executive Chair of the Board | May 15 '24 | Option Exercise | 205.66 | 6,000 | 1,233,960 | 12,983 | May 16 05:53 PM | | MARR JOHN S JR | Executive Chair of the Board | May 15 '24 | Sale | 490.19 | 6,000 | 2,941,121 | 6,983 | May 16 05:53 PM | | Pope Daniel M | Director | May 15 '24 | Sale | 491.18 | 520 | 255,414 | 3,493 | May 16 06:01 PM | | MARR JOHN S JR | Executive Chair of the Board | May 14 '24 | Option Exercise | 205.66 | 6,000 | 1,233,960 | 12,983 | May 16 05:53 PM | | MARR JOHN S JR | Executive Chair of the Board | May 14 '24 | Sale | 483.21 | 6,000 | 2,899,252 | 6,983 | May 16 05:53 PM |
|
|
 |
 |
| Market Cap | 1.68B | EPS (ttm) | 5.56 |
| P/E | 11.02 | EPS this Y | 19.60% |
| Forward P/E | 6.26 | EPS next Y | 19.51% |
| PEG | - | EPS past 5Y | 22.45% |
| P/S | 0.75 | EPS next 5Y | - |
| P/B | 1.46 | EPS Q/Q | 5.44% |
| Dividend | - | Sales Q/Q | 26.20% |
| Insider Own | 5.29% | Inst Own | 93.04% |
| Insider Trans | -7.12% | Inst Trans | -2.09% |
| Short Float | 5.09% | Earnings | Apr 23/a |
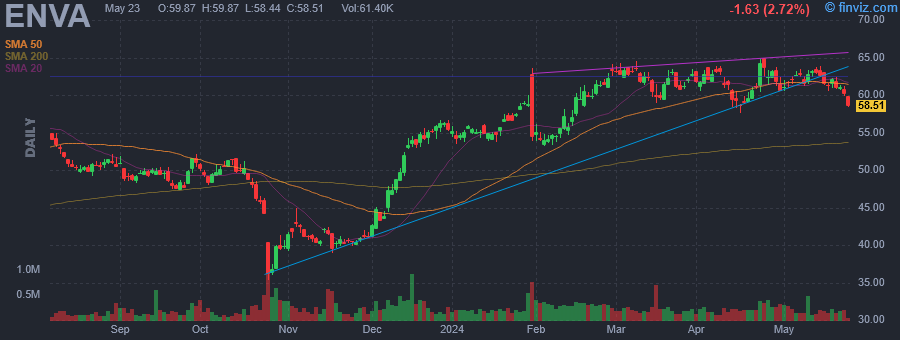
| Analyst Recom | 1.67 | Target Price | 72.33 |
| Avg Volume | 251.57K | 52W Range | 35.30 - 65.00 |
|
|
|
|
Enova International, Inc. engages in the provision of online financial services. Its products and services include short-term consumer loan, line of credit accounts, instalment loans, receivables purchase agreements, credit services organization program, bank program, and decision management platform-as-a-service & analytics-as-a-service. It caters non-prime credit consumers and small businesses in the United States and Brazil. The company was founded by Albert Goldstein and Alexander Goldstein in 2003 and is headquartered in Chicago, IL. |
| Insider Trading |
Relationship |
Date |
Transaction |
Cost |
#Shares |
Value ($) |
#Shares Total |
SEC Form 4 |
| Fisher David | Chief Executive Officer | May 14 '24 | Option Exercise | 23.96 | 20,000 | 479,200 | 481,439 | May 16 06:00 PM | | Fisher David | Chief Executive Officer | May 14 '24 | Sale | 62.73 | 20,000 | 1,254,536 | 461,439 | May 16 06:00 PM | | Fisher David | Chief Executive Officer | May 09 '24 | Option Exercise | 23.96 | 10,000 | 239,600 | 471,439 | May 13 06:00 PM | | Fisher David | Chief Executive Officer | May 09 '24 | Sale | 62.88 | 10,000 | 628,794 | 461,439 | May 13 06:00 PM | | Fisher David | Chief Executive Officer | May 07 '24 | Option Exercise | 22.70 | 20,000 | 453,934 | 473,315 | May 09 04:41 PM |
|
|
|
 |
| Market Cap | 76.66M | EPS (ttm) | -0.80 |
| P/E | - | EPS this Y | - |
| Forward P/E | - | EPS next Y | - |
| PEG | - | EPS past 5Y | - |
| P/S | 3.52 | EPS next 5Y | 10.00% |
| P/B | 1.94 | EPS Q/Q | -6.42% |
| Dividend | - | Sales Q/Q | -4.26% |
| Insider Own | 30.04% | Inst Own | 12.08% |
| Insider Trans | -0.05% | Inst Trans | -1.54% |
| Short Float | 5.34% | Earnings | May 02/a |
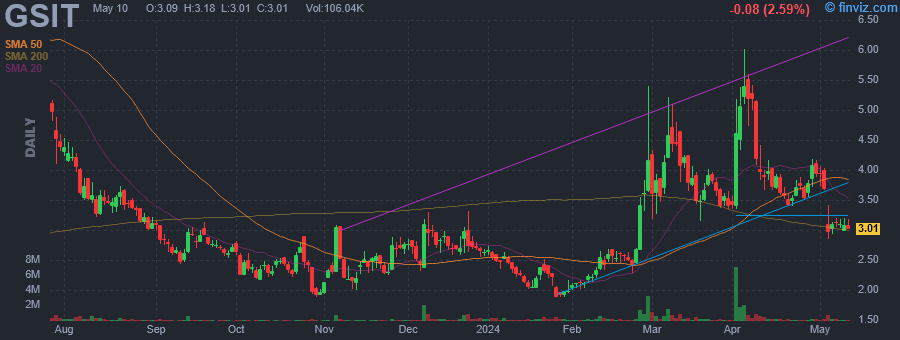
| Analyst Recom | 2.50 | Target Price | 8.00 |
| Avg Volume | 587.60K | 52W Range | 1.88 - 9.80 |
|
|
|
|
GSI Technology, Inc. engages in the design, development and marketing of memory products primarily for the networking, and telecommunications markets. Its product includes Static Random Access Memory, or SRAM, which incorporated in networking and telecommunications equipment, such as routers, switches, wide area network infrastructure equipment, wireless base stations and network access equipment. It also offers services to the ongoing needs of the military, industrial, test and measurement equipment, automotive and medical markets for SRAMs .The company was founded by Lee-Lean Shu and Robert Yau in March 1995 and is headquartered in Sunnyvale, CA. |
| Insider Trading |
Relationship |
Date |
Transaction |
Cost |
#Shares |
Value ($) |
#Shares Total |
SEC Form 4 |
| Yau Robert | Secretary | May 16 '24 | Sale | 3.21 | 235 | 755 | 923,614 | May 16 05:59 PM | | Yau Robert | Secretary | May 15 '24 | Sale | 3.20 | 3,590 | 11,488 | 923,849 | May 16 05:59 PM | | Yau Robert | VP, Engin., Sect. & Director | Aug 30 '23 | Sale | 3.02 | 12,500 | 37,811 | 927,439 | Aug 31 04:13 PM | | Yau Robert | VP, Engin., Sect. & Director | Aug 29 '23 | Sale | 3.27 | 15,263 | 49,855 | 939,939 | Aug 31 04:13 PM | | Yau Robert | VP, Engin., Sect. & Director | Aug 24 '23 | Sale | 3.50 | 18,740 | 65,601 | 955,202 | Aug 28 07:17 PM |
|
|
| |
 |
| Market Cap | 2.39B | EPS (ttm) | -0.18 |
| P/E | - | EPS this Y | 498.81% |
| Forward P/E | 16.63 | EPS next Y | 55.22% |
| PEG | - | EPS past 5Y | 38.49% |
| P/S | 1.53 | EPS next 5Y | - |
| P/B | 1.83 | EPS Q/Q | 58.32% |
| Dividend | - | Sales Q/Q | 13.03% |
| Insider Own | 4.45% | Inst Own | 91.70% |
| Insider Trans | -0.35% | Inst Trans | 5.22% |
| Short Float | 5.99% | Earnings | Apr 25/b |
| Analyst Recom | 1.67 | Target Price | 24.83 |
| Avg Volume | 845.49K | 52W Range | 14.33 - 25.04 |
|
|
|
|
Expro Group Holdings NV engages in the provision of energy services. It operates through the following geographical segments: North and Latin America (NLA), Europe and Sub-Saharan Africa (ESSA), Middle East and North Africa (MENA), and Asia-Pacific (APAC). The company was founded in 1938 and is headquartered in Houston, TX. |
| Insider Trading |
Relationship |
Date |
Transaction |
Cost |
#Shares |
Value ($) |
#Shares Total |
SEC Form 4 |
| Fanning Quinn P | Chief Financial Officer | May 16 '24 | Sale | 21.06 | 17,500 | 368,546 | 92,889 | May 16 05:57 PM | | KEARNEY MICHAEL C | Director | Sep 15 '23 | Sale | 24.16 | 15,400 | 372,093 | 27,633 | Sep 15 04:05 PM | | Drummond Robert Wayne Jr | Director | Sep 15 '23 | Sale | 24.19 | 13,000 | 314,516 | 43,433 | Sep 15 04:07 PM | | OAK HILL ADVISORS LP | 10% Owner | Sep 14 '23 | Sale | 22.95 | 3,000,000 | 68,865,000 | 14,575,891 | Sep 18 04:05 PM | | KEARNEY MICHAEL C | Director | Sep 13 '23 | Sale | 23.84 | 2,600 | 61,984 | 43,033 | Sep 13 05:13 PM |
|
|
|
 |
| Market Cap | 3.14B | EPS (ttm) | -2.00 |
| P/E | - | EPS this Y | -16.56% |
| Forward P/E | - | EPS next Y | 18.79% |
| PEG | - | EPS past 5Y | -2.95% |
| P/S | 202.67 | EPS next 5Y | - |
| P/B | 3.32 | EPS Q/Q | -7.82% |
| Dividend | - | Sales Q/Q | -100.00% |
| Insider Own | 11.64% | Inst Own | 97.73% |
| Insider Trans | -4.79% | Inst Trans | 14.90% |
| Short Float | 15.96% | Earnings | May 07/b |
| Analyst Recom | 1.09 | Target Price | 53.00 |
| Avg Volume | 670.93K | 52W Range | 20.84 - 47.74 |
|
|
|
|
IDEAYA Biosciences, Inc. engages in the research and development of oncology-focused precision medicine. The firm focuses on the targeted therapeutics for patients selected using molecular diagnostics. Its product candidate, IDE196, is a protein kinase C inhibitor for genetically defined cancers having GNAQ or GNA11 gene mutations. The company was founded by Yujiro S. Hata and Jeffrey Hager in June 2015 and is headquartered in South San Francisco, CA. |
| Insider Trading |
Relationship |
Date |
Transaction |
Cost |
#Shares |
Value ($) |
#Shares Total |
SEC Form 4 |
| Hata Yujiro S | President and CEO | May 16 '24 | Option Exercise | 4.31 | 34,433 | 148,406 | 712,320 | May 16 05:51 PM | | Hata Yujiro S | President and CEO | May 16 '24 | Sale | 41.81 | 34,433 | 1,439,754 | 677,887 | May 16 05:51 PM | | Hata Yujiro S | President and CEO | May 15 '24 | Option Exercise | 4.31 | 83,856 | 361,419 | 761,743 | May 16 05:51 PM | | Hata Yujiro S | President and CEO | May 15 '24 | Sale | 42.90 | 83,856 | 3,597,756 | 677,887 | May 16 05:51 PM | | Hata Yujiro S | President and CEO | May 14 '24 | Option Exercise | 4.31 | 56,711 | 244,424 | 734,598 | May 16 05:51 PM |
|
|
| |
 |
| Market Cap | 4.84B | EPS (ttm) | 1.97 |
| P/E | 48.54 | EPS this Y | -0.45% |
| Forward P/E | 46.74 | EPS next Y | 5.74% |
| PEG | 3.24 | EPS past 5Y | 7.81% |
| P/S | 8.93 | EPS next 5Y | 15.00% |
| P/B | 12.92 | EPS Q/Q | 4.03% |
| Dividend | 1.17% | Sales Q/Q | 3.30% |
| Insider Own | 1.51% | Inst Own | 92.34% |
| Insider Trans | -3.22% | Inst Trans | -0.41% |
| Short Float | 2.83% | Earnings | Apr 25/a |
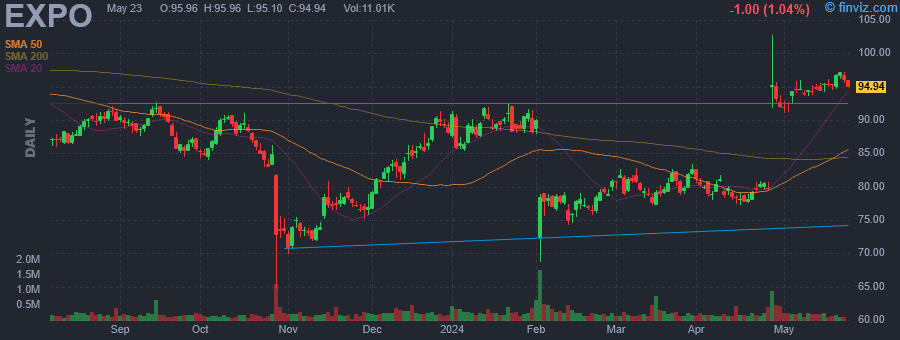
| Analyst Recom | 2.33 | Target Price | 94.00 |
| Avg Volume | 266.28K | 52W Range | 64.61 - 102.72 |
|
|
|
|
Exponent, Inc. is an engineering and scientific consulting company, which provides engineering, scientific, environmental, and health consulting services. It operates through the Engineering and Other Scientific, and Environmental and Health segments. The Engineering and Other Scientific segment includes technical consulting in different practices primarily in engineering. The Environmental and Health segment offers services in environmental, epidemiology, and health risk analysis. The company was founded by Bernard Ross in 1967 and is headquartered in Menlo Park, CA. |
| Insider Trading |
Relationship |
Date |
Transaction |
Cost |
#Shares |
Value ($) |
#Shares Total |
SEC Form 4 |
| James Bradley A | Group Vice President | May 16 '24 | Sale | 95.24 | 2,030 | 193,347 | 0 | May 16 05:47 PM | | Rakow Joseph | Group Vice President | May 07 '24 | Sale | 95.00 | 1,971 | 187,236 | 0 | May 07 02:59 PM | | James Bradley A | Group Vice President | May 06 '24 | Sale | 95.00 | 3,528 | 335,160 | 2,030 | May 06 07:02 PM | | James Bradley A | Group Vice President | May 03 '24 | Sale | 93.77 | 5,545 | 519,958 | 5,558 | May 03 07:34 PM | | James Bradley A | Group Vice President | May 02 '24 | Sale | 93.00 | 13 | 1,209 | 11,103 | May 03 07:34 PM |
|
|
|
 |
| Market Cap | 423.62M | EPS (ttm) | -10.07 |
| P/E | - | EPS this Y | 67.85% |
| Forward P/E | - | EPS next Y | 53.73% |
| PEG | - | EPS past 5Y | - |
| P/S | 1.66 | EPS next 5Y | - |
| P/B | 1.21 | EPS Q/Q | 51.02% |
| Dividend | - | Sales Q/Q | 113.82% |
| Insider Own | 47.81% | Inst Own | 28.64% |
| Insider Trans | -0.15% | Inst Trans | 37.26% |
| Short Float | 8.59% | Earnings | May 02/b |
| Analyst Recom | 1.40 | Target Price | 23.56 |
| Avg Volume | 200.32K | 52W Range | 6.64 - 25.49 |
|
|
|
|
Hippo Holdings, Inc. is a home protection company which provides a new standard of care and protection for homeowners. It makes homes safer and better protected so customers spend less time worrying about the burdens of homeownership and more time enjoying their homes. The company harnesses real-time data, smart home technology, and a growing suite of home services to create an integrated home protection platform. It was founded by Assaf Wand on January 10, 2015 and is headquartered in Palo Alto, CA. |
| Insider Trading |
Relationship |
Date |
Transaction |
Cost |
#Shares |
Value ($) |
#Shares Total |
SEC Form 4 |
| Harry Yuval | Chief Revenue Officer | May 14 '24 | Sale | 18.51 | 1,192 | 22,064 | 143,149 | May 16 05:42 PM | | Harry Yuval | Chief Revenue Officer | Mar 22 '24 | Option Exercise | 6.45 | 13,186 | 85,090 | 160,100 | Mar 26 04:10 PM | | Harry Yuval | Chief Revenue Officer | Mar 22 '24 | Sale | 17.20 | 14,938 | 256,883 | 145,162 | Mar 26 04:10 PM | | Badia Anirudh | Chief Accounting Officer | Mar 11 '24 | Sale | 18.39 | 1,735 | 31,906 | 122,454 | Mar 13 05:19 PM | | NICHOLS JOHN DRAKE | Director | Aug 21 '23 | Buy | 10.83 | 24,141 | 261,336 | 50,000 | Aug 21 05:30 PM |
|
|
| |
 |
| Market Cap | 34.53B | EPS (ttm) | 4.67 |
| P/E | 27.63 | EPS this Y | 7.24% |
| Forward P/E | 15.18 | EPS next Y | 14.66% |
| PEG | 2.26 | EPS past 5Y | 7.04% |
| P/S | 4.60 | EPS next 5Y | 12.20% |
| P/B | 4.60 | EPS Q/Q | 1629.68% |
| Dividend | 0.61% | Sales Q/Q | -3.10% |
| Insider Own | 9.56% | Inst Own | 87.34% |
| Insider Trans | -0.23% | Inst Trans | -0.26% |
| Short Float | 2.58% | Earnings | May 07/a |
| Analyst Recom | 2.00 | Target Price | 149.79 |
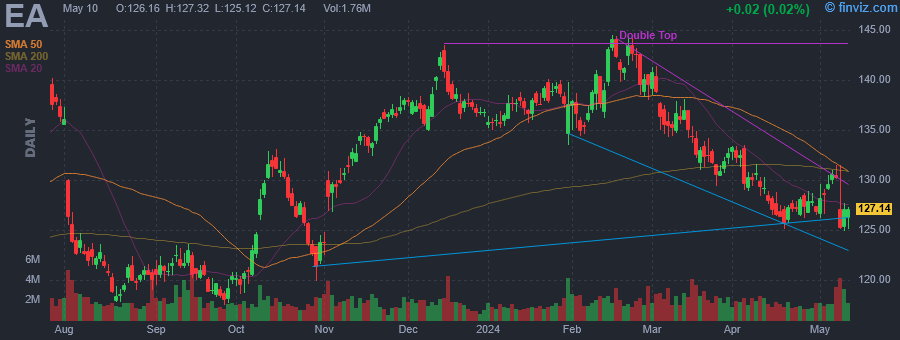
| Avg Volume | 2.15M | 52W Range | 117.47 - 144.53 |
|
|
|
|
Electronic Arts, Inc. engages in the development, marketing, publication, and distribution of games, content, and services for game consoles, PCs, mobile phones, and tablets. The company develops and publishes games and services across various genres, such as sports, first-person shooter, action, role-playing, and simulation primarily under the Battlefield, The Sims, Apex Legends, Anthem, Need for Speed, and Plants v. Zombies brands, and license games, including FIFA, Madden NFL, and Star Wars brands. The firm also provides advertising services and licenses its games to third parties to distribute and host its games. It markets and sells its games and services through digital distribution channels, as well as through retail channels, such as mass-market retailers, electronics specialty stores, and game software specialty stores. The company was founded by William M. Hawkins III and William Gordon in 1982 and is headquartered in Redwood City, CA. |
| Insider Trading |
Relationship |
Date |
Transaction |
Cost |
#Shares |
Value ($) |
#Shares Total |
SEC Form 4 |
| Schatz Jacob J. | EVP, Global Affairs and CLO | May 15 '24 | Sale | 127.15 | 1,000 | 127,150 | 17,426 | May 16 05:36 PM | | Hoskins Roche L Talbott | Director | May 01 '24 | Option Exercise | 128.18 | 183 | 23,457 | 22,306 | May 03 05:58 PM | | Gonzalez Rachel A | Director | May 01 '24 | Option Exercise | 128.18 | 177 | 22,688 | 5,338 | May 03 05:54 PM | | Huber Jeff | Director | May 01 '24 | Option Exercise | 128.18 | 161 | 20,637 | 14,077 | May 03 05:56 PM | | Simonson Richard A | Director | May 01 '24 | Option Exercise | 128.18 | 161 | 20,637 | 61,355 | May 03 06:01 PM |
|
|
|
 |
| Market Cap | 60.56M | EPS (ttm) | -0.59 |
| P/E | - | EPS this Y | 14.25% |
| Forward P/E | - | EPS next Y | 3.87% |
| PEG | - | EPS past 5Y | - |
| P/S | 5.18 | EPS next 5Y | - |
| P/B | 0.80 | EPS Q/Q | 20.22% |
| Dividend | - | Sales Q/Q | 25.05% |
| Insider Own | 34.13% | Inst Own | 11.30% |
| Insider Trans | -0.04% | Inst Trans | -5.16% |
| Short Float | 2.69% | Earnings | May 13/a |
| Analyst Recom | 2.33 | Target Price | 1.27 |
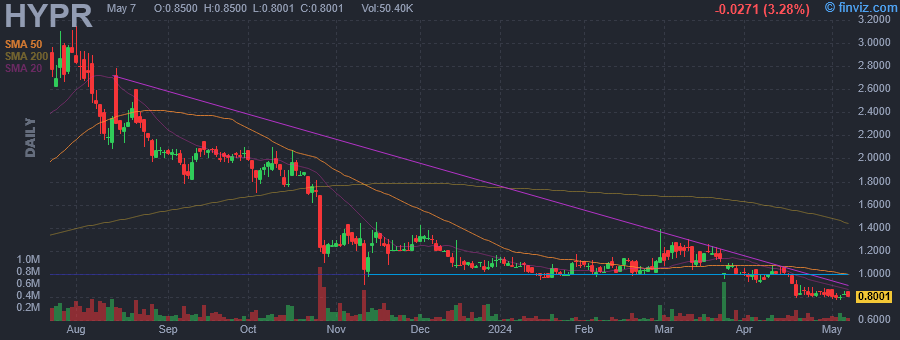
| Avg Volume | 91.10K | 52W Range | 0.76 - 3.28 |
|
|
|
May-14-24 03:04AM
|
Hyperfine Inc (HYPR) Q1 2024 Earnings Call Transcript Highlights: Navigating Growth and Challenges
(GuruFocus.com) +10.14% |
|
May-13-24 08:53PM
|
HYPR Stock Earnings: Hyperfine Beats EPS, Beats Revenue for Q1 2024
(InvestorPlace) |
|
05:15PM
|
Hyperfine, Inc. (HYPR) Reports Q1 Loss, Tops Revenue Estimates
(Zacks) |
|
04:05PM
|
Hyperfine, Inc. Reports First Quarter 2024 Financial Results
(GlobeNewswire) |
|
May-10-24 09:00AM
|
Hyperfine, Inc. to Expand Global Market Reach with Appointment of International Distributors in Key European Markets
(Business Wire) |
|
May-06-24 10:00AM
|
Will Hyperfine, Inc. (HYPR) Report Negative Earnings Next Week? What You Should Know
(Zacks) |
|
Apr-29-24 04:05PM
|
Hyperfine, Inc. to Announce First Quarter 2024 Financial Results on May 13, 2024
(Business Wire) |
|
Apr-25-24 09:35AM
|
Down -19% in 4 Weeks, Here's Why Hyperfine (HYPR) Looks Ripe for a Turnaround
(Zacks) |
|
Apr-23-24 09:00AM
|
Hyperfine, Inc. Takes the Stage at ISMRM with Seventeen Abstracts Assessing the Potential of Using Swoop System Images Across Multiple Care Settings and Clinical Conditions
(Business Wire) |
|
Apr-17-24 09:00AM
|
Leading Institutions Enroll First Alzheimers Patients Receiving Amyloid-Targeting Therapy in CARE PMR Study
(Business Wire) -8.08% |
|
Hyperfine, Inc. is a medical device development company, which engages in providing imaging and monitoring through magnetic resonance imaging to revolutionize healthcare for people. It also develops imaging of health conditions through its Swoop portable magnetic resonance. The company was founded by Jonathan M. Rothberg and Ronald Walsworth on February 25, 2014 and is headquartered in Guilford, CT. |
| Insider Trading |
Relationship |
Date |
Transaction |
Cost |
#Shares |
Value ($) |
#Shares Total |
SEC Form 4 |
| TEISSEYRE THOMAS | Chief Operating Officer | May 16 '24 | Sale | 0.88 | 2,753 | 2,423 | 93,773 | May 16 05:33 PM | | TEISSEYRE THOMAS | Chief Operating Officer | Feb 16 '24 | Sale | 1.11 | 3,230 | 3,585 | 96,526 | Feb 16 04:06 PM | | TEISSEYRE THOMAS | Chief Operating Officer | Nov 16 '23 | Sale | 1.26 | 2,655 | 3,345 | 99,756 | Nov 17 07:34 PM | | TEISSEYRE THOMAS | Chief Operating Officer | Aug 16 '23 | Sale | 2.26 | 2,785 | 6,294 | 102,411 | Aug 17 04:45 PM | | Siddiqui Khan | CMO and Chief Strategy Officer | Aug 16 '23 | Sale | 2.26 | 1,729 | 3,908 | 76,981 | Aug 17 04:44 PM |
|
|
|
 |
| Market Cap | 4.41B | EPS (ttm) | 0.92 |
| P/E | 84.62 | EPS this Y | 5.68% |
| Forward P/E | 35.84 | EPS next Y | 58.92% |
| PEG | 3.44 | EPS past 5Y | -3.58% |
| P/S | 10.25 | EPS next 5Y | 24.57% |
| P/B | 5.97 | EPS Q/Q | -42.04% |
| Dividend | 1.03% | Sales Q/Q | -13.74% |
| Insider Own | 2.08% | Inst Own | 105.29% |
| Insider Trans | -13.20% | Inst Trans | 0.18% |
| Short Float | 6.78% | Earnings | May 07/a |
| Analyst Recom | 2.00 | Target Price | 84.17 |
| Avg Volume | 415.72K | 52W Range | 62.12 - 99.60 |
|
|
|
|
Power Integrations, Inc. designs and develops mixed-signal integrated circuits and other electronic components and circuitry used in high-voltage power conversion. Its products include AC-DC Conversion, LED Drivers, Gate Drivers, Motor Drivers, and Automotive Solutions. The company was founded by Klas Eklund, Art Fury and Steven J. Sharp on March 25, 1988 and is headquartered in San Jose, CA. |
| Insider Trading |
Relationship |
Date |
Transaction |
Cost |
#Shares |
Value ($) |
#Shares Total |
SEC Form 4 |
| NAYYAR SANDEEP | Chief Financial Officer | May 15 '24 | Sale | 78.50 | 5,000 | 392,500 | 85,198 | May 16 05:33 PM | | Bailey Doug | VP Marketing | May 13 '24 | Sale | 77.07 | 6,357 | 489,965 | 94,924 | May 14 07:59 PM | | NAYYAR SANDEEP | Chief Financial Officer | May 13 '24 | Sale | 77.25 | 4,839 | 373,813 | 90,198 | May 14 07:59 PM | | Barsan Radu | VP of Technology, Engineering | May 13 '24 | Sale | 76.56 | 1,837 | 140,649 | 40,945 | May 14 07:59 PM | | BALAKRISHNAN BALU | President and CEO | Apr 02 '24 | Sale | 68.61 | 9,799 | 672,286 | 552,161 | Apr 03 07:54 PM |
|
|
|
