 |
| Market Cap | 11.68B | EPS (ttm) | 25.87 |
| P/E | 4.52 | EPS this Y | 26.03% |
| Forward P/E | 13.52 | EPS next Y | -1.80% |
| PEG | 0.70 | EPS past 5Y | 40.40% |
| P/S | 0.56 | EPS next 5Y | 6.49% |
| P/B | 7.26 | EPS Q/Q | 1485.03% |
| Dividend | - | Sales Q/Q | 6.91% |
| Insider Own | 3.03% | Inst Own | 95.19% |
| Insider Trans | -2.11% | Inst Trans | 2.74% |
| Short Float | 3.93% | Earnings | Apr 30/b |
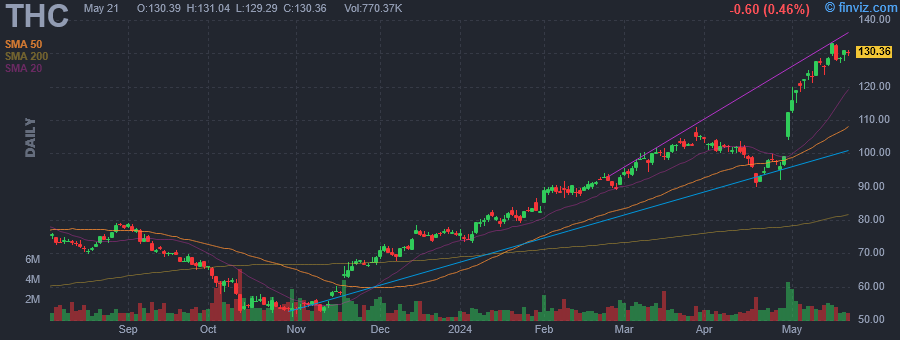
| Analyst Recom | 1.45 | Target Price | 125.78 |
| Avg Volume | 1.24M | 52W Range | 51.04 - 112.30 |
|
|
|
|
Tenet Healthcare Corp. engages in the provision of healthcare services. It operates through the Hospital Operations and Other, and Ambulatory Care segments. The Hospital Operations and Other segment is composed of acute care hospitals, ancillary outpatient facilities, urgent care centers, micro hospitals and physician practices. The Ambulatory Care segment includes the operations of the USPI joint venture and the company's nine Aspen facilities in the United Kingdom. The company was founded in 1969 and is headquartered in Dallas, TX. |
| Insider Trading |
Relationship |
Date |
Transaction |
Cost |
#Shares |
Value ($) |
#Shares Total |
SEC Form 4 |
| MARK RICHARD J | Director | Mar 12 '24 | Sale | 98.98 | 14,000 | 1,385,720 | 33,303 | Mar 14 08:00 PM | | Arbour Paola M | EVP, Chief Information Officer | Mar 06 '24 | Sale | 96.96 | 18,168 | 1,761,569 | 29,803 | Mar 08 08:00 PM | | Arnst Thomas W | EVP, Chief Admin. Officer & GC | Mar 01 '24 | Sale | 94.84 | 17,000 | 1,612,234 | 8,148 | Mar 05 08:00 PM | | Lynch Christopher S. | Director | Feb 15 '24 | Sale | 89.60 | 7,978 | 714,829 | 25,620 | Feb 16 08:15 PM | | FISHER RICHARD W | Director | Feb 14 '24 | Sale | 88.21 | 2,100 | 185,241 | 20,127 | Feb 15 08:00 PM |
|
|
 |
 |
| Market Cap | 3.39B | EPS (ttm) | 0.32 |
| P/E | 194.86 | EPS this Y | 7.23% |
| Forward P/E | 18.90 | EPS next Y | 10.71% |
| PEG | - | EPS past 5Y | - |
| P/S | 2.94 | EPS next 5Y | -4.60% |
| P/B | 2.65 | EPS Q/Q | 864.31% |
| Dividend | - | Sales Q/Q | 12.80% |
| Insider Own | 0.50% | Inst Own | 104.48% |
| Insider Trans | 0.00% | Inst Trans | 1.46% |
| Short Float | 5.76% | Earnings | May 01/b |
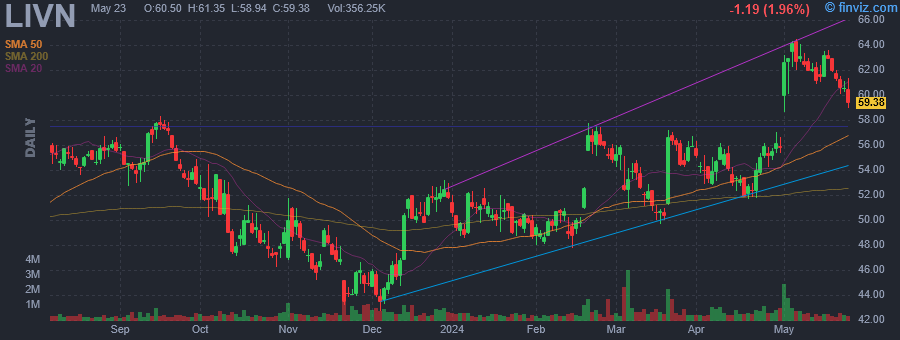
| Analyst Recom | 1.80 | Target Price | 67.56 |
| Avg Volume | 682.27K | 52W Range | 42.75 - 59.86 |
|
|
|
|
LivaNova Plc is a global medical technology company, which engages in the development and delivery of therapeutic solutions for the benefit of patients, healthcare professionals, and healthcare systems. It operates through the following segments: Cardiopulmonary, Neuromodulation, and Advanced Circulatory Support (ACS). The Cardiopulmonary segment is involved in the design, development, manufacture, marketing and selling of cardiopulmonary products. The Neuromodulation segment is associated in the design, development, manufacture, marketing and selling of devices that deliver neuromodulation therapy for treating DRE and DTD. The ACS segment deals with the design, development, manufacture, marketing and selling of temporary life support products. The company was founded in 1987 and is headquartered in London, the United Kingdom. |
| Insider Trading |
Relationship |
Date |
Transaction |
Cost |
#Shares |
Value ($) |
#Shares Total |
SEC Form 4 |
| Hutchinson Michael Damon | Chief Legal Officer | Mar 30 '24 | Option Exercise | 0.00 | 1,478 | 0 | 2,828 | Apr 02 09:18 PM | | Shvartsburg Alex | CFO | Mar 30 '24 | Option Exercise | 0.00 | 14,752 | 0 | 24,133 | Apr 02 09:20 PM | | Hebbelinck Trui | Chief Human Resources Officer | Mar 30 '24 | Option Exercise | 0.00 | 11,779 | 0 | 19,320 | Apr 02 09:21 PM | | Bolton Stephanie | President, Global Epilepsy | Mar 30 '24 | Option Exercise | 0.00 | 7,744 | 0 | 13,205 | Apr 02 09:22 PM | | KOZY WILLIAM A | Chairman and CEO | Feb 29 '24 | Option Exercise | 0.00 | 14,512 | 0 | 32,333 | Mar 04 05:22 PM |
|
|
|
 |
| Market Cap | 337.75M | EPS (ttm) | -1.16 |
| P/E | - | EPS this Y | 13.06% |
| Forward P/E | - | EPS next Y | 3.55% |
| PEG | - | EPS past 5Y | -21.21% |
| P/S | 1089.52 | EPS next 5Y | - |
| P/B | 4.69 | EPS Q/Q | 19.70% |
| Dividend | - | Sales Q/Q | -36.92% |
| Insider Own | 45.15% | Inst Own | 34.80% |
| Insider Trans | -1.67% | Inst Trans | 0.26% |
| Short Float | 1.31% | Earnings | May 08/a |
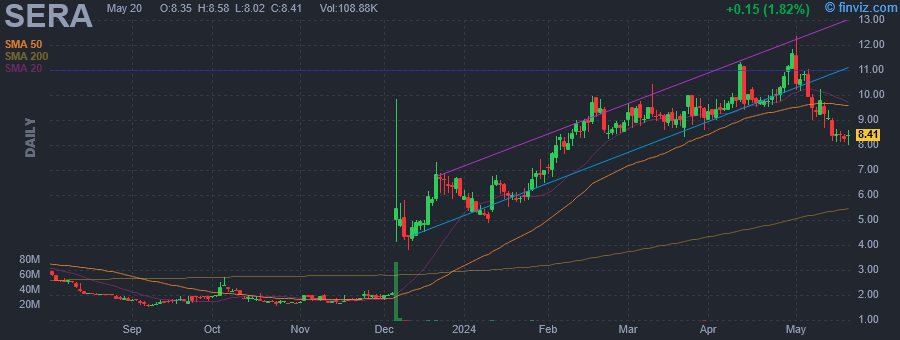
| Analyst Recom | 1.67 | Target Price | 2.75 |
| Avg Volume | 205.82K | 52W Range | 1.52 - 11.82 |
|
|
|
|
Sera Prognostics, Inc. engages in the provision of personalized diagnostics to predict and manage pregnancy complications. It focuses on developing blood tests to predict the risks of preterm birth, preeclampsia and other pregnancy complications. The company was founded by Steven W. Graves, Dennis Farrar and M. Sean Esplin in 2008 and is headquartered in Salt Lake City, UT. |
| Insider Trading |
Relationship |
Date |
Transaction |
Cost |
#Shares |
Value ($) |
#Shares Total |
SEC Form 4 |
| Boniface John J. | Chief Scientific Officer | Mar 28 '24 | Option Exercise | 0.91 | 24,474 | 22,271 | 164,245 | Mar 28 05:56 PM | | Boniface John J. | Chief Scientific Officer | Mar 28 '24 | Sale | 9.04 | 24,474 | 221,245 | 139,771 | Mar 28 05:56 PM | | Boniface John J. | Chief Scientific Officer | Mar 27 '24 | Option Exercise | 0.91 | 48,909 | 44,507 | 188,680 | Mar 28 05:56 PM | | Boniface John J. | Chief Scientific Officer | Mar 27 '24 | Sale | 9.62 | 52,662 | 506,608 | 139,771 | Mar 28 05:56 PM | | Lindgardt Zhenya | Chief Executive Officer | Mar 26 '24 | Sale | 9.37 | 38,899 | 364,484 | 908,104 | Mar 26 08:00 PM |
|
|
| |
 |
| Market Cap | 648.60M | EPS (ttm) | -1.69 |
| P/E | - | EPS this Y | 122.83% |
| Forward P/E | 9.29 | EPS next Y | 15.46% |
| PEG | - | EPS past 5Y | - |
| P/S | 1.66 | EPS next 5Y | 5.00% |
| P/B | 0.58 | EPS Q/Q | -91.96% |
| Dividend | 10.17% | Sales Q/Q | -6.82% |
| Insider Own | 12.40% | Inst Own | 56.28% |
| Insider Trans | 0.00% | Inst Trans | -0.28% |
| Short Float | 3.56% | Earnings | Apr 30/a |
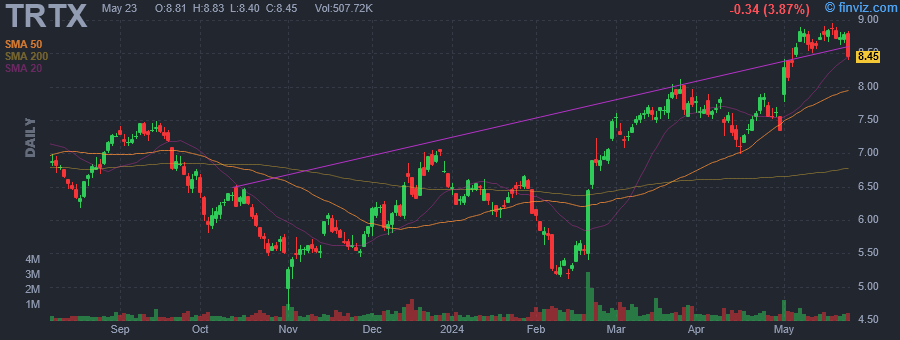
| Analyst Recom | 2.20 | Target Price | 7.70 |
| Avg Volume | 723.43K | 52W Range | 4.64 - 8.12 |
|
|
|
|
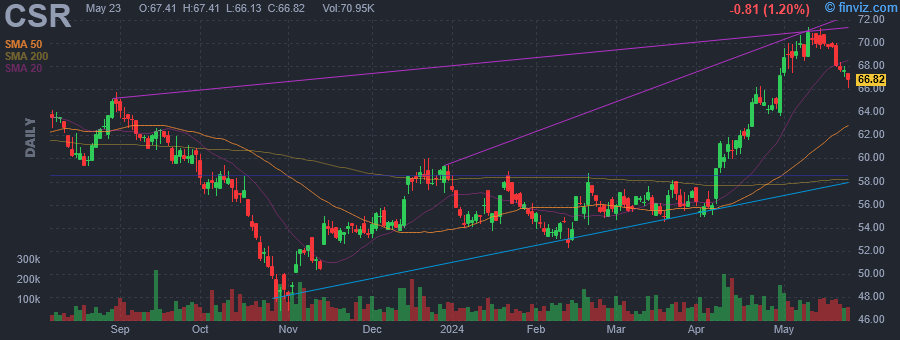
TPG RE Finance Trust, Inc. is a holding company, which engages in the provision of commercial real estate finance services. It originates, acquires, and manages commercial mortgage loans and other commercial real estate-related debt instruments in North America. The company was founded on October 24, 2014 and is headquartered in New York, NY. |
|
|
 |
| Market Cap | 1.83B | EPS (ttm) | 13.06 |
| P/E | 24.50 | EPS this Y | - |
| Forward P/E | - | EPS next Y | - |
| PEG | - | EPS past 5Y | 30.03% |
| P/S | 6.50 | EPS next 5Y | - |
| P/B | 4.64 | EPS Q/Q | 56.68% |
| Dividend | 0.27% | Sales Q/Q | 12.69% |
| Insider Own | 63.49% | Inst Own | 27.41% |
| Insider Trans | -0.22% | Inst Trans | 0.33% |
| Short Float | 2.55% | Earnings | - |
| Analyst Recom | - | Target Price | - |
| Avg Volume | 24.33K | 52W Range | 151.53 - 311.50 |
|
|
|
|
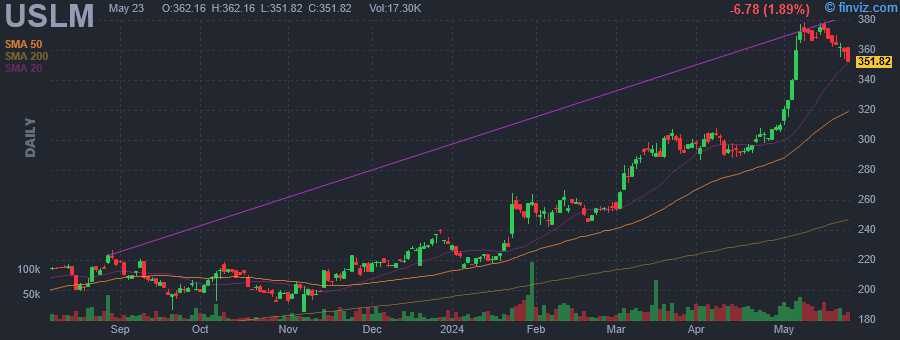
United States Lime & Minerals, Inc. engages in the manufacture and sale of lime and limestone products. Its products include High Calcium Quicklime, Hydrated Lime, Lime Kiln Dust, Lime Slurry, and High Calcium Limestone. The company was founded in 1948 and is headquartered in Dallas, TX. |
| Insider Trading |
Relationship |
Date |
Transaction |
Cost |
#Shares |
Value ($) |
#Shares Total |
SEC Form 4 |
| Duhe Sandra C | Director | Mar 14 '24 | Sale | 291.02 | 427 | 124,266 | 457 | Mar 14 05:04 PM | | BYRNE TIMOTHY W | President & CEO | Feb 15 '24 | Sale | 259.34 | 1,874 | 486,005 | 29,764 | Feb 16 06:29 PM | | BYRNE TIMOTHY W | President & CEO | Feb 14 '24 | Sale | 259.27 | 5,979 | 1,550,151 | 31,638 | Feb 16 06:29 PM | | DOUMET ANTOINE M | Director | Feb 09 '24 | Option Exercise | 54.31 | 2,400 | 130,344 | 17,200 | Feb 12 04:22 PM | | Stone Timothy Wade | Vice President | Nov 09 '23 | Buy | 200.00 | 200 | 40,000 | 862 | Nov 13 02:34 PM |
|
|
| |
 |
| Market Cap | 2.42B | EPS (ttm) | 1.27 |
| P/E | 23.29 | EPS this Y | 2.72% |
| Forward P/E | 14.88 | EPS next Y | 40.21% |
| PEG | 2.33 | EPS past 5Y | 3.52% |
| P/S | 0.81 | EPS next 5Y | 10.00% |
| P/B | 2.33 | EPS Q/Q | 99.71% |
| Dividend | 3.65% | Sales Q/Q | 34.96% |
| Insider Own | 1.35% | Inst Own | 83.26% |
| Insider Trans | -3.51% | Inst Trans | -0.31% |
| Short Float | 2.13% | Earnings | May 01/b |
| Analyst Recom | 2.00 | Target Price | 30.33 |
| Avg Volume | 525.93K | 52W Range | 20.04 - 28.86 |
|
|
|
|
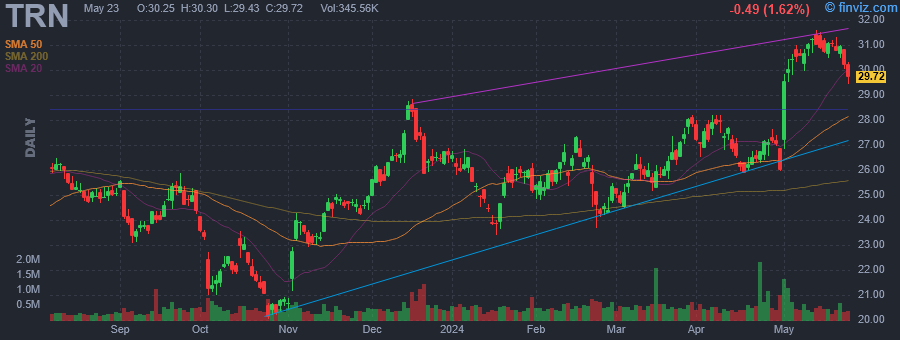
Trinity Industries, Inc. engages in the provision of rail transportation products and services in North America. It operates through the following segments: Railcar Leasing and Management Services Group, Rail Products Group, and Corporate and Other. The Railcar Leasing and Management Services Group segment owns and operates a fleet of railcars and provides third-party fleet leasing, management, and administrative services, as well as other railcar logistics products and services. The Rail Products Group segment manufactures and sells railcars and related parts and components and provides railcar maintenance and modification services. The company was founded in 1933 and is headquartered in Dallas, TX. |
| Insider Trading |
Relationship |
Date |
Transaction |
Cost |
#Shares |
Value ($) |
#Shares Total |
SEC Form 4 |
| Marchetto Eric R | EVP & CFO | Mar 27 '24 | Sale | 28.00 | 9,781 | 273,868 | 233,704 | Mar 29 04:02 PM | | Poet Kevin | EVP Operations & Support Svcs | Mar 06 '24 | Sale | 25.45 | 6,000 | 152,700 | 30,718 | Mar 08 04:16 PM | | Marchetto Eric R | EVP & CFO | Dec 13 '23 | Sale | 27.00 | 11,863 | 320,301 | 250,402 | Dec 14 05:05 PM | | Mitchell Gregory B | EVP & Chief Commercial Officer | Nov 08 '23 | Sale | 23.17 | 12,536 | 290,459 | 127,714 | Nov 13 05:05 PM | | Marchetto Eric R | EVP & CFO | Sep 28 '23 | Sale | 25.00 | 11,765 | 294,125 | 262,265 | Sep 29 04:54 PM |
|
|
|
 |
| Market Cap | 134.43M | EPS (ttm) | 0.13 |
| P/E | 22.45 | EPS this Y | - |
| Forward P/E | - | EPS next Y | - |
| PEG | - | EPS past 5Y | - |
| P/S | 1.14 | EPS next 5Y | - |
| P/B | 0.98 | EPS Q/Q | -71.13% |
| Dividend | - | Sales Q/Q | -1.38% |
| Insider Own | 39.94% | Inst Own | 12.67% |
| Insider Trans | 0.00% | Inst Trans | - |
| Short Float | 0.21% | Earnings | - |
| Analyst Recom | 1.00 | Target Price | 1.37 |
| Avg Volume | 85.40K | 52W Range | 0.99 - 3.03 |
|
|
|
|
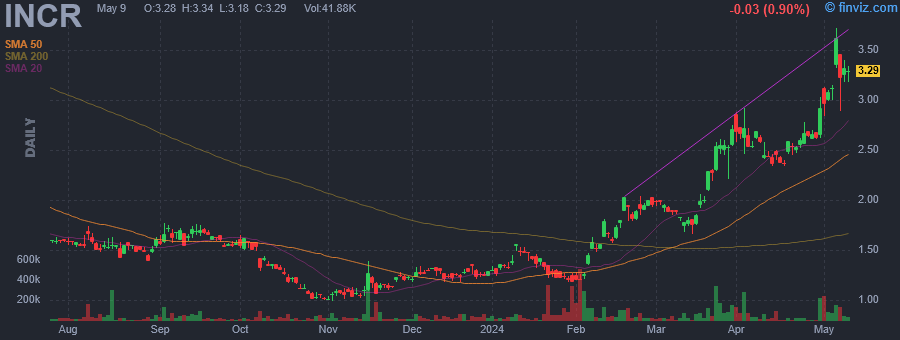
InterCure Ltd. engages in the business of medical cannabis and biomedicine. It operates through the Investments in Biomed Portfolio Companies and Investments in Medical Cannabis Companies segments. The company was founded by Benjamin Gavish and Erez Gavish on November 20, 1994 and is headquartered in Herzliya, Israel. |
|
| |
 |
| Market Cap | 43.75M | EPS (ttm) | -0.35 |
| P/E | - | EPS this Y | - |
| Forward P/E | - | EPS next Y | - |
| PEG | - | EPS past 5Y | - |
| P/S | 2.40 | EPS next 5Y | - |
| P/B | 1.27 | EPS Q/Q | -145.50% |
| Dividend | - | Sales Q/Q | 7.65% |
| Insider Own | 29.22% | Inst Own | 24.49% |
| Insider Trans | 0.63% | Inst Trans | -1.22% |
| Short Float | 0.22% | Earnings | May 02/a |
| Analyst Recom | 1.00 | Target Price | 3.00 |
| Avg Volume | 56.50K | 52W Range | 1.05 - 2.10 |
|
|
|
|
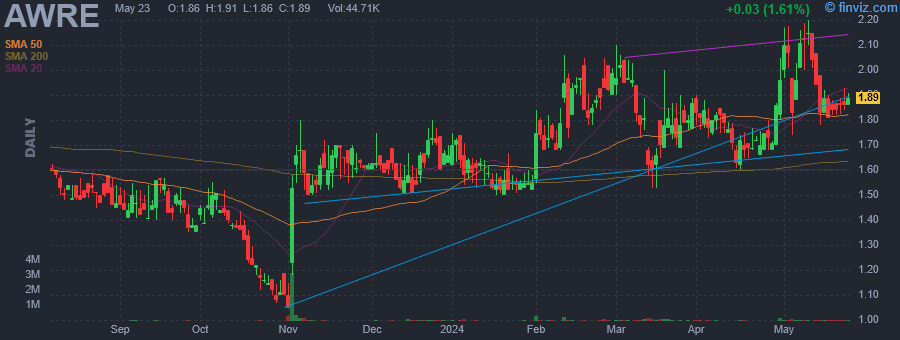
Aware, Inc. is a biometrics software and services company. The firm's products are used in government and commercial biometrics systems, which are capable of determining or verifying an individual's identity. It also provides interoperable, standards-compliant, field-proven biometric functionality, used to capture, verify, format, compress and decompress biometric images, as well as aggregate, analyze, process, and transport those images within biometric systems. The company was founded in 1986 and is headquartered in Burlington, MA. |
| Insider Trading |
Relationship |
Date |
Transaction |
Cost |
#Shares |
Value ($) |
#Shares Total |
SEC Form 4 |
| Eckel Robert A | CEO & President | Mar 15 '24 | Buy | 1.67 | 13,735 | 22,881 | 342,232 | Mar 18 06:49 PM | | Traverse David K | Principal Financial Officer | Mar 14 '24 | Buy | 1.58 | 4,907 | 7,753 | 25,458 | Mar 15 05:00 PM | | Johnstone Brent P | Director | Jan 02 '24 | Option Exercise | 0.00 | 20,907 | 0 | 180,476 | Jan 03 05:45 PM | | Evee Gary | Director | Jan 02 '24 | Option Exercise | 0.00 | 14,620 | 0 | 50,557 | Jan 03 05:44 PM | | Faubert Peter R. | Director | Jan 02 '24 | Option Exercise | 0.00 | 15,059 | 0 | 65,023 | Jan 03 05:45 PM |
|
|
|
 |
| Market Cap | 1.03B | EPS (ttm) | -0.84 |
| P/E | - | EPS this Y | -141.06% |
| Forward P/E | - | EPS next Y | 30.71% |
| PEG | - | EPS past 5Y | - |
| P/S | 3.84 | EPS next 5Y | 6.00% |
| P/B | 1.74 | EPS Q/Q | -116.16% |
| Dividend | 4.33% | Sales Q/Q | -50.08% |
| Insider Own | 1.15% | Inst Own | 80.31% |
| Insider Trans | 0.29% | Inst Trans | -0.43% |
| Short Float | 1.40% | Earnings | Apr 29/a |
| Analyst Recom | 2.11 | Target Price | 63.12 |
| Avg Volume | 87.40K | 52W Range | 46.74 - 67.87 |
|
|
|
|
Centerspace is a real estate investment trust, which engages in the business of owning, managing, acquiring, developing, and redeveloping apartment communities. It operates under the Multifamily and All Other segments. The All Other segment includes non-multifamily properties and non-multifamily components of mixed-use properties. The company was founded on July 31, 1970 and is headquartered in Minot, ND. |
| Insider Trading |
Relationship |
Date |
Transaction |
Cost |
#Shares |
Value ($) |
#Shares Total |
SEC Form 4 |
| Schissel John A | Director | Mar 11 '24 | Buy | 56.40 | 500 | 28,198 | 9,522 | Mar 12 04:11 PM | | Jones-Tyson Rodney | Director | Jan 17 '24 | Option Exercise | 0.00 | 593 | 0 | 2,044 | Jan 17 06:32 PM | | Olson Anne | President, CEO & Secretary | Jan 01 '24 | Option Exercise | 0.00 | 1,921 | 0 | 16,808 | Jan 03 06:40 PM | | Patel Bhairav | EVP and CFO | Jan 01 '24 | Option Exercise | 0.00 | 1,270 | 0 | 1,690 | Jan 03 06:40 PM | | CAIRA JEFFREY | Director | May 17 '23 | Option Exercise | 0.00 | 856 | 0 | 18,922 | May 18 03:34 PM |
|
|
|
 |
| Market Cap | 1.34B | EPS (ttm) | -0.84 |
| P/E | - | EPS this Y | 16.07% |
| Forward P/E | - | EPS next Y | 17.02% |
| PEG | - | EPS past 5Y | 21.51% |
| P/S | 0.44 | EPS next 5Y | 10.00% |
| P/B | 3.29 | EPS Q/Q | -218.93% |
| Dividend | - | Sales Q/Q | 7.69% |
| Insider Own | 11.20% | Inst Own | 98.38% |
| Insider Trans | -0.07% | Inst Trans | 0.46% |
| Short Float | 11.13% | Earnings | May 07/a |
| Analyst Recom | 3.00 | Target Price | 7.00 |
| Avg Volume | 1.95M | 52W Range | 3.33 - 7.07 |
|
|
|
|
Brookdale Senior Living, Inc. engages in the operation of senior living communities. The firm manages independent living, assisted living and dementia-care communities and continuing care retirement centers. It operates through the following segments: Independent Living Assisted Living & Memory Care, CCRCs, Health Care Services and Management Services. The Independent Living segment is primarily designed for middle to upper income seniors who desire an upscale residential environment providing the highest quality of service. The Assisted Living & Memory Care segment offer housing and 24-hour assistance with ADLs to mid-acuity frail and elderly residents. The CCRCs segment offers a variety of living arrangements and services to accommodate all levels of physical ability and health. The Healthcare Services segment provides home health, hospice and outpatient therapy services, as well as education and wellness programs, to residents of many communities and to seniors living outside communities. The Management Services segment composes of communities operated by the company pursuant to management agreements. The company was founded in 1978 and is headquartered in Brentwood, TN. |
| Insider Trading |
Relationship |
Date |
Transaction |
Cost |
#Shares |
Value ($) |
#Shares Total |
SEC Form 4 |
| HICKS GEORGE T | EVP & Treasurer | Mar 06 '24 | Buy | 5.50 | 9,140 | 50,307 | 351,883 | Mar 06 04:27 PM | | BUMSTEAD FRANK M | Director | Feb 23 '24 | Buy | 5.36 | 1,000 | 5,360 | 500,052 | Feb 23 04:28 PM | | BROMLEY MARCUS E | Director | Dec 06 '23 | Sale | 5.30 | 3,995 | 21,158 | 147,001 | Dec 06 05:41 PM | | BROMLEY MARCUS E | Director | Dec 05 '23 | Sale | 5.26 | 10,000 | 52,612 | 150,996 | Dec 06 05:41 PM | | BROMLEY MARCUS E | Director | Dec 04 '23 | Sale | 5.38 | 10,000 | 53,751 | 160,996 | Dec 06 05:41 PM |
|
|
|
