 |
| Market Cap | 1.88B | EPS (ttm) | 1.23 |
| P/E | 11.98 | EPS this Y | -1.77% |
| Forward P/E | 10.37 | EPS next Y | -8.67% |
| PEG | - | EPS past 5Y | - |
| P/S | 1.60 | EPS next 5Y | - |
| P/B | 1.21 | EPS Q/Q | -88.40% |
| Dividend | 1.09% | Sales Q/Q | 28.58% |
| Insider Own | 83.87% | Inst Own | 19.20% |
| Insider Trans | 0.29% | Inst Trans | 8.66% |
| Short Float | 20.14% | Earnings | May 08/a |
| Analyst Recom | 2.50 | Target Price | 20.62 |
| Avg Volume | 325.76K | 52W Range | 10.44 - 18.42 |
|
|
| May-23-24 | Upgrade |
Truist |
Sell → Hold |
$10 → $13 |
|
|
|
HighPeak Energy, Inc. is an independent oil and natural gas company, which engages in the acquisition, development and production of oil, natural gas and NGL reserves. The company's assets are primarily located in the Howard County area of the Midland Basin. The company was founded on October 29, 2019 and is headquartered in Fort Worth, TX. |
| Insider Trading |
Relationship |
Date |
Transaction |
Cost |
#Shares |
Value ($) |
#Shares Total |
SEC Form 4 |
| Hollis Michael L. | President | Nov 18 '33 | Buy | 22.42 | 9,256 | 207,520 | 249,887 | Nov 18 06:48 PM | | HIGHTOWER JACK | Chief Executive Officer | Dec 29 '23 | Buy | 14.69 | 50,000 | 734,340 | 4,672,863 | Dec 29 02:49 PM | | HIGHTOWER JACK | Chief Executive Officer | Dec 28 '23 | Buy | 14.78 | 104,715 | 1,547,918 | 4,622,863 | Dec 29 02:49 PM | | HIGHTOWER JACK | Chief Executive Officer | Dec 27 '23 | Buy | 15.00 | 9,315 | 139,697 | 4,518,148 | Dec 29 02:49 PM | | HIGHTOWER JACK | Chief Executive Officer | Dec 22 '23 | Buy | 14.47 | 100,000 | 1,447,120 | 4,508,833 | Dec 26 07:08 PM |
|
|
 |
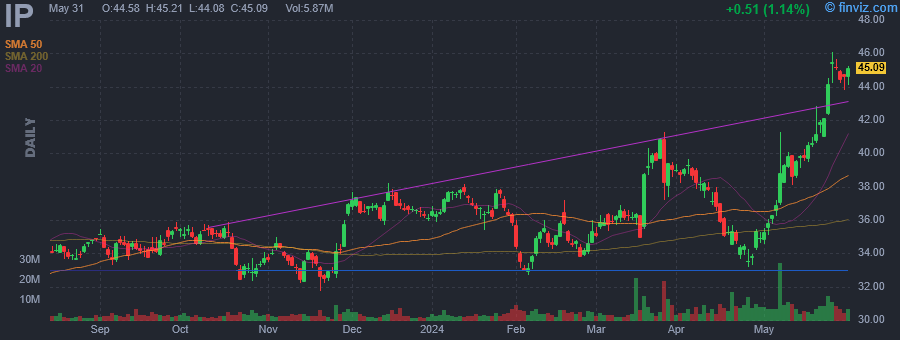 |
| Market Cap | 15.34B | EPS (ttm) | 0.53 |
| P/E | 82.98 | EPS this Y | -8.18% |
| Forward P/E | 15.72 | EPS next Y | 41.68% |
| PEG | 4.32 | EPS past 5Y | -29.18% |
| P/S | 0.83 | EPS next 5Y | 19.20% |
| P/B | 1.86 | EPS Q/Q | -66.99% |
| Dividend | 4.18% | Sales Q/Q | -7.99% |
| Insider Own | 2.22% | Inst Own | 100.65% |
| Insider Trans | -0.19% | Inst Trans | -3.54% |
| Short Float | 4.86% | Earnings | Apr 25/b |
| Analyst Recom | 2.36 | Target Price | 42.38 |
| Avg Volume | 6.51M | 52W Range | 29.00 - 42.82 |
|
|
| May-23-24 | Upgrade |
Jefferies |
Hold → Buy |
$38 → $57 |
|
|
|
International Paper Company. The Group's principal activity is to distribute, print, pack, graphic art, maintain and industrial products through its branches. It operates in five segments: Distribution, Printing Papers, Industrial Packaging, Consumer Packaging and Forest Products. Distribution segment provide distribution services and products to a number of customer markets. Printing Papers segment include uncoated and coated papers, market pulp and uncoated bristols. Industrial Packaging manufactures containerboard which is converted to corrugated boxes and other packages. Consumer Packaging produces coated paperboard used in packaging applications for everyday products such as food, cosmetics, pharmaceuticals, computer software and tobacco products. Forest Products segment is forestlands owned that are likely to be sold to investors and other buyers. It operates in North America, Europe, Latin America, Russia, Asia and North Africa. |
| Insider Trading |
Relationship |
Date |
Transaction |
Cost |
#Shares |
Value ($) |
#Shares Total |
SEC Form 4 |
| SULLIVAN KATHRYN D | Director | May 15 '24 | Sale | 39.91 | 600 | 23,946 | 46,079 | May 16 11:01 AM | | SULLIVAN KATHRYN D | Director | Apr 30 '24 | Sale | 34.94 | 600 | 20,964 | 40,588 | May 01 09:30 AM | | SULLIVAN KATHRYN D | Director | Apr 15 '24 | Sale | 37.78 | 600 | 22,668 | 41,188 | Apr 16 10:39 AM | | SULLIVAN KATHRYN D | Director | Apr 01 '24 | Sale | 38.92 | 600 | 23,352 | 41,788 | Apr 02 11:18 AM | | SULLIVAN KATHRYN D | Director | Mar 15 '24 | Sale | 36.09 | 600 | 21,654 | 41,984 | Mar 18 12:57 PM |
|
|
|
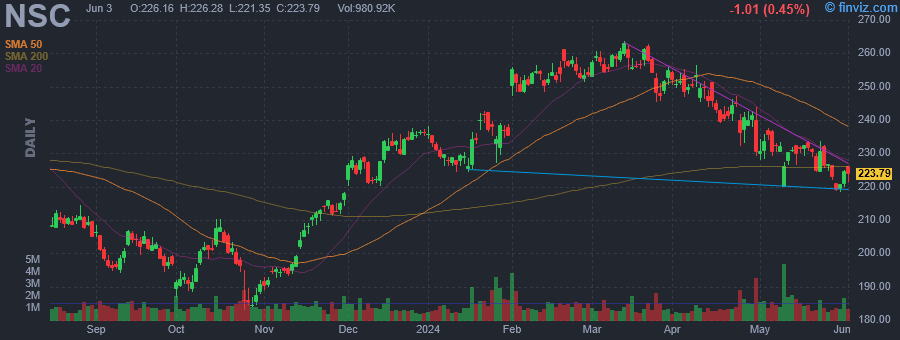 |
| Market Cap | 51.12B | EPS (ttm) | 6.22 |
| P/E | 36.37 | EPS this Y | 0.76% |
| Forward P/E | 16.34 | EPS next Y | 17.09% |
| PEG | 4.92 | EPS past 5Y | -3.35% |
| P/S | 4.25 | EPS next 5Y | 7.39% |
| P/B | 4.08 | EPS Q/Q | -88.74% |
| Dividend | 2.40% | Sales Q/Q | -4.09% |
| Insider Own | 0.05% | Inst Own | 75.94% |
| Insider Trans | -6.87% | Inst Trans | -1.32% |
| Short Float | 0.63% | Earnings | Apr 24/b |
| Analyst Recom | 2.04 | Target Price | 271.36 |
| Avg Volume | 1.31M | 52W Range | 183.09 - 263.66 |
|
|
| May-23-24 | Upgrade |
RBC Capital Mkts |
Sector Perform → Outperform |
$270 |
|
|
|
Norfolk Southern Corp. is a transportation company, which engages in the rail transportation of raw materials, intermediate products, and finished goods. The company also transports overseas freight through several Atlantic and Gulf Coast ports. Its services include property leases and sales, wire line or pipeline and fiber optics projects, access property, managing private crossings, promoting businesses with signboards, and natural resource management. The company was founded on July 23, 1980 and is headquartered in Atlanta, GA. |
| Insider Trading |
Relationship |
Date |
Transaction |
Cost |
#Shares |
Value ($) |
#Shares Total |
SEC Form 4 |
| Elkins Claude E | EVP & Chief Marketing Officer | May 10 '24 | Option Exercise | 99.19 | 4,140 | 410,629 | 8,329 | May 14 08:23 PM | | Elkins Claude E | EVP & Chief Marketing Officer | May 10 '24 | Sale | 228.43 | 8,329 | 1,902,618 | 0 | May 14 08:23 PM | | Moore Claiborne L | Vice President & Controller | Apr 28 '24 | Option Exercise | 0.00 | 100 | 0 | 3,426 | Apr 30 06:35 PM | | Duncan Paul B | EVP & Chief Operating Officer | Mar 02 '24 | Option Exercise | 0.00 | 1,505 | 0 | 3,261 | Mar 04 08:46 PM | | Adams Ann A | EVP & Chief Transform. Officer | Jan 30 '24 | Option Exercise | 0.00 | 545 | 0 | 21,602 | Feb 01 09:37 PM |
|
|
| |
 |
| Market Cap | 26.02B | EPS (ttm) | -21.97 |
| P/E | - | EPS this Y | 19.12% |
| Forward P/E | 19.77 | EPS next Y | 162.38% |
| PEG | - | EPS past 5Y | - |
| P/S | 4.86 | EPS next 5Y | 63.60% |
| P/B | 4.59 | EPS Q/Q | -370.37% |
| Dividend | - | Sales Q/Q | -3.24% |
| Insider Own | 8.03% | Inst Own | 91.45% |
| Insider Trans | -1.55% | Inst Trans | 1.97% |
| Short Float | 5.40% | Earnings | May 16/a |
| Analyst Recom | 1.55 | Target Price | 175.12 |
| Avg Volume | 1.76M | 52W Range | 130.34 - 171.59 |
|
|
| May-23-24 | Upgrade |
BofA Securities |
Neutral → Buy |
$160 → $185 |
|
|
|
Take-Two Interactive Software, Inc. engages in the development, publishing, and marketing of interactive software games. Its products are designed for console systems, handheld gaming systems, and personal computers, including smart phones and tablets, and are delivered through physical retail, digital download, online platforms, and cloud streaming services. The company was founded by Ryan A. Brant in 1993 and is headquartered in New York, NY. |
| Insider Trading |
Relationship |
Date |
Transaction |
Cost |
#Shares |
Value ($) |
#Shares Total |
SEC Form 4 |
| Moses Jon J | Director | May 21 '24 | Sale | 151.25 | 2,500 | 378,138 | 21,981 | May 22 05:03 PM | | ZELNICK STRAUSS | Chairman, CEO | Apr 12 '24 | Sale | 148.54 | 90,851 | 13,494,773 | 87,286 | Apr 16 04:44 PM | | Slatoff Karl | President | Apr 12 '24 | Sale | 148.54 | 90,851 | 13,494,773 | 87,286 | Apr 16 04:47 PM | | Sheresky Michael | Director | Feb 15 '24 | Sale | 155.72 | 260 | 40,487 | 63,645 | Feb 20 05:03 PM | | Goldstein Lainie | Chief Financial Officer | Dec 06 '23 | Sale | 158.01 | 20,701 | 3,270,957 | 322,133 | Dec 08 04:37 PM |
|
|
|
 |
| Market Cap | 136.04B | EPS (ttm) | 2.77 |
| P/E | 19.63 | EPS this Y | 5.03% |
| Forward P/E | 17.25 | EPS next Y | 7.25% |
| PEG | 3.78 | EPS past 5Y | -7.51% |
| P/S | 2.11 | EPS next 5Y | 5.20% |
| P/B | 6.79 | EPS Q/Q | -32.07% |
| Dividend | 3.53% | Sales Q/Q | 2.28% |
| Insider Own | 0.00% | Inst Own | 9.96% |
| Insider Trans | - | Inst Trans | 6.53% |
| Short Float | 0.07% | Earnings | Feb 08/b |
| Analyst Recom | 2.36 | Target Price | 55.49 |
| Avg Volume | 2.81M | 52W Range | 46.16 - 54.86 |
|
|
| May-23-24 | Upgrade |
JP Morgan |
Underweight → Overweight |
|
|
|
|
Unilever Plc engages in the manufacture and sale of consumer goods. It operates through the following segments: Beauty & Wellbeing, Personal Care, Home Care, Nutrition, and Ice Cream. The Beauty & Wellbeing segment offers hair care, skin care, and prestige beauty and health & wellbeing. The Personal Care segment consists of sales of skin cleansing, deodorant, and oral care products. The Home Care segment comprises of sales of fabric care and a wide range of cleaning products. The Nutrition segment refers to sales of scratch cooking aids, dressings, and tea products. The Ice Cream segment covers primarily ice cream products. The company was founded by Antonius Johannes Jurgens, Samuel van den Bergh, and William Hulme Lever on January 1, 1930 and is headquartered in London, the United Kingdom. |
|
| |
 |
| Market Cap | 10.54B | EPS (ttm) | 7.46 |
| P/E | 12.62 | EPS this Y | 38.01% |
| Forward P/E | 15.62 | EPS next Y | 6.42% |
| PEG | 1.60 | EPS past 5Y | 3.40% |
| P/S | 1.51 | EPS next 5Y | 7.90% |
| P/B | - | EPS Q/Q | 6642.42% |
| Dividend | 1.02% | Sales Q/Q | 30.85% |
| Insider Own | 15.28% | Inst Own | 61.25% |
| Insider Trans | -0.38% | Inst Trans | -0.78% |
| Short Float | 3.95% | Earnings | May 07/a |
| Analyst Recom | 1.65 | Target Price | 125.51 |
| Avg Volume | 1.63M | 52W Range | 81.65 - 112.25 |
|
|
| May-23-24 | Upgrade |
Argus |
Hold → Buy |
$110 |
|
|
|
Wynn Resorts Ltd. is a holding company, which engages in the design, development, and operation of destination casino resorts. It operates through the following segments: Wynn Palace, Wynn Macau, Las Vegas Operations, Wynn Interactive and Encore Boston Harbor. The company was founded by Stephen Alan Wynn, Elaine P. Wynn, and Kazuo Okada in 2002 and is headquartered in Las Vegas, NV. |
| Insider Trading |
Relationship |
Date |
Transaction |
Cost |
#Shares |
Value ($) |
#Shares Total |
SEC Form 4 |
| CAMERON-DOE JULIE | CFO | Feb 09 '24 | Option Exercise | 58.85 | 6,383 | 375,640 | 84,533 | Feb 12 08:06 PM | | CAMERON-DOE JULIE | CFO | Feb 09 '24 | Sale | 105.27 | 6,383 | 671,938 | 78,150 | Feb 12 08:06 PM | | Mulroy Patricia | Director | Feb 09 '24 | Sale | 105.17 | 960 | 100,963 | 522 | Feb 12 08:08 PM | | Billings Craig Scott | CEO | Feb 08 '24 | Option Exercise | 58.85 | 10,902 | 641,583 | 327,139 | Feb 12 08:04 PM | | Billings Craig Scott | CEO | Feb 08 '24 | Sale | 108.00 | 19,235 | 2,077,380 | 307,904 | Feb 12 08:04 PM |
|
|
|
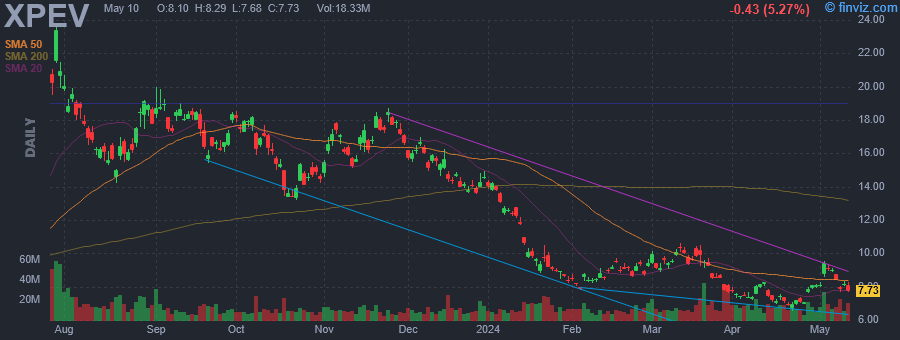 |
| Market Cap | 6.23B | EPS (ttm) | -1.49 |
| P/E | - | EPS this Y | 53.61% |
| Forward P/E | - | EPS next Y | 47.36% |
| PEG | - | EPS past 5Y | -33.39% |
| P/S | 1.35 | EPS next 5Y | -5.74% |
| P/B | 1.57 | EPS Q/Q | 49.11% |
| Dividend | - | Sales Q/Q | 54.53% |
| Insider Own | 1.34% | Inst Own | 14.24% |
| Insider Trans | 0.00% | Inst Trans | -0.96% |
| Short Float | 6.91% | Earnings | May 21/b |
| Analyst Recom | 2.00 | Target Price | 10.71 |
| Avg Volume | 15.69M | 52W Range | 6.55 - 23.62 |
|
|
| May-23-24 | Upgrade |
Daiwa Securities |
Neutral → Buy |
$11 |
|
|
|
XPeng, Inc. designs, develops, manufactures, and markets smart electric vehicles. it's products are environmentally friendly vehicles, namely an SUV (the G3) and a four-door sports sedan (the P7). The company develops driver-assistance system technology and in-car intelligent operating system, as well as core vehicle systems including powertrain and the electrical/electronic architecture. It also provides a range of services to the clients, including supercharging service, maintenance service, ride-hailing service and vehicle leasing service. The company was founded by Xiao Peng He, Heng Xia, and Tao He in 2015 and is headquartered in Guangzhou, China. |
|
| |
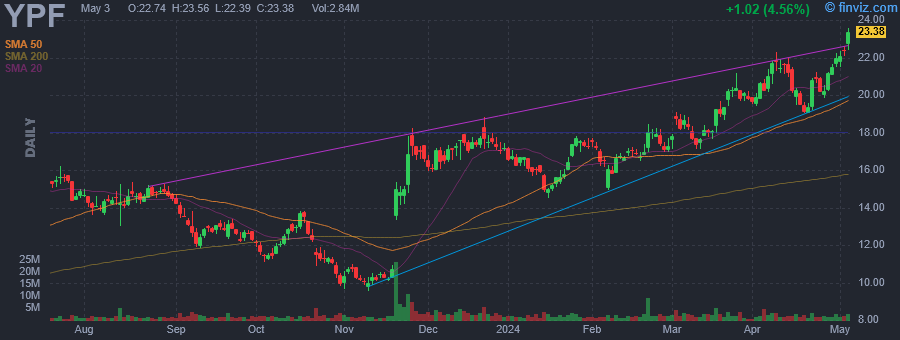 |
| Market Cap | 8.40B | EPS (ttm) | -7.67 |
| P/E | - | EPS this Y | 219.79% |
| Forward P/E | 4.28 | EPS next Y | 24.40% |
| PEG | - | EPS past 5Y | - |
| P/S | 0.46 | EPS next 5Y | -11.10% |
| P/B | 0.84 | EPS Q/Q | 109.56% |
| Dividend | - | Sales Q/Q | 2.14% |
| Insider Own | 0.06% | Inst Own | 12.17% |
| Insider Trans | 0.00% | Inst Trans | 5.40% |
| Short Float | 0.67% | Earnings | May 09/b |
| Analyst Recom | 2.64 | Target Price | 25.63 |
| Avg Volume | 2.44M | 52W Range | 9.57 - 24.76 |
|
|
| May-23-24 | Upgrade |
BofA Securities |
Underperform → Neutral |
|
|
|
|
YPF SA engages in the exploration, production, and distribution of oil and gas. It operates through the following segments: Upstream, Gas and Power, Downstream, Central Administration and Other. The Upstream segment sells petroleum and natural gas. The Gas and Power segment markets natural gas to third parties and downstream segment; and manages commercial and technical LNG Regasification Terminals in Bahia Blanca and Escobar. The Downstream segment produces petroleum refining and petrochemicals. The Central Administration and Other segment covers corporate administrative expenses and assets, construction activities, and the environmental remediation. The company was founded on June 2, 1977 and is headquartered in Buenos Aires, Argentina. |
|
|
