 |
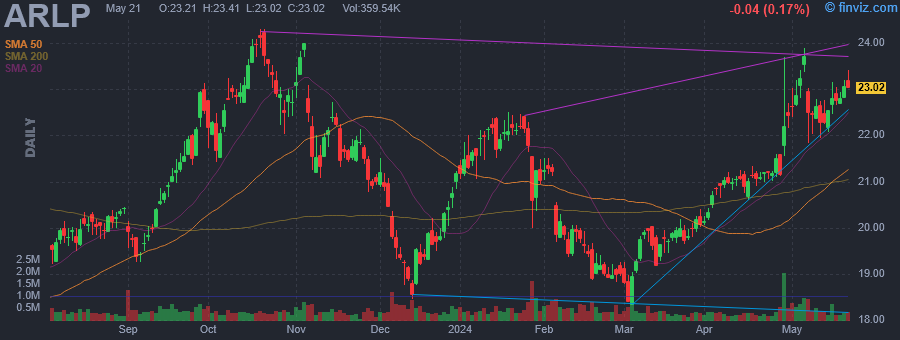
| Market Cap | 2.84B | EPS (ttm) | 4.81 |
| P/E | 4.62 | EPS this Y | -19.91% |
| Forward P/E | 5.67 | EPS next Y | 1.62% |
| PEG | - | EPS past 5Y | 11.92% |
| P/S | 1.11 | EPS next 5Y | -6.83% |
| P/B | 1.54 | EPS Q/Q | -45.75% |
| Dividend | 12.61% | Sales Q/Q | -10.75% |
| Insider Own | 31.05% | Inst Own | 17.33% |
| Insider Trans | -1.03% | Inst Trans | -6.00% |
| Short Float | 4.73% | Earnings | Apr 29/b |
| Analyst Recom | 1.00 | Target Price | 26.00 |
| Avg Volume | 439.69K | 52W Range | 17.05 - 24.30 |
|
|
|
|
Alliance Resource Partners LP is a natural resource company, which produces and markets coal to United States utilities and industrial users. It operates through the following segments: Illinois Basin, Appalachia, Minerals, and Other & Corporate. The Illinois Basin segment is comprised of Webster County coal's Dotiki mining complex, Gibson mining complex, which includes the Gibson north mine and the Gibson south project, Hopkins County coal's Elk Creek mining complex, White County coal's Pattiki mining complex, Warrior's mining complex, River View's mining complex, the Sebree property and certain properties of Alliance Resource Properties and ARP Sebree LLC. The Appalachian segment is composed of Pontiki and MC Mining complexes. The Minerals segment includes its oil & gas mineral interests, which are located primarily in the Permian, Anadarko, and Williston basins. The Other and Corporate segment includes marketing and administrative expenses, Mt. Vernon dock activities, coal brokerage activity, its equity investment in Mid-America Carbonates LLC and certain activities of Alliance Resource Properties. The company was founded in 1971 and is headquartered in Tulsa, OK. |
| Insider Trading |
Relationship |
Date |
Transaction |
Cost |
#Shares |
Value ($) |
#Shares Total |
SEC Form 4 |
| Mowry Kathleen | 10% Owner | Dec 06 '23 | Sale | 20.05 | 34,492 | 691,571 | 16,167,865 | Dec 08 09:05 AM | | Mowry Kathleen | 10% Owner | Dec 05 '23 | Sale | 20.62 | 33,087 | 682,095 | 16,202,357 | Dec 06 09:04 AM | | Mowry Kathleen | 10% Owner | Dec 04 '23 | Sale | 21.06 | 19,826 | 417,629 | 16,235,444 | Dec 06 09:04 AM | | Mowry Kathleen | 10% Owner | Dec 01 '23 | Sale | 21.27 | 54,337 | 1,155,922 | 16,255,270 | Dec 04 10:54 AM | | Mowry Kathleen | 10% Owner | Nov 30 '23 | Sale | 21.02 | 12,716 | 267,237 | 16,309,607 | Dec 04 10:54 AM |
|
|
 |
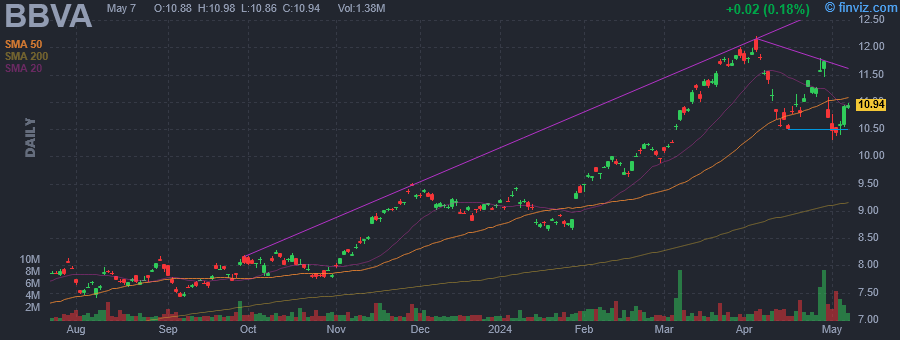 |
| Market Cap | 68.19B | EPS (ttm) | 1.45 |
| P/E | 8.07 | EPS this Y | 6.73% |
| Forward P/E | 7.68 | EPS next Y | -0.25% |
| PEG | 0.72 | EPS past 5Y | 9.62% |
| P/S | 0.99 | EPS next 5Y | 11.20% |
| P/B | 1.19 | EPS Q/Q | 41.82% |
| Dividend | 5.91% | Sales Q/Q | 35.51% |
| Insider Own | 0.00% | Inst Own | 3.08% |
| Insider Trans | - | Inst Trans | 2.58% |
| Short Float | 0.04% | Earnings | Apr 29/b |
| Analyst Recom | 2.38 | Target Price | 11.76 |
| Avg Volume | 1.64M | 52W Range | 6.47 - 12.20 |
|
|
|
|
Banco Bilbao Vizcaya Argentaria SA engages in the traditional banking businesses of retail banking, asset management, private banking, and wholesale banking. It operates through the following segments: Spain, the United States, Mexico, Turkey, South America, and Rest of Eurasia. The Spain segment includes mainly the banking and insurance business that the group carries out in Spain. The United States segment consists of the financial business activity of BBVA USA in the country and the activity of the branch of BBVA SA in New York. The Mexico segment refers to banking and insurance businesses in this country as well as the activity of its branch in Houston. The Turkey segment reports the activity of Garanti BBVA group that is mainly carried out in this country and, to a lesser extent, in Romania and the Netherlands. The South America segment comprises of operations in n Argentina, Colombia, Peru, Uruguay, and Venezuela. The Rest of Eurasia segment includes the banking business activity carried out by the group in Europe and Asia, excluding Spain. The company was founded in 1857 and is headquartered in Madrid, Spain. |
|
|
 |
| Market Cap | 261.27M | EPS (ttm) | 1.39 |
| P/E | 10.15 | EPS this Y | -13.31% |
| Forward P/E | 7.38 | EPS next Y | 58.51% |
| PEG | - | EPS past 5Y | 14.23% |
| P/S | 2.06 | EPS next 5Y | - |
| P/B | 0.90 | EPS Q/Q | -48.78% |
| Dividend | - | Sales Q/Q | 14.60% |
| Insider Own | 38.34% | Inst Own | 43.42% |
| Insider Trans | 0.00% | Inst Trans | -2.63% |
| Short Float | 3.71% | Earnings | Apr 29/b |
| Analyst Recom | 2.00 | Target Price | 20.00 |
| Avg Volume | 41.35K | 52W Range | 12.16 - 18.00 |
|
|
|
|
Southern California Bancorp operates as a bank holding company, which offers a range of financial products to individuals, professionals and small-to-medium sized businesses. The Bank's solution-driven, relationship-based approach to banking provides accessibility to decision makers and enhances value through strong partnerships with its clients. The Bank currently operates branches in San Diego County, Los Angeles County, Orange County, San Bernardino County, and the Coachella Valley in Riverside County. The company was founded in 2001 and is headquartered in San Diego, CA. |
| Insider Trading |
Relationship |
Date |
Transaction |
Cost |
#Shares |
Value ($) |
#Shares Total |
SEC Form 4 |
| Machado Lester | Director | Mar 07 '24 | Option Exercise | 9.67 | 8,000 | 77,360 | 12,291 | Mar 11 03:22 PM | | Farkash John | 10% Owner | Feb 27 '24 | Option Exercise | 10.27 | 37,000 | 380,070 | 628,919 | Feb 28 09:35 PM | | Farkash John | 10% Owner | Feb 24 '24 | Option Exercise | 6.37 | 7,500 | 47,775 | 591,919 | Feb 27 08:52 PM | | Golds Irwin | Director | Jan 24 '24 | Option Exercise | 6.37 | 7,500 | 47,775 | 8,952 | Jan 26 02:19 PM |
|
|
| |
 |
| Market Cap | 12.36B | EPS (ttm) | 1.89 |
| P/E | 12.39 | EPS this Y | -2.30% |
| Forward P/E | 8.06 | EPS next Y | 14.65% |
| PEG | 1.44 | EPS past 5Y | 4.38% |
| P/S | 1.56 | EPS next 5Y | 8.63% |
| P/B | 0.97 | EPS Q/Q | 53.74% |
| Dividend | 5.28% | Sales Q/Q | 1.92% |
| Insider Own | 45.78% | Inst Own | 42.48% |
| Insider Trans | -0.02% | Inst Trans | 1.18% |
| Short Float | 8.11% | Earnings | Apr 29/b |
| Analyst Recom | 3.79 | Target Price | 27.38 |
| Avg Volume | 3.57M | 52W Range | 21.88 - 30.32 |
|
|
|
|
Franklin Resources, Inc. is a holding company, which engages in the provision of investment management and related services. The firm offers services and products under various distinct brand names, including, but not limited to, Franklin, Templeton, Legg Mason, Benefit Street Partners, Brandywine Global Investment Management, Clarion Partners, ClearBridge Investments, Fiduciary Trust International, Franklin Bissett, Franklin Mutual Series, K2, LibertyShares, Martin Currie, Royce Investment Partners and Western Asset Management Company. It provides investment management and related services to retail, institutional and high-net-worth investors in jurisdictions worldwide. The company was founded by Rupert H. Johnson, Sr. in 1947 and is headquartered in San Mateo, CA. |
| Insider Trading |
Relationship |
Date |
Transaction |
Cost |
#Shares |
Value ($) |
#Shares Total |
SEC Form 4 |
| Sethi Alok | EVP, Head of Global Operations | Dec 14 '23 | Sale | 29.27 | 22,000 | 643,845 | 70,481 | Dec 14 07:22 PM | | Sethi Alok | EVP, Head of Global Operations | Dec 05 '23 | Sale | 25.38 | 25,000 | 634,465 | 92,481 | Dec 05 04:37 PM | | Byerwalter Mariann H | Director | Oct 10 '23 | Sale | 24.01 | 6,011 | 144,324 | 10,494 | Oct 10 06:08 PM |
|
|
|
 |
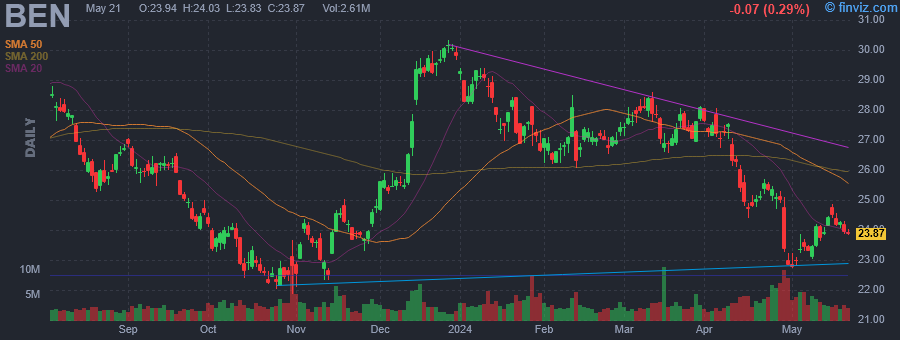
| Market Cap | 237.65M | EPS (ttm) | 1.24 |
| P/E | 11.74 | EPS this Y | -0.27% |
| Forward P/E | 9.14 | EPS next Y | 28.98% |
| PEG | 1.17 | EPS past 5Y | -11.80% |
| P/S | 1.65 | EPS next 5Y | 10.00% |
| P/B | 0.54 | EPS Q/Q | -95.28% |
| Dividend | 6.89% | Sales Q/Q | -12.63% |
| Insider Own | 11.26% | Inst Own | 52.20% |
| Insider Trans | -0.33% | Inst Trans | -0.98% |
| Short Float | 4.91% | Earnings | Apr 29/b |
| Analyst Recom | 2.33 | Target Price | 20.10 |
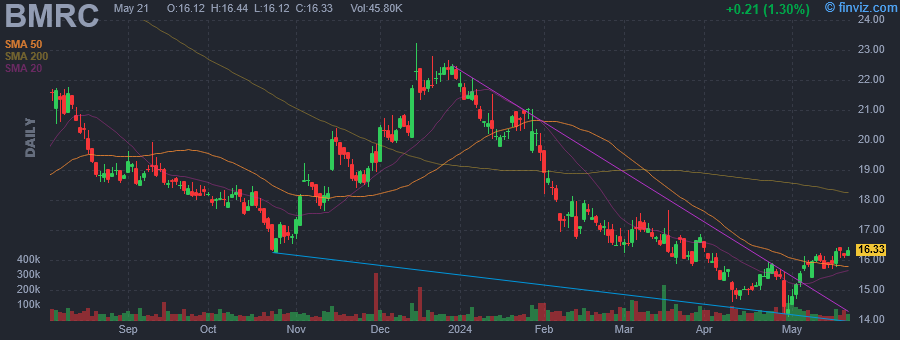
| Avg Volume | 70.84K | 52W Range | 12.89 - 23.24 |
|
|
|
|
Bank of Marin Bancorp is a bank holding company, which operates through the Bank of Marin, providing financial services to customers. It offers traditional community banking activities and wealth management and trust services, personal and business checking and savings accounts, certificates of deposit, individual retirement accounts, health savings accounts, certificate of deposit account registry services, insured cash sweep, and demand deposit marketplace accounts. The company was founded by William P. Murray, Jr. in 2007 and is headquartered in Novato, CA. |
| Insider Trading |
Relationship |
Date |
Transaction |
Cost |
#Shares |
Value ($) |
#Shares Total |
SEC Form 4 |
| McDevitt Jr William H | Director | Dec 01 '23 | Sale | 20.10 | 3,000 | 60,307 | 26,715 | Dec 01 05:10 PM | | McDevitt Jr William H | Director | Dec 01 '23 | Sale | 19.99 | 3,000 | 59,980 | 29,715 | Dec 01 05:00 PM | | Stewart Misako | EVP, Chief Credit Officer | May 23 '23 | Buy | 18.45 | 1,000 | 18,455 | 12,873 | May 24 05:25 PM | | Myers Timothy D | President & CEO | May 10 '23 | Buy | 14.56 | 684 | 9,961 | 41,158 | May 12 11:53 AM | | Sathis Arasadi | Executive Vice President | May 08 '23 | Buy | 14.20 | 100 | 1,420 | 300 | May 09 12:44 PM |
|
|
| |
 |
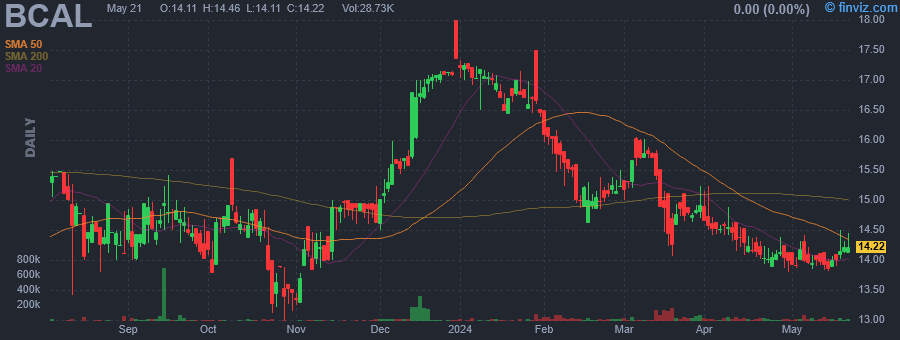
| Market Cap | 184.94M | EPS (ttm) | 2.55 |
| P/E | 8.61 | EPS this Y | -13.41% |
| Forward P/E | 10.15 | EPS next Y | -2.26% |
| PEG | - | EPS past 5Y | 16.54% |
| P/S | 1.62 | EPS next 5Y | - |
| P/B | 0.94 | EPS Q/Q | -30.85% |
| Dividend | - | Sales Q/Q | 1.03% |
| Insider Own | 10.65% | Inst Own | 57.08% |
| Insider Trans | -0.29% | Inst Trans | 4.47% |
| Short Float | 1.06% | Earnings | Apr 29/b |
| Analyst Recom | 1.00 | Target Price | 28.83 |
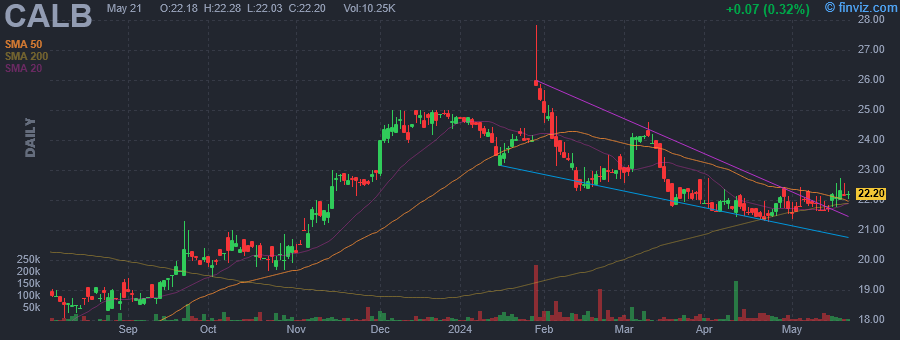
| Avg Volume | 27.58K | 52W Range | 12.78 - 27.82 |
|
|
|
Today 08:00AM
|
California BanCorp Reports Financial Results for the First Quarter Ended March 31, 2024
(GlobeNewswire) |
|
Feb-01-24 02:25PM
|
Kuehn Law Encourages ICVX, CSTR, AVRO, and CALB Investors to Contact Law Firm
(PR Newswire) |
|
Jan-31-24 10:40AM
|
SHAREHOLDER NOTICE: Halper Sadeh LLC Investigates TAST, AVRO, CALB
(GlobeNewswire) |
|
Jan-30-24 02:38PM
|
SHAREHOLDER NOTICE: Halper Sadeh LLC Investigates AVRO, CALB, BCAL
(PR Newswire) +7.41% |
|
06:30AM
|
California BanCorp Reports Financial Results for the Fourth Quarter and Twelve Months Ended December 31, 2023
(GlobeNewswire) |
|
06:00AM
|
Southern California Bancorp and California BanCorp Announce a Merger of Equals to Create a Premier California Business Bank
(GlobeNewswire) |
|
Oct-26-23 04:30PM
|
California BanCorp Reports Financial Results for the Third Quarter and Nine Months Ended September 30, 2023
(GlobeNewswire) |
|
Aug-05-23 09:42AM
|
Here's Why California BanCorp (NASDAQ:CALB) Has Caught The Eye Of Investors
(Simply Wall St.) |
|
Jul-27-23 04:30PM
|
California BanCorp Reports Financial Results for the Second Quarter and Six Months Ended June 30, 2023
(GlobeNewswire) |
|
Apr-26-23 04:30PM
|
California BanCorp Reports Financial Results for the First Quarter Ended March 31, 2023
(GlobeNewswire) |
|
California BanCorp is a holding company, which engages in the provision of financial services to business and professional corporations. Its products and services include commercial checking, savings and money market accounts, certificates of deposit, treasury and cash management services, foreign exchange services, commercial and industrial loans, asset-based loans, loans to dental and veterinary professionals, commercial real estate loans, residential and commercial construction and development loans, online banking, and mobile banking. The company was founded by Rochelle G. Klein on March 31, 2017 and is headquartered in Oakland, CA. |
| Insider Trading |
Relationship |
Date |
Transaction |
Cost |
#Shares |
Value ($) |
#Shares Total |
SEC Form 4 |
| Myers Scott Alexander | SEVP, Chief Lending Offier | Feb 01 '24 | Sale | 24.68 | 2,564 | 63,280 | 20,075 | Feb 02 06:23 PM | | Doiguchi Wayne S. | Director | Aug 02 '23 | Sale | 18.62 | 400 | 7,448 | 21,522 | Aug 08 04:19 PM | | Doiguchi Wayne S. | Director | Aug 01 '23 | Sale | 18.51 | 388 | 7,182 | 21,922 | Aug 03 04:31 PM | | Doiguchi Wayne S. | Director | Jun 08 '23 | Sale | 15.08 | 650 | 9,802 | 22,310 | Jul 03 04:32 PM |
|
|
|
 |
| Market Cap | 526.30M | EPS (ttm) | 3.27 |
| P/E | 12.03 | EPS this Y | 16.13% |
| Forward P/E | 6.65 | EPS next Y | 55.69% |
| PEG | - | EPS past 5Y | 29.01% |
| P/S | 0.98 | EPS next 5Y | - |
| P/B | 1.77 | EPS Q/Q | -31.67% |
| Dividend | - | Sales Q/Q | 41.71% |
| Insider Own | 19.99% | Inst Own | 59.06% |
| Insider Trans | -0.04% | Inst Trans | -6.12% |
| Short Float | 4.00% | Earnings | Apr 29/b |
| Analyst Recom | 1.00 | Target Price | 54.12 |
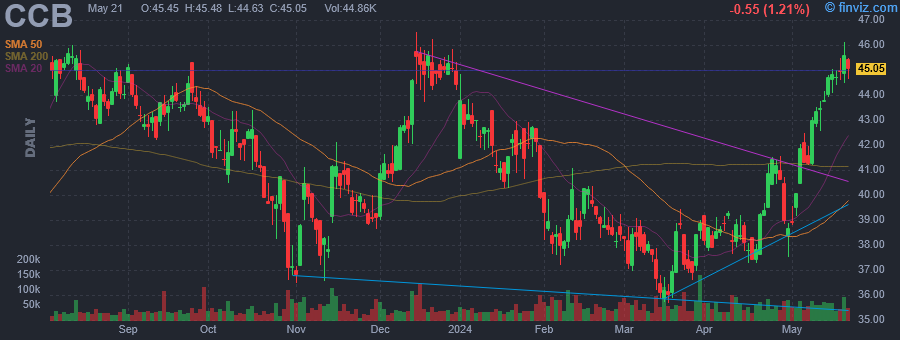
| Avg Volume | 55.65K | 52W Range | 32.20 - 48.50 |
|
|
|
|
Coastal Financial Corp. is a bank holding company, which engages in the provision of banking products and services to small and medium-sized businesses, professionals, and individuals. It operates through the Community Bank and CCBX segments. The Community Bank segment is involved in banking products and services to consumers and small to medium sized businesses in the broader Puget Sound region in the state of Washington. The CCBX segment focuses on the BaaS that allows broker-dealer and digital financial service partners to offer their customers banking services. The company was founded by Lee Pintar on July 9, 2003 and is headquartered in Everett, WA. |
| Insider Trading |
Relationship |
Date |
Transaction |
Cost |
#Shares |
Value ($) |
#Shares Total |
SEC Form 4 |
| EDWARDS JOEL G | Chief Financial Officer | Mar 12 '24 | Option Exercise | 5.50 | 800 | 4,400 | 57,403 | Mar 12 08:25 PM | | Keithley Russ A | Chief Banking Officer | Mar 05 '24 | Option Exercise | 5.50 | 2,600 | 14,300 | 17,510 | Mar 06 09:16 AM | | Sand Jonathan E | EVP, Chief Credit Officer | Feb 28 '24 | Option Exercise | 6.76 | 800 | 5,410 | 20,611 | Feb 29 06:09 PM | | Culp Michael | Chief Revenue Officer | Feb 27 '24 | Option Exercise | 5.50 | 1,000 | 5,500 | 20,100 | Feb 29 06:11 PM | | Herger Tarah M | EVP, Division Manager | Feb 06 '24 | Sale | 38.08 | 17 | 647 | 14,908 | Feb 07 04:13 PM |
|
|
| |
 |
| Market Cap | 18.32B | EPS (ttm) | 14.67 |
| P/E | 35.87 | EPS this Y | 7.77% |
| Forward P/E | 29.53 | EPS next Y | 12.77% |
| PEG | 2.81 | EPS past 5Y | 11.91% |
| P/S | 4.09 | EPS next 5Y | 12.76% |
| P/B | - | EPS Q/Q | 0.99% |
| Dividend | 1.13% | Sales Q/Q | 0.77% |
| Insider Own | 0.66% | Inst Own | 95.67% |
| Insider Trans | -9.93% | Inst Trans | -9.44% |
| Short Float | 3.80% | Earnings | Apr 29/b |
| Analyst Recom | 1.97 | Target Price | 502.60 |
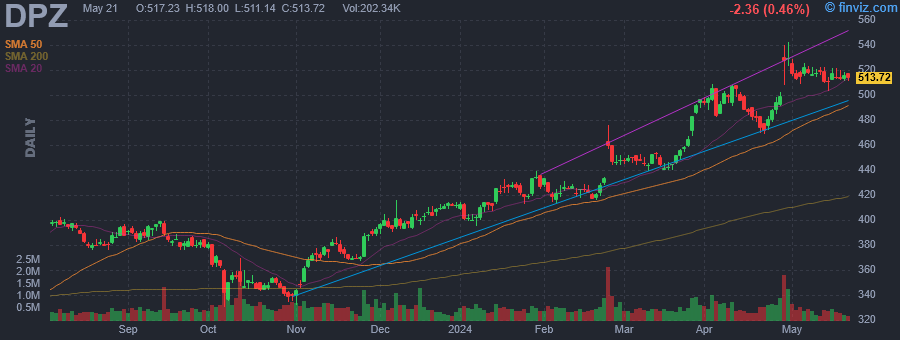
| Avg Volume | 589.93K | 52W Range | 285.84 - 508.44 |
|
|
|
Today 01:00PM
|
Top Stock Movers Now: Tesla, Apple, Google Parent Alphabet, and More
(Investopedia) +5.42% |
|
12:49PM
|
Stocks to Watch Monday: Tesla, SoFi, Apple, Domino's
(The Wall Street Journal) |
|
12:49PM
|
Analyst Report: Domino's Pizza, Inc.
(Morningstar Research) |
|
12:20PM
|
Domino's Pizza reports 5.6% same-store sales increase boosted by Uber Eats partnership and revamped loyalty program
(Nation's Restaurant News) |
|
11:34AM
|
Domino's (DPZ) Q1 Earnings & Revenues Beat Estimates, Stock Up
(Zacks) |
|
10:56AM
|
Domino's Pizza Posts Strong Results on Loyalty Program, Uber Eats Marketing
(Investopedia) |
|
10:52AM
|
DPZ Stock Earnings: Domino's Pizza Beats EPS, Beats Revenue for Q1 2024
(InvestorPlace) |
|
10:46AM
|
Citi Just Raised Its Price Target on Shopify (SHOP) Stock
(InvestorPlace) |
|
10:09AM
|
Domino's stock rises on same-store sales growth
(Yahoo Finance Video) |
|
10:06AM
|
DPZ Stock Analysis: Why Domino's Is Heating Up Today
(InvestorPlace) |
|
Domino's Pizza, Inc. engages in the management of a network of company-owned and franchise-owned pizza stores. It operates through the following segments: U.S. Stores, International Franchise, and Supply Chain. The U.S. Stores segment consists primarily of franchise operations. The International Franchise segment comprises a network of franchised stores. The Supply Chain segment manages regional dough manufacturing and food supply chain centers. The company was founded by James Monaghan and Thomas Stephen Monaghan in 1960 and is headquartered in Ann Arbor, MI. |
| Insider Trading |
Relationship |
Date |
Transaction |
Cost |
#Shares |
Value ($) |
#Shares Total |
SEC Form 4 |
| HEADEN CYNTHIA A | EVP, Chief Supply Chain Offr | Apr 02 '24 | Sale | 495.08 | 108 | 53,469 | 3,910 | Apr 03 05:15 PM | | HEADEN CYNTHIA A | EVP, Chief Supply Chain Offr | Mar 13 '24 | Sale | 451.52 | 768 | 346,768 | 4,103 | Mar 15 04:23 PM | | MORRIS KEVIN SCOTT | EVP, Gen'l Counsel, Secretary | Mar 13 '24 | Sale | 453.39 | 517 | 234,405 | 4,937 | Mar 15 04:22 PM | | JORDAN JOSEPH HUGH | President, U.S. & Global Svcs | Feb 28 '24 | Option Exercise | 118.54 | 2,630 | 311,760 | 9,511 | Mar 01 04:10 PM | | JORDAN JOSEPH HUGH | President, U.S. & Global Svcs | Feb 28 '24 | Sale | 446.06 | 2,630 | 1,173,138 | 6,881 | Mar 01 04:10 PM |
|
|
|
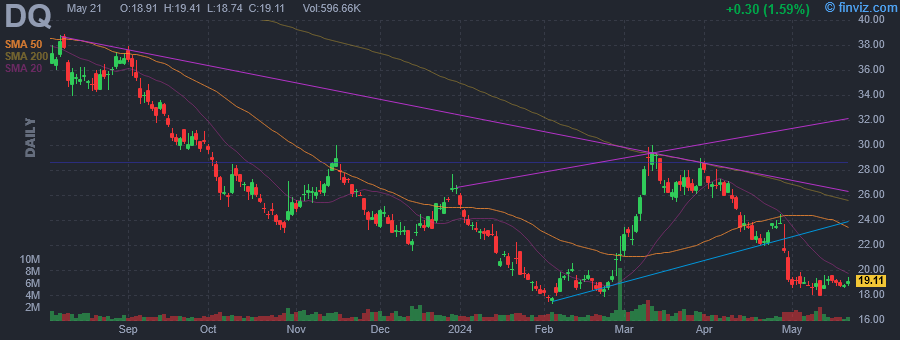 |
| Market Cap | 1.62B | EPS (ttm) | 5.44 |
| P/E | 3.96 | EPS this Y | -33.71% |
| Forward P/E | 3.45 | EPS next Y | 67.76% |
| PEG | - | EPS past 5Y | 55.83% |
| P/S | 0.70 | EPS next 5Y | - |
| P/B | 0.34 | EPS Q/Q | -83.88% |
| Dividend | 0.16% | Sales Q/Q | -44.79% |
| Insider Own | 0.58% | Inst Own | 44.65% |
| Insider Trans | 0.00% | Inst Trans | 5.83% |
| Short Float | 3.91% | Earnings | Apr 29/b |
| Analyst Recom | 2.38 | Target Price | 27.23 |
| Avg Volume | 1.29M | 52W Range | 17.30 - 48.31 |
|
|
|
|
Daqo New Energy Corp. is a holding company, which engages in the provision of polysilicon products. It involves in the manufacture and sale of polysilicon to photovoltaic product manufactures, who further process the polysilicon into ingots, wafers, cells, and modules for solar power solutions. The company was founded by Guang Fu Xu on November 22, 2007 and is headquartered in Shanghai, China. |
|
|
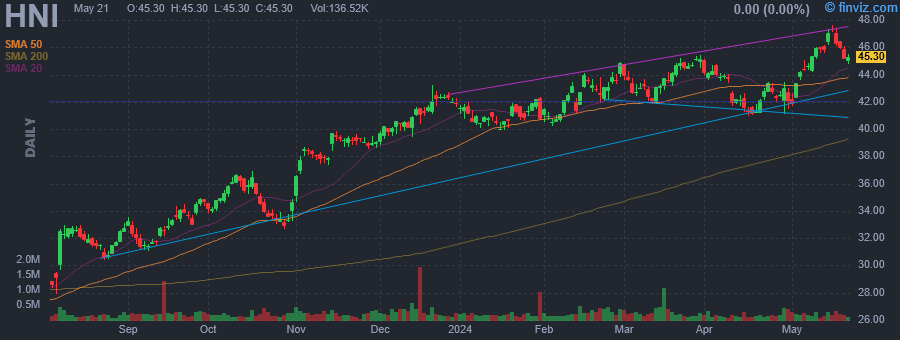 |
| Market Cap | 2.05B | EPS (ttm) | 1.02 |
| P/E | 42.64 | EPS this Y | 9.81% |
| Forward P/E | 13.09 | EPS next Y | 13.92% |
| PEG | 4.26 | EPS past 5Y | -12.45% |
| P/S | 0.84 | EPS next 5Y | 10.00% |
| P/B | 2.67 | EPS Q/Q | 22.34% |
| Dividend | 2.95% | Sales Q/Q | 19.49% |
| Insider Own | 2.10% | Inst Own | 78.29% |
| Insider Trans | -9.14% | Inst Trans | -0.88% |
| Short Float | 1.19% | Earnings | Apr 29/b |
| Analyst Recom | 1.00 | Target Price | 52.33 |
| Avg Volume | 266.44K | 52W Range | 24.81 - 45.47 |
|
|
|
|
HNI Corp. engages in the provision of workplace furnishings and residential building products. It operates through the Workplace Furnishing and Residential Building Products segments. The Workplace Furnishings segment manufactures and markets a broad line of commercial and home office furniture, which includes panel-based and freestanding furniture systems, seating, storage, tables, and architectural products. The Residential Building Products segment manufactures and markets a full array of gas, wood, electric, and pellet fueled fireplaces, inserts, stoves, facings, and accessories. The company was founded by C. Maxwell Stanley, Clem Hanson, and H. Wood Miller in 1944 and is headquartered in Muscatine, IA. |
| Insider Trading |
Relationship |
Date |
Transaction |
Cost |
#Shares |
Value ($) |
#Shares Total |
SEC Form 4 |
| Porcellato Larry B | Director | Mar 18 '24 | Sale | 44.00 | 2,000 | 88,000 | 40,718 | Mar 19 12:00 PM | | CALADO MIGUEL M | Director | Mar 18 '24 | Sale | 44.00 | 1,500 | 66,000 | 35,489 | Mar 19 01:34 PM | | Berger Vincent P | President, HHT; EVP, HNI Corp | Mar 15 '24 | Option Exercise | 32.03 | 1,598 | 51,184 | 68,623 | Mar 18 03:15 PM | | Bell Mary A | Director | Mar 15 '24 | Sale | 43.13 | 2,898 | 124,991 | 76,183 | Mar 18 03:18 PM | | Porcellato Larry B | Director | Mar 15 '24 | Sale | 43.28 | 2,000 | 86,560 | 42,025 | Mar 19 12:00 PM |
|
|
|
