Oscillators
Oscillators represent another widely used group of technical analysis indicators. They are popular mostly because of their ability to draw attention to a possible change in the trend even before this change starts to manifests itself in price and volume. They should work best in periods of sideways markets.
Introduction
Oscillators are together with moving averages the most commonly used indicators in technical analysis. They take the form of lines that are drawn under the price chart for the particular stock. Oscillators got their name according to the fact that their values tend to oscillate in a certain range. We can analyze current market situation according to the indicator's position within this range. A typical oscillator moves in a manner similar to a sine curve between its two extreme values. There is a vast array of oscillators, many of which are very similar. Here we will present the most commonly used types.
Purpose and use in technical analysis
Oscillators are primarily used as leading indicators - so their purpose is to inform us about a possible start of a new trend or its reversal. Two things are important to watch for here - the current reading of the oscillator as well as the trend the oscillator's values follow. The current value of the oscillator usually describes current strength of the trend. If the values are rising, trend is gaining momentum and prices are changing faster. Conversely, if an oscillator's values are decreasing, prices are changing at a slower pace and trend is losing strength, which can imply its reversal in the near future.
Besides, oscillators are also used to detect imbalances in the market. For example, if the price is rising too quickly, the oscillator reaches a level at which the market is considered overbought. At this level the price is rising too quickly compared to the previous periods. It is highly probable that such a steep rise will be followed by a short-term price correction or at least by a loss of momentum in the trend that will restrict the price rise for some time. Similarly, if the oscillator reaches an oversold level, it implies that price is falling too quickly. It is probable that the decline will ease or stop completely for some time. In some cases it can be followed by a trend reversal.
The third way how to use oscillators is trying to find divergences between the indicator and market price or volume. For example, if the market price reaches next high that is higher than the previous high, while the oscillator MACD (plots the difference between moving averages of price for several time periods) stops its rise at a level that is lower than the previous high, there is a bearish divergence in the market. This implies that prices are rising slower than in earlier periods and the trend is "running out of steam". Such divergence usually precedes the start of a downward trend.
Trading signals
An oscillator can generate several kinds of trading signals. The most popular kind of a trading signal occurs when the oscillator enters either the oversold or the overbought area. This range starts after the oscillator's reading breaches a particular value. This value can be modified according to current market conditions and trader's needs.
For example, when the Relative Strength Index (RSI) crosses above the value of 70, it implies that the market is overbought and thus gives the trader a signal to close his long positions and eventually start selling short. Conversely, when the RSI crosses below the value of 30, it means that the market is oversold and implies that traders should cover their short positions and start buying. However, most traders open positions in the direction opposite to the current trend only after the RSI reaches the overbought/oversold level for the second time in a row. This is the case, because oscillators often also tend to generate false signals. However, their frequency can be reduced by modifying the critical values (e.g. with RSI we will not make a trade after crossing above 70 and under 30, but will rather trade only after the RSI crosses above 80 or under 20). Nonetheless, this reduces the total amount of all signals generated, which also means that such a system informs us about a trend reversal later than the system using less stringent rules.
Besides, chart patterns such as a double top, head and shoulders and others also tend to appear in an oscillator's chart, so the charting approach can be used, as well. Technical analysts often analyze oscillator data by using trendlines.
Another very popular signal for opening a position occurs when the oscillator breaches its midpoint value - in this case the oscillator crosses into the other half of the oscillator's scale. The rule is that if the oscillator's reading is above the midpoint value, but not yet in the overbought zone, it implies that the upward trend should continue. On the other hand, if the reading is under the midpoint value, but not yet in the oversold zone, it implies that the downward trend should continue and thus the price should drop further.
For example, the MACD has a midpoint value of 0. In case it decreases from 1 to -1, it crosses the midpoint value, which implies that the price rise will be for some time replaced by a short-term price decrease. That's why the trader initiates short positions. Conversely, if the MACD later rises from -1 to the value of 0,3 it crosses the midpoint value again, and thus generates a buy signal. However, when using this signal, you should not open positions against the main (long -term) trend's direction (Murphy).
Another way to use oscillators is the already mentioned searching for divergences. However, in this case the oscillator does not provide us with any clear entry or exit signals, so the precise trading signals have to be taken from other indicators (e.g. moving averages) or from chart patterns.
Pros and cons
Oscillators are most reliable in periods when there is no clear trend in the market, i.e. prices are moving sideways in a narrow range between the particular support and resistance levels. In such an environment oscillators can yield quite precise buy and sell signals by reaching oversold or overbought levels.
However, problems come when the market moves in a certain direction, support (or resistance) is breached and a new trend emerges. At that time most oscillators generate overbought or oversold signals. Nonetheless, these signals remain ignored by the market participants and the values of oscillators can stay in extreme zones for quite a long time during these periods. This development can catch some traders by surprise and cause serious losses. That's why it is better in case the price breaches a support or resistance and a new trend emerges, to ignore the oscillators completely. Yet, later - especially when the trend is nearing its end - oscillators are worth watching again, since they offer interesting information about possible divergences within the trend and thus can help us to detect its reversal by reaching the overbought or oversold levels. The more mature a trend is, the more reliable are the signals generated by oscillators.
Types of oscillators
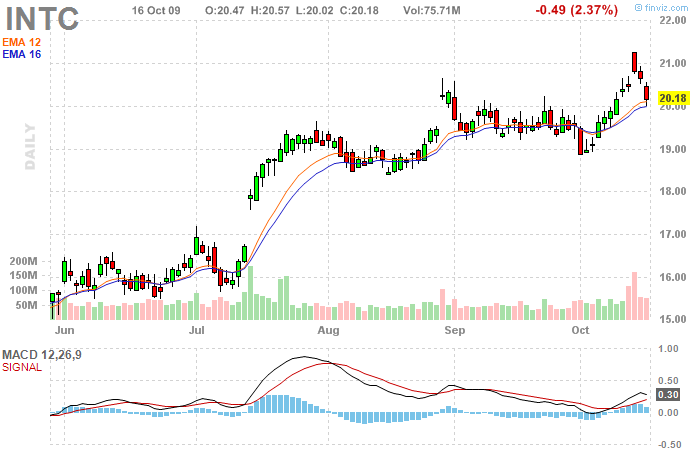
MACD is one of the most widely used trend-following indicators. It combines the properties of a moving average with those of an oscillator. It plots the difference between several exponential moving averages. The most commonly used periods for the averages in MACD are 9-, 12- and 26- days, but you can specify your own periods. MACD is constituted by two lines:
MACD line = (12-day exponential moving average of prices) - (26-day exponential moving average of prices)
Signal line = 9-day exponential moving average of MACD values
In the graph, MACD can be plotted either as these two lines or as a histogram of the difference between these two lines.
The MACD line is the faster one and it generates trading signals by crossing the signal line.
If the MACD line crosses above the signal line, it implies a buy signal.
A sell signal occurs when the MACD line crosses under the signal line.
Besides, if the MACD line crosses above zero, it yields a buy signal.
Conversely, if the MACD line crosses under zero, it is considered a sell signal.
Moreover, a rise (fall) of MACD that is too steep compared to historical values can be considered a proof of an overbought (oversold) situation in the market, and thus a sell (buy) signal occurs.
Opposed to most other oscillators, MACD's values are not standardized, and that's why there is not a clear rule on how high should a MACD rise in order to be considered overbought. That's why we have to compare the current MACD's values to the values attained in the past.
Recently, MACD has also been often plotted in form of a histogram - basically a bar chart that contains neither the MACD line nor the signal line, but instead only the difference between the two lines is plotted. In this chart, it is much easier to spot possible divergences between the price and MACD. Besides, the histogram generates a buy signal by crossing above zero and a sell signal by crossing under zero, whereas these areas represent the very places where the two lines (MACD and signal line) intersect, which makes the analysis much easier.
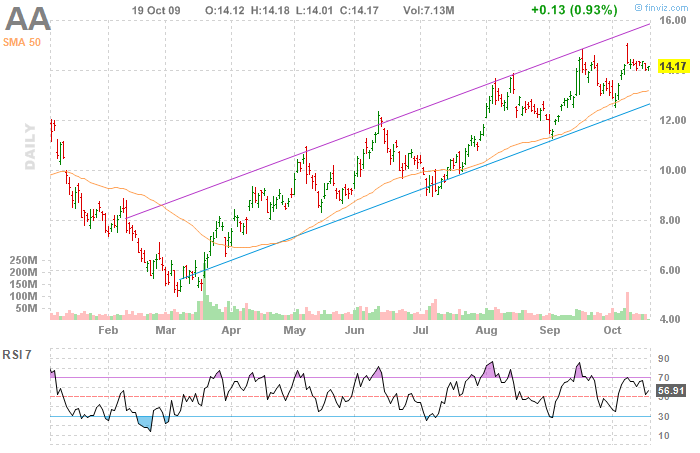
RSI is an oscillator that measures the rate of increase or decrease in price of a stock for certain period of time and subsequently generates buy or sell signals when it reaches overbought/oversold level. It was designed by the well-known analyst Welles Wilder. The formula for RSI computation is:
RSI= 100 - (100/(1+ RS) )
Where: RS= (average daily price increase / average daily price decrease)
Usually the period of 14 days is used in the computation. However, the shorter period we choose, the more sensitive RSI becomes to price changes, which leads to increased amount of false signals. Thus, if we want to compute RSI, we have to sum up the points by which the price increased during the up days and then divide it by the number of days (14).
If the RSI rises above 30, it implies a buy signal.
If the RSI falls under 70, a sell signal occurs.
As opposed to similar oscillators, RSI has the advantage of being standardized, whereby it can reach only the values between 0 and 100. Hence, with this indicator it is relatively easy to determine the overbought and oversold zones and thus to spot the respective trading signal.
Recommended values are over 70 for overbought and under 30 for oversold. Still, some traders rather use the values of 80 and 20, respectively. Besides, RSI is also used for finding divergences. In case RSI moves in the opposite direction to price, a trend reversal in the near future is probable. Moreover, crossing the middle value of 50 is sometimes considered a trading signal, too.
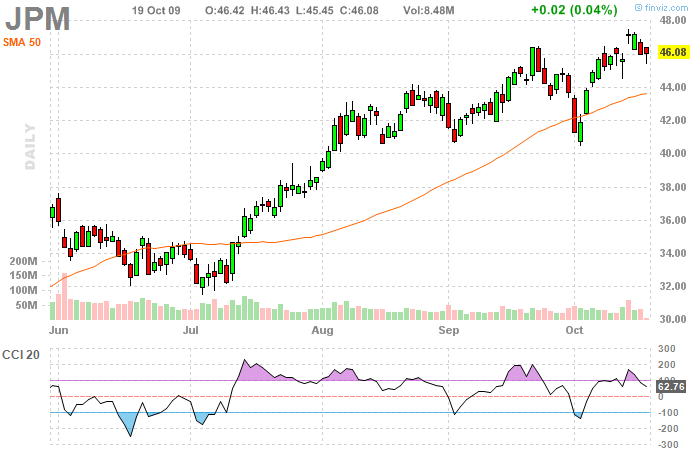
CCI was originally developed in late 90's for commodity futures trading. However, nowadays it is increasingly being used also in stock or currency trading. CCI is computed as follows:
CCI = (price - simple moving average) / (0.015 * standard deviation of the price)
In most cases the day's closing price (or in case of using lower timeframe the current market price) is utilized for the computation. But for example, in Forex trading so called "typical price" (i.e. sum of daily low and daily high divided by 3) is used.
The average is usually computed for the period of 14 days, whereas the rule is again that the shorter period an average uses, the more sensitive it is and the more false signals it yields. The constant 0,015 is included in the formula in order to make the final values "optically nicer" and easier to read.
Normal values of CCI range between -100 and 100.
Author of the indicator, Donald Lambert, recommends buying when the CCI crosses above 100 and selling when it crosses under -100. However, most of the traders are using CCI in the completely opposite fashion - when CCI crosses above 100, they consider the market overbought and sell.
Conversely, with CCI crossing under -100, they consider the market oversold and buy. Besides, CCI can be used to identify divergences (CCI should move in the same direction as the price, otherwise there is a divergence in the market).
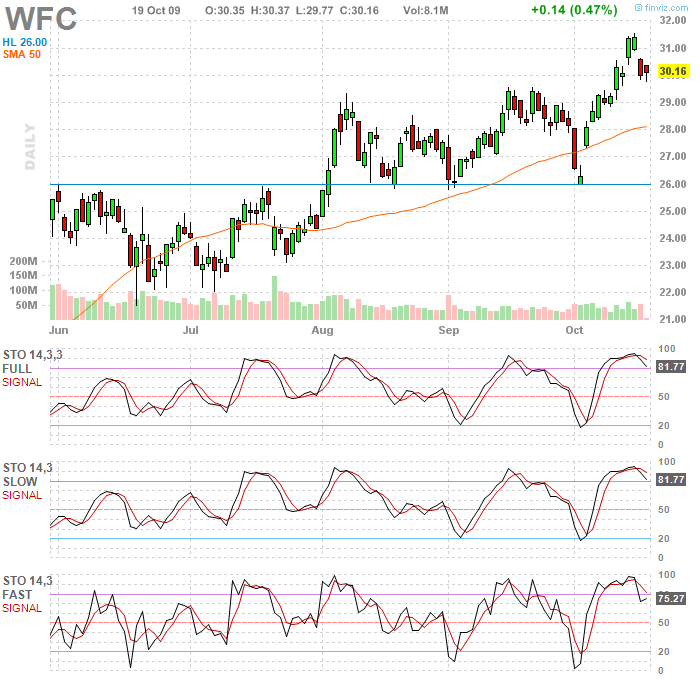
This oscillator is based on the premise that if market prices are rising, closing prices for every day tend to be near the upper boundary of the price range. Conversely, if prices are falling, closing prices tend to be near the lower boundary of the price range.
That's why the purpose of this indicator is to evaluate where the current price is located in relation to the price range of the last few days (usually a 14-day price range is used). Stochastics is constituted by two lines:
%K line = 100 *[(latest closing price - lowest low in the last 14 days) / (highest high in the last 14 days - lowest low in the last 14 days)
%D line = 3-day simple moving average of %K line's values
In case of using a smaller timeframe, we replace the values of the last 14 days with the values of the last 14 hours or 14 minutes. The version of stochastics described here is referred to as fast stochastics. There is also a version called slow stochastics, which uses the same lines smoothed by computing moving averages of their values, which means that they are less sensitive and thus generate less false signals. Yet, their shape is very similar to the fast version.
Moreover, there is also a version of this indicator called full stochastics. It uses 3 lines. The %K(fast) line is computed in the same manner as described above for the fast stochastics. After that we compute the %K(full) line, which is a simple moving average of %K(fast) line's values for a particular period of time. Finally, we add the %D(full) line, which is a simple moving average of %K(full) line's values.
All versions of stochastics work in the same way. Stochastics‘ values range between 0 and 100.
In case Stochastics crosses over 80 it means that the market is overbought and thus indicates a sell signal.
A buy signal is implied by the Stochastics crossing under 20 (oversold market).
Another useful form of signals is the divergence between price and %D line. This signal is most reliable if it occurs while Stochastics is in the oversold or in the overbought territory. Another way how to use Stochastics is to trade when the particular lines, which constitute Stochastics, intersect. If %K line crosses above %D line, it implies a buy signal and conversely, if it crosses under %D line, it implies a sell signal.
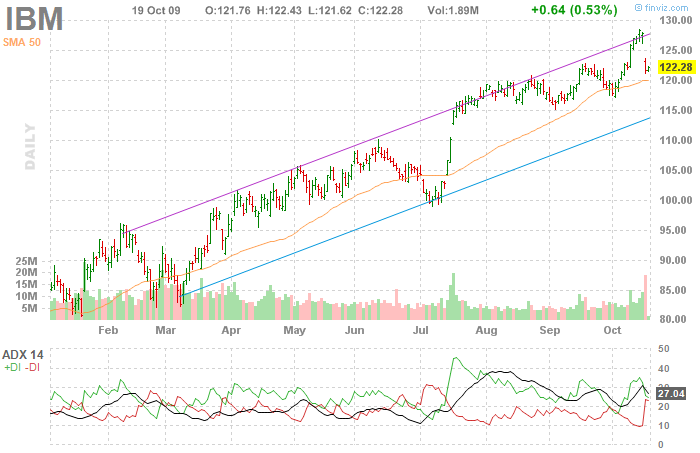
ADX is an oscillator developed by Welles Wilder that is used to measure a trend's strength. Its computation is rather complicated. It is based on relations between changes of price lows and highs during each day. ADX consists of two lines:
the +DI line, which represents upward trend and the -DI line, which represents downward trend.
The indicator itself is then basically computed as the difference between values of these two lines.
ADX can reach values between 0 and 100.
If ADX's values are rising, trend is gaining momentum and conversely, if ADX is dropping then the trend is losing strength.
Values over 40 are considered to represent a strong trend,
whereas values under 20 indicate a sideways market with no clear trend.
ADX may show a divergence when compared with market price, e.g. if the price reaches a new high while the ADX decreases. However, such a divergence does not represent a direct trading signal - it merely states that the trend is weakening.
Nonetheless, trades are sometimes initiated based on ADX in the opposite direction to the current market trend, and namely when the +DI line intersects the -DI line.
ADX is highly popular among traders mostly because it can determine the strength of the trend quite reliably - albeit with a little time lag. According to this information, traders are able to choose the particular indicators that have the highest chance of providing successful trading signals in the current market environment.
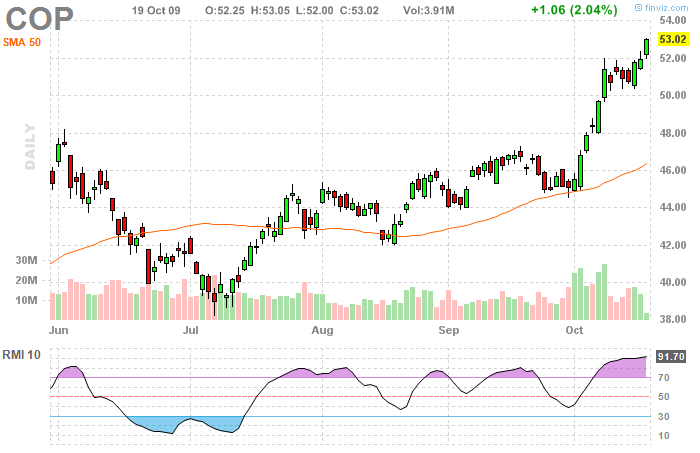
RMI is an adjusted version of the Relative Strength Index (RSI) that attempts to decrease the speed of oscillation and thus limit the amount of false signals. Instead of comparing the current closing price with previous day's close in its computation, RMI compares the current closing price with a closing price from x days ago.
RMI yields trading signals in the same manner as RSI - a sell signal occurs when RMI crosses above 70, which implies an overbought market.
Conversely, when RMI crosses under 30, it signals an oversold market, which represents a buy signal.
Besides, just like RSI it can show divergence with market price. Moreover, the RMI chart may often show various chart patterns that are not visible in the price chart, but which have an effect on the market price.
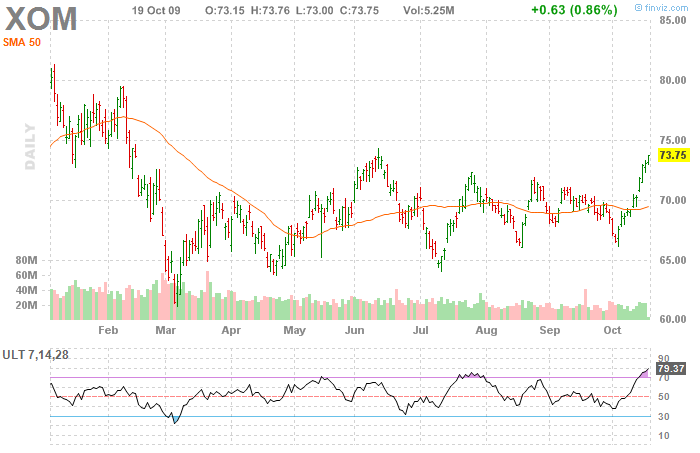
This indicator was developed by the famous trader Larry Williams. It is based on the premise that the buying or selling "pressure" in the market for a given day can be measured by according to the relation between the closing price and the so called true range. True range denotes the price range in which the stocks were traded during the day. The computation of Ultimate oscillator is as follows:
First we compute the buying pressure and the true range:
Buying pressure = closing price - (the value of today's low and previous close)
True range =(the higher of today‘s high and previous close ) - (the lower of today's low and previous close)
After that we compute a 7-day average of buying pressure over true range:
7-day average = (buying pressure for day 1 + buying pressure for day 2 + .... + buying pressure for day 7)/ (true range of day 1 + true range of day 2 + ... + true range of day 7)
Similarly, we compute the averages for 14 and 28 days. Subsequently, we put them into the formula to compute the oscillator:
Ultimate oscillator = 100 x [4 x 7-day average + 2 x 14-day average + 28-day average] / [4 + 2 +1]
Readings of the Ultimate oscillator can range from 0 to 100. In case the value is higher than 30, the market is considered oversold. If the value is higher than 70, the market is overbought.
Williams recommends to buy after a bullish divergence appears (prices reach new minima, but the oscillator does not), while the oscillator is in the oversold zone under 30. During this divergence, if the oscillator reaches a new high that is higher than the previous high, a buy signal is generated. This position should be closed after the oscillator crosses over 70.
Conversely, a sell signal is generated by bearish divergence(price is reaching new highs, but the oscillator is not) in the area over 70, whereas the position should be closed after the oscillator's reading falls under 30.
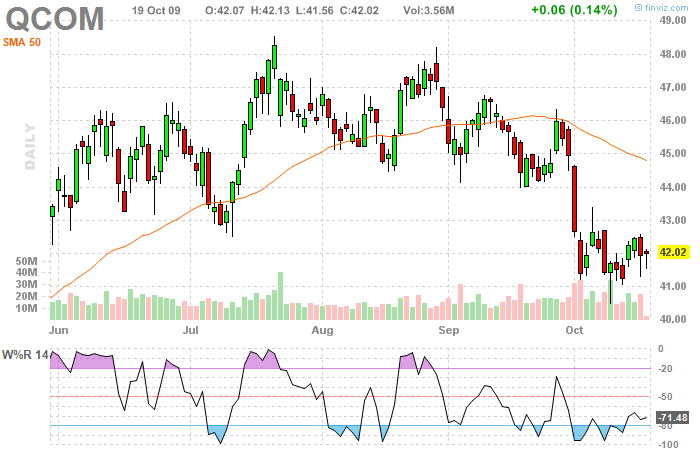
This is another oscillator developed by Larry Williams that is very similar to stochastics. It captures the relation between today's close and the price minima and maxima for a given period of days. The most commonly used is the period of 28 days, but Williams himself uses only 10 days. Again, the rule here is that the shorter time period we select, the more sensitive the indicator gets and the more signals it yields (including false signals). This indicator was developed especially for the stock market. The formula for its computation is:
%R = [(today's close - 28-day low) / (28-day high - 28-day low] x 100
The values of %R can range from -100 to 0. Like most of the oscillators, %R also has the oversold (-80 points and lower) and overbought (-20 points and higher) zones.
Williams recommends buying after:
%R reaches the value of -100
Since %R reached the value of -100 at least 5 trading days have passed
%R subsequently climbs above -95 or -85
And conversely, he recommends selling when:
%R reaches the value of 0
Since %R reached the value of -100 at least 5 trading days have passed
%R subsequently falls under -5 or -15
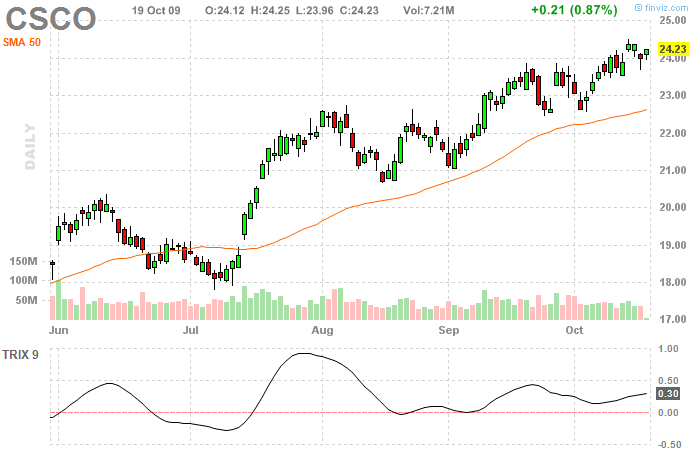
Trix is an oscillator based on the Triple exponentially-smoothed moving average. Its purpose is to separate the important changes in prices from the random "noise" in prices. Thanks to this, the trend in price becomes much more apparent. If Trix is rising (while being in positive values), the momentum of the price rise is increasing and conversely, if it is falling, prices are rising slower or even decline (if it is under 0).
Trix oscillates around the 0 value, whereas crossing above this value is usually considered a buy signal.
Conversely, if Trix crosses under 0, it implies a sell signal.
Like most oscillators, Trix is also used to find divergence with price, as it is considered a leading indicator.
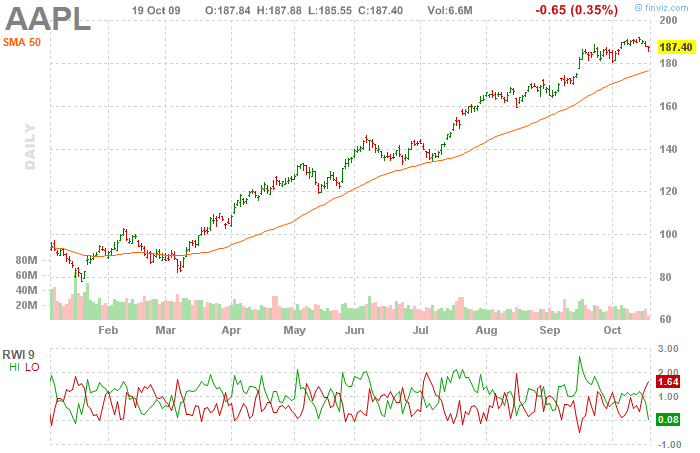
RWI is used in a way similar to ADX, namely to assess the strength of a trend. It attempts to determine, whether there is a statistically significant trend in the market or if the price moves in a random fashion (and thus there is a sideways market).
Random Walk Index assesses the trend in such a way that it measures daily price ranges where the stock was traded for a certain period of time and subsequently compares them to values that would have been in the market in case prices would move completely random (so called Random Walk). The wider a price range, the stronger is the trend. RWI is computed as follows:
First we compute RWI for maxima:
RWImax = [(day‘s high - (day's low * number of days))] / [(Average True Range * number of days * square root of number of days)]
Similarly, we compute the RWI for minima:
RWImin = [(day's high *number of days - (day's low))] / [(Average True Range * number of days * square root of number of days)]
Average True Range is a volatility-based indicator developed by Welles Wilder.It is computed as a 14-day exponential moving average of daily true ranges, which we compute as:
True range = higher of (day's high, previous close ) - lower of (day's low, previous close)
Thank to the two lines RWI can differenciate between an upward and a downward trend.
If the RWI for maxima is higher than 1, there is a significant upward trend in the market.
Conversely, if RWI for minima is higher than 1, there is a strong downward trend in the market.
In case neither RWImax nor RWImin are higher than 1, prices fluctuate in a certain price range.
It is recommended to use RWI for multiple time periods. For short-term trading, the period between 2 and 7 days is recommended and for the long-term trading the periods of 8 to 64 days are more suitable.
If the long-term RWI for maxima is greater than 1 and the short-term RWI for minima crosses above 1, it constitutes a buy signal.
Similarly, if the long-term RWI for minima is lower than 1 and the short-term RWI for maxima crosses above 1, it implies a sell signal.