 |
| Market Cap | 101.60B | EPS (ttm) | 8.96 |
| P/E | 27.60 | EPS this Y | 11.07% |
| Forward P/E | 24.78 | EPS next Y | 9.19% |
| PEG | 2.52 | EPS past 5Y | 14.07% |
| P/S | 5.37 | EPS next 5Y | 10.93% |
| P/B | 21.91 | EPS Q/Q | 14.72% |
| Dividend | 2.07% | Sales Q/Q | 6.62% |
| Insider Own | 0.50% | Inst Own | 82.60% |
| Insider Trans | -2.43% | Inst Trans | 0.81% |
| Short Float | 1.08% | Earnings | May 01/b |
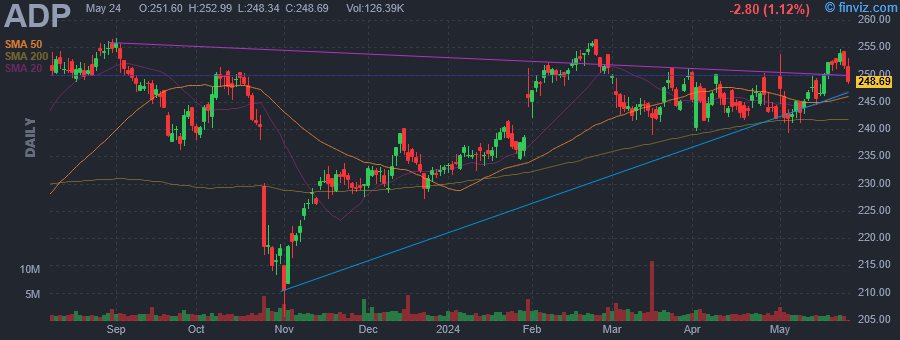
| Analyst Recom | 3.00 | Target Price | 253.65 |
| Avg Volume | 1.81M | 52W Range | 205.53 - 256.84 |
|
|
|
|
Automatic Data Processing, Inc. engages in the provision of business outsourcing solutions in cloud-based human capital management. It operates through the following business segments: Employer Services, Professional Employer Organization Services, and Other. The Employer Services segment provides clients from single-employee small businesses to large enterprises offering human resources outsourcing and technology-based human capital management solutions and cloud-based platforms. The Professional Employer Organization Services segment offers small and mid-sized businesses a human resource outsourcing solution through a co-employment mode. The Other segment includes the certain corporate overhead charges and expenses that have not been allocated to the reportable segments. The company was founded by Henry Taub in 1949 and is headquartered in Roseland, NJ. |
| Insider Trading |
Relationship |
Date |
Transaction |
Cost |
#Shares |
Value ($) |
#Shares Total |
SEC Form 4 |
| KUTAM SREENIVASA | Corp VP | Mar 04 '24 | Sale | 247.01 | 368 | 90,900 | 20,319 | Mar 05 04:12 PM | | Albinson Brock | Corp. VP | Mar 01 '24 | Sale | 249.43 | 1,170 | 291,833 | 4,025 | Mar 05 04:12 PM | | KUTAM SREENIVASA | Corp VP | Mar 01 '24 | Sale | 249.43 | 694 | 173,104 | 20,687 | Mar 05 04:12 PM | | DeSilva Joseph | Corp VP | Feb 22 '24 | Option Exercise | 138.53 | 1,904 | 263,761 | 19,083 | Feb 23 04:27 PM | | DeSilva Joseph | Corp VP | Feb 22 '24 | Sale | 255.00 | 1,904 | 485,520 | 17,179 | Feb 23 04:27 PM |
|
|
 |
 |
| Market Cap | 17.97B | EPS (ttm) | 14.14 |
| P/E | 6.05 | EPS this Y | -6.24% |
| Forward P/E | 7.84 | EPS next Y | 8.40% |
| PEG | 1.12 | EPS past 5Y | 14.86% |
| P/S | 2.47 | EPS next 5Y | 5.40% |
| P/B | 1.04 | EPS Q/Q | 163.41% |
| Dividend | - | Sales Q/Q | -2.15% |
| Insider Own | 3.07% | Inst Own | 91.68% |
| Insider Trans | 0.00% | Inst Trans | -0.82% |
| Short Float | 1.01% | Earnings | May 01/b |
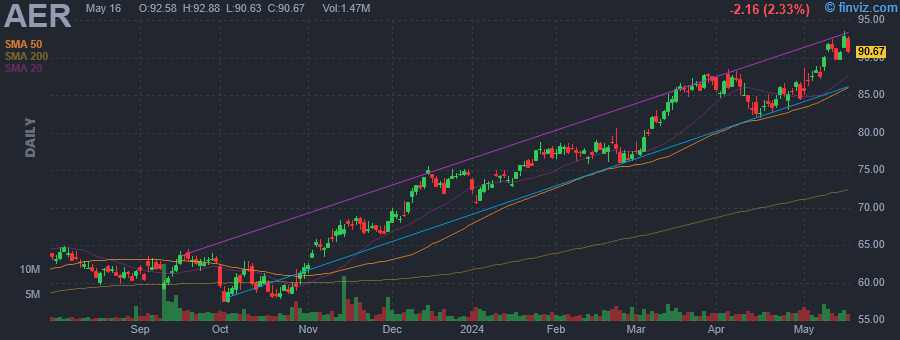
| Analyst Recom | 1.10 | Target Price | 94.22 |
| Avg Volume | 1.61M | 52W Range | 53.42 - 88.44 |
|
|
|
|
AerCap Holdings NV engages in the leasing, financing, sales, and management of commercial flight equipment. It offers passenger and cargo aircraft. The company was founded in 1995 and is headquartered in Dublin, Ireland. |
|
|
 |
| Market Cap | 4.06B | EPS (ttm) | 2.07 |
| P/E | 11.60 | EPS this Y | 80.83% |
| Forward P/E | 9.61 | EPS next Y | -4.03% |
| PEG | 0.47 | EPS past 5Y | - |
| P/S | 2.44 | EPS next 5Y | 24.80% |
| P/B | 3.33 | EPS Q/Q | 485.63% |
| Dividend | - | Sales Q/Q | 23.89% |
| Insider Own | 1.47% | Inst Own | 104.61% |
| Insider Trans | -0.63% | Inst Trans | -1.26% |
| Short Float | 8.11% | Earnings | May 01/b |
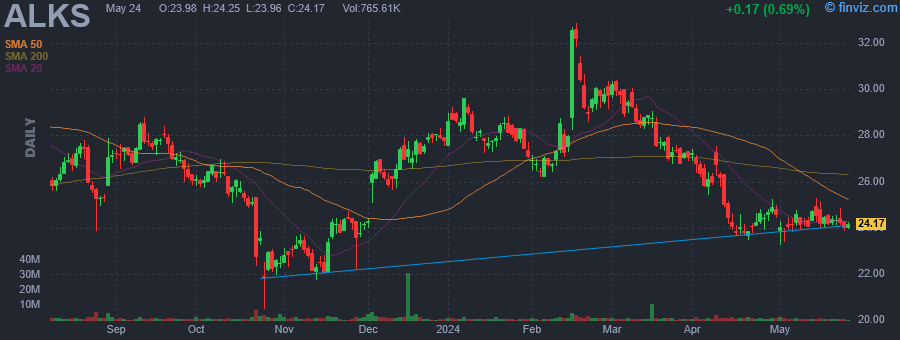
| Analyst Recom | 2.15 | Target Price | 35.25 |
| Avg Volume | 2.05M | 52W Range | 20.46 - 32.88 |
|
|
|
|
Alkermes Plc is a global biopharmaceutical company, which engages in the business of developing, manufacturing, and commercializing medicines designed to address unmet medical needs of patients in major therapeutic areas such as alcohol dependence, opioid dependence, schizophrenia and bipolar I disorder, and a pipeline of product candidates in development for neurological disorders and cancer. Its proprietary products include ARISTADA, ARISTADA INITIO, LYBALVI, and VIVITROL. The company was founded in 1987 and is headquartered in Dublin, Ireland. |
| Insider Trading |
Relationship |
Date |
Transaction |
Cost |
#Shares |
Value ($) |
#Shares Total |
SEC Form 4 |
| Nichols Christian Todd | SVP, Chief Commercial Officer | Mar 18 '24 | Sale | 28.10 | 10,417 | 292,740 | 65,911 | Mar 18 04:02 PM | | Parisi Samuel Joseph | VP, Finance (Interim PAO) | Feb 27 '24 | Sale | 29.65 | 2,559 | 75,874 | 7,717 | Feb 27 04:09 PM | | LAURENCIN CATO T | Director | Feb 15 '24 | Option Exercise | 22.52 | 2,690 | 60,579 | 17,859 | Feb 16 04:01 PM | | LAURENCIN CATO T | Director | Feb 15 '24 | Sale | 31.85 | 2,690 | 85,676 | 15,169 | Feb 16 04:01 PM | | LAURENCIN CATO T | Director | Jun 08 '23 | Option Exercise | 22.97 | 2,638 | 60,595 | 10,117 | Jun 08 04:31 PM |
|
|
| |
 |
| Market Cap | 343.12M | EPS (ttm) | -0.15 |
| P/E | - | EPS this Y | 2.22% |
| Forward P/E | - | EPS next Y | 18.18% |
| PEG | - | EPS past 5Y | 17.93% |
| P/S | 1.11 | EPS next 5Y | 38.90% |
| P/B | 0.62 | EPS Q/Q | -780.95% |
| Dividend | - | Sales Q/Q | -17.11% |
| Insider Own | 0.38% | Inst Own | 23.50% |
| Insider Trans | -1.25% | Inst Trans | -7.14% |
| Short Float | 3.89% | Earnings | May 01/b |
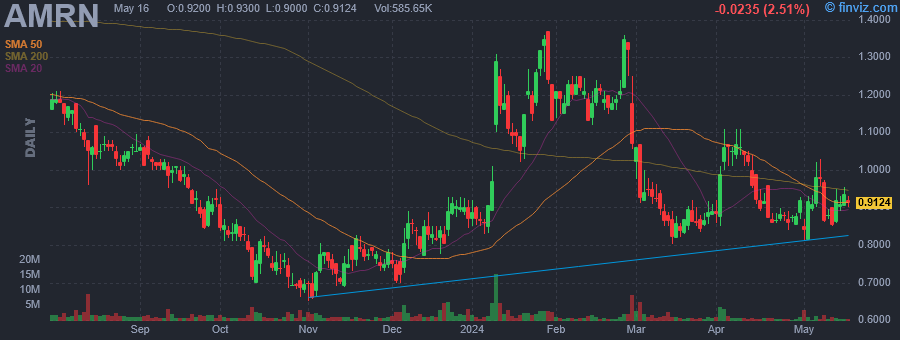
| Analyst Recom | 3.00 | Target Price | 1.00 |
| Avg Volume | 1.52M | 52W Range | 0.65 - 1.49 |
|
|
|
|
Amarin Corp. Plc is a pharmaceutical company, which focuses on the commercialization and development of therapeutics for cardiovascular health. It focuses on the development and commercialization of Vascepa capsules. The company was founded by Geoffrey William Guy on March 1, 1989 and is headquartered in Dublin, Ireland. |
| Insider Trading |
Relationship |
Date |
Transaction |
Cost |
#Shares |
Value ($) |
#Shares Total |
SEC Form 4 |
| Holt Patrick | President and CEO | Jan 22 '24 | Buy | 1.09 | 14,426 | 15,724 | 314,426 | Jan 24 04:31 PM | | Ketchum Steven B | Chief Scientific Officer | Dec 12 '23 | Sale | 0.79 | 34,131 | 26,963 | 566,100 | Dec 14 06:35 PM | | Holt Patrick | President and CEO | Aug 16 '23 | Buy | 1.04 | 300,000 | 312,315 | 300,000 | Aug 16 07:51 PM |
|
|
|
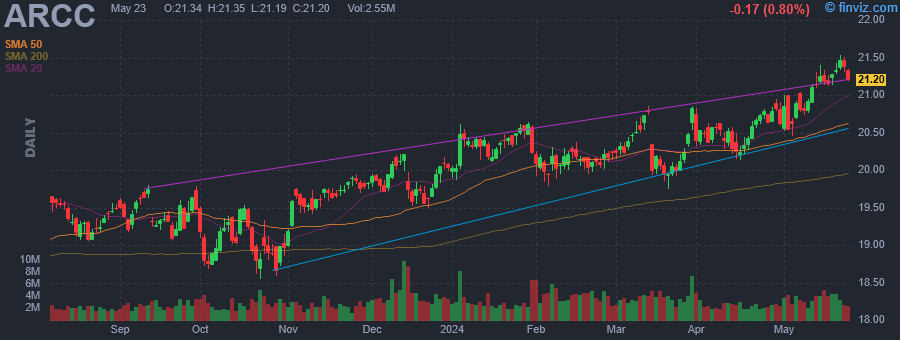 |
| Market Cap | 12.65B | EPS (ttm) | 2.68 |
| P/E | 7.78 | EPS this Y | 0.00% |
| Forward P/E | 9.35 | EPS next Y | -5.90% |
| PEG | - | EPS past 5Y | 6.30% |
| P/S | 4.84 | EPS next 5Y | -0.90% |
| P/B | 1.08 | EPS Q/Q | 137.40% |
| Dividend | 9.21% | Sales Q/Q | 10.50% |
| Insider Own | 0.59% | Inst Own | 29.37% |
| Insider Trans | 0.00% | Inst Trans | - |
| Short Float | 2.81% | Earnings | May 01/b |
| Analyst Recom | 1.90 | Target Price | 21.68 |
| Avg Volume | 3.56M | 52W Range | 17.53 - 20.94 |
|
|
|
|
Ares Capital Corporation is a business development company specializing in acquisition, recapitalization, mezzanine debt, restructurings, rescue financing, and leveraged buyout transactions of middle market companies. It also makes growth capital and general refinancing. It prefers to make investments in companies engaged in the basic and growth manufacturing, business services, consumer products, health care products and services, and information technology service sectors. The fund will also consider investments in industries such as restaurants, retail, oil and gas, and technology sectors. It focuses on investments in Northeast, Mid-Atlantic, Southeast and Southwest regions from its New York office, the Midwest region, from the Chicago office, and the Western region from the Los Angeles office. The fund typically invests between $20 million and $200 million and a maximum of $400 million in companies with an EBITDA between $10 million and $250 million. It makes debt investments between $10 million and $100 million The fund invests through revolvers, first lien loans, warrants, unitranche structures, second lien loans, mezzanine debt, private high yield, junior capital, subordinated debt, and non-control preferred and common equity. The fund also selectively considers third-party-led senior and subordinated debt financings and opportunistically considers the purchase of stressed and discounted debt positions. The fund prefers to be an agent and/or lead the transactions in which it invests. The fund also seeks board representation in its portfolio companies. |
|
| |
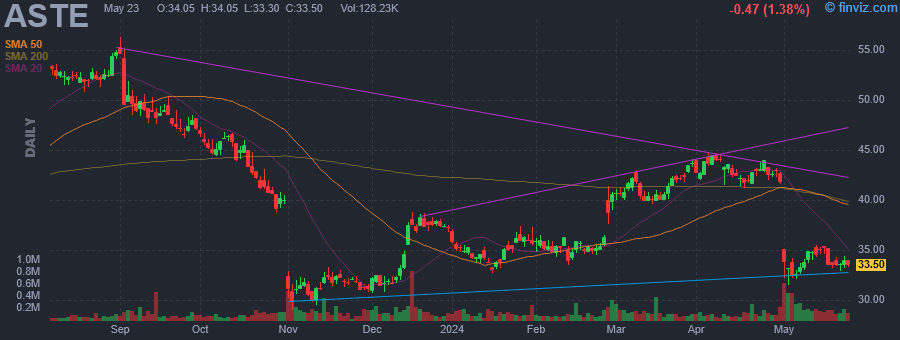 |
| Market Cap | 767.93M | EPS (ttm) | 1.47 |
| P/E | 22.96 | EPS this Y | -14.86% |
| Forward P/E | 11.74 | EPS next Y | 26.54% |
| PEG | 2.30 | EPS past 5Y | - |
| P/S | 0.57 | EPS next 5Y | 10.00% |
| P/B | 1.18 | EPS Q/Q | 1581.86% |
| Dividend | 1.54% | Sales Q/Q | -3.63% |
| Insider Own | 2.06% | Inst Own | 94.01% |
| Insider Trans | 0.00% | Inst Trans | -1.64% |
| Short Float | 1.88% | Earnings | May 01/b |
| Analyst Recom | 2.33 | Target Price | 43.33 |
| Avg Volume | 137.90K | 52W Range | 28.97 - 56.33 |
|
|
|
|
Astec Industries, Inc. engages in the design, engineer, manufacture, and market of equipment and components used in road building and construction activities. It operates through the following segments: Infrastructure Solutions, Material Solutions, and Corporate and Other. The Infrastructure Solutions segment designs, engineers, manufactures, and markets a complete line of asphalt plants, concrete plants, and ancillary equipment, as well as supplying asphalt road construction equipment, industrial thermal systems, and heavy equipment. The Material Solutions segment designs and manufactures heavy processing equipment, in addition to servicing and supplying parts for the aggregate, metallic mining, recycling, ports, and bulk handling industries. The Corporate and Other segment is involved in the controls and automation business, through the firm's parent company, Astec Insurance. The company was founded by J. Don Brock in 1972 and is headquartered in Chattanooga, TN. |
|
|
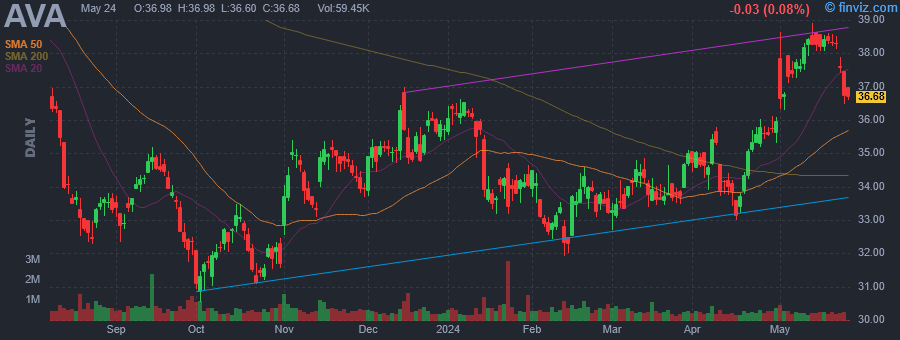 |
| Market Cap | 2.86B | EPS (ttm) | 2.23 |
| P/E | 16.45 | EPS this Y | 7.48% |
| Forward P/E | 14.19 | EPS next Y | 7.27% |
| PEG | 2.65 | EPS past 5Y | 1.58% |
| P/S | 1.64 | EPS next 5Y | 6.20% |
| P/B | 1.15 | EPS Q/Q | 3.60% |
| Dividend | 5.19% | Sales Q/Q | 1.41% |
| Insider Own | 1.01% | Inst Own | 86.06% |
| Insider Trans | -0.39% | Inst Trans | 1.23% |
| Short Float | 3.66% | Earnings | May 01/b |
| Analyst Recom | 3.25 | Target Price | 34.33 |
| Avg Volume | 527.34K | 52W Range | 30.53 - 44.76 |
|
|
|
|
Avista Corp. is a holding company, which engages in the electric and natural gas utility businesses. It operates through the Avista Utilities and Alaska Electric Light and Power Company segments. The Avista Utilities segment includes electric distribution and transmission, and natural gas distribution services in parts of eastern Washington, Northern Idaho, and Northeastern and Southwestern Oregon. The Alaska Electric Light and Power Company segment offers electric services in Juneau. The company was founded on March 13, 1889 and is headquartered in Spokane, WA. |
| Insider Trading |
Relationship |
Date |
Transaction |
Cost |
#Shares |
Value ($) |
#Shares Total |
SEC Form 4 |
| BURKE DONALD C | Director | Dec 01 '23 | Sale | 34.46 | 2,400 | 82,704 | 25,605 | Dec 04 10:22 AM | | KENSOK JAMES M | Vice President - Retired | Nov 15 '23 | Sale | 34.75 | 700 | 24,325 | 12,574 | Nov 15 10:50 AM | | MORRIS SCOTT L | Chairman of the Board | Aug 24 '23 | Buy | 32.39 | 3,100 | 100,424 | 128,169 | Aug 25 11:52 AM | | MEYER DAVID J | Vice President | Aug 09 '23 | Sale | 36.61 | 1,050 | 38,440 | 4,677 | Aug 09 10:56 AM | | MEYER DAVID J | Vice President | Aug 08 '23 | Sale | 36.90 | 1,050 | 38,745 | 5,727 | Aug 09 10:56 AM |
|
|
| |
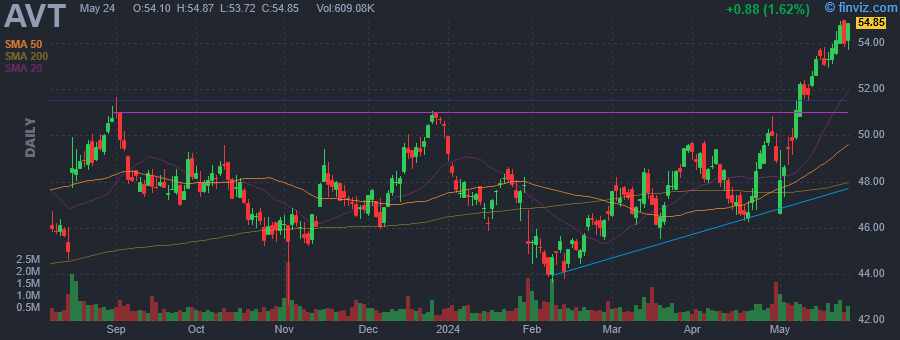 |
| Market Cap | 4.34B | EPS (ttm) | 7.23 |
| P/E | 6.65 | EPS this Y | -36.05% |
| Forward P/E | 8.57 | EPS next Y | 8.81% |
| PEG | 0.64 | EPS past 5Y | - |
| P/S | 0.17 | EPS next 5Y | 10.40% |
| P/B | 0.86 | EPS Q/Q | -51.14% |
| Dividend | 2.58% | Sales Q/Q | -7.63% |
| Insider Own | 0.80% | Inst Own | 98.24% |
| Insider Trans | -2.34% | Inst Trans | -3.32% |
| Short Float | 3.10% | Earnings | May 01/b |
| Analyst Recom | 3.25 | Target Price | 48.17 |
| Avg Volume | 587.69K | 52W Range | 40.00 - 51.65 |
|
|
|
|
Avnet, Inc. engages in the distribution and sale of electronic components. It operates through the Electronic Components and Farnell segments. The Electronic Components segment markets and sells semiconductors, interconnect, passive and electromechanical devices, and integrated components. The Farnell segment is involved in the distribution of electronic components and related products to the electronic system design community utilizing multi-channel sales and marketing resources. The company was founded by Charles Avnet in 1921 and is headquartered in Phoenix, AZ. |
| Insider Trading |
Relationship |
Date |
Transaction |
Cost |
#Shares |
Value ($) |
#Shares Total |
SEC Form 4 |
| Obregon-Jimenez Rebeca | SVP | Feb 22 '24 | Sale | 46.04 | 2,210 | 101,748 | 14,281 | Feb 22 04:16 PM | | LAWRENCE JAMES A | Director | Nov 24 '23 | Sale | 47.30 | 8,190 | 387,387 | 0 | Nov 27 04:16 PM | | LAWRENCE JAMES A | Director | Nov 21 '23 | Sale | 47.68 | 6,910 | 329,469 | 8,190 | Nov 22 04:18 PM | | GALLAGHER PHILIP R | Chief Executive Officer | May 15 '23 | Option Exercise | 0.00 | 32,740 | 0 | 209,074 | May 16 04:45 PM | | GALLAGHER PHILIP R | Chief Executive Officer | May 15 '23 | Sale | 41.35 | 32,740 | 1,353,799 | 176,334 | May 16 04:45 PM |
|
|
|
 |
| Market Cap | 7.55B | EPS (ttm) | 1.21 |
| P/E | 28.38 | EPS this Y | 23.98% |
| Forward P/E | 15.52 | EPS next Y | 13.21% |
| PEG | 1.81 | EPS past 5Y | 7.16% |
| P/S | 1.46 | EPS next 5Y | 15.70% |
| P/B | 4.36 | EPS Q/Q | 68.14% |
| Dividend | 0.24% | Sales Q/Q | 4.90% |
| Insider Own | 0.38% | Inst Own | 98.42% |
| Insider Trans | -4.65% | Inst Trans | 0.07% |
| Short Float | 3.04% | Earnings | May 01/b |
| Analyst Recom | 1.80 | Target Price | 38.58 |
| Avg Volume | 2.22M | 52W Range | 25.03 - 34.53 |
|
|
|
|
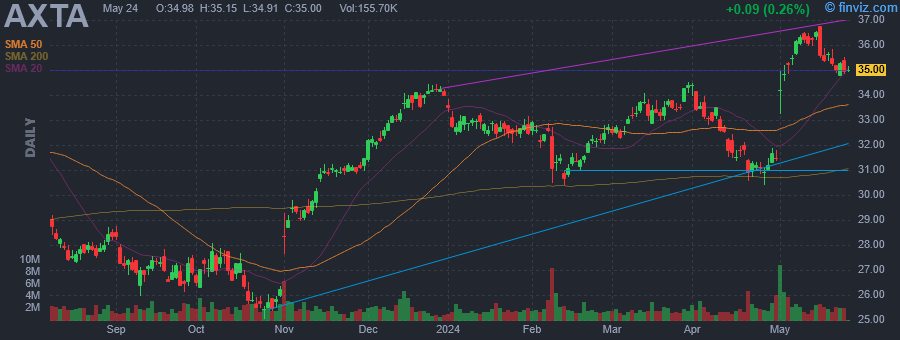
Axalta Coating Systems Ltd. engages in the manufacture, marketing and distribution of coatings systems. It operates through the Performance Coatings and Mobility Coatings segments. The Performance Coatings segment provides liquid and powder coatings solutions to a fragmented and local customer base. The Mobility Coatings segment offers coatings technologies to original equipment manufacturers of light and commercial vehicles. The company was founded in 1866 and is headquartered in Philadelphia, PA. |
| Insider Trading |
Relationship |
Date |
Transaction |
Cost |
#Shares |
Value ($) |
#Shares Total |
SEC Form 4 |
| Awada Hadi | SVP, Glbl Mobility Coatings | Dec 04 '23 | Sale | 31.99 | 10,500 | 335,895 | 14,656 | Dec 05 05:14 PM | | BERUBE BRIAN A | SVP and General Counsel | Nov 17 '23 | Sale | 31.19 | 7,500 | 233,925 | 44,408 | Nov 17 06:55 PM | | Massey Anthony | VP, Global Controller, PAO | Nov 14 '23 | Option Exercise | 9.65 | 14,601 | 140,846 | 37,335 | Nov 15 05:50 PM | | Massey Anthony | VP, Global Controller, PAO | Nov 14 '23 | Sale | 30.88 | 17,915 | 553,215 | 19,420 | Nov 15 05:50 PM | | MCLAUGHLIN ROBERT M | Director | Nov 09 '23 | Sale | 29.77 | 5,000 | 148,850 | 92,649 | Nov 13 04:39 PM |
|
|
|
 |
| Market Cap | 12.72B | EPS (ttm) | 0.14 |
| P/E | 189.86 | EPS this Y | 403.69% |
| Forward P/E | 25.91 | EPS next Y | 50.65% |
| PEG | 12.09 | EPS past 5Y | -19.92% |
| P/S | 0.71 | EPS next 5Y | 15.70% |
| P/B | 2.39 | EPS Q/Q | -1231.37% |
| Dividend | 5.88% | Sales Q/Q | 34.03% |
| Insider Own | 0.57% | Inst Own | 59.54% |
| Insider Trans | 0.00% | Inst Trans | 3.61% |
| Short Float | 0.28% | Earnings | May 01/b |
| Analyst Recom | 1.36 | Target Price | 38.00 |
| Avg Volume | 533.08K | 52W Range | 21.03 - 37.32 |
|
|
|
|
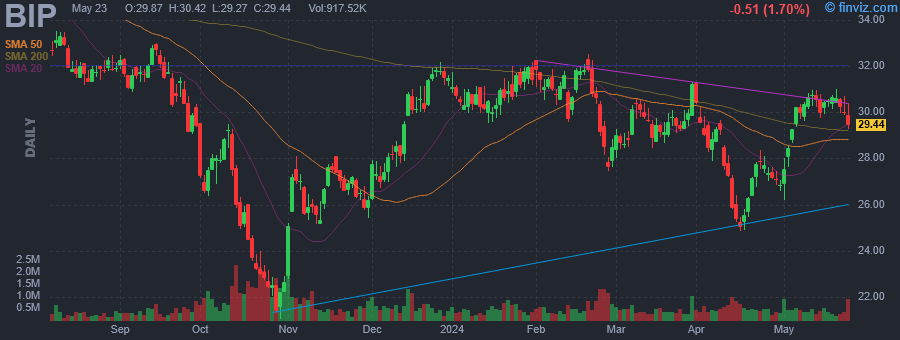
Brookfield Infrastructure Partners LP operates as an infrastructure company, which engages in the management of diversified portfolio of infrastructure assets that will generate sustainable and growing distributions over the long-term for unit holders. It operates through the following segments: Utilities, Transport, Midstream, and Data. The Utilities segment includes regulation of business which earns a return on asset base. The Transport segment is involved in transportation for freight, bulk commodities, and passenger. The Midstream segment offers systems that give energy transmission, gathering, processing, and storage services. The Data Infrastructure segment includes critical infrastructure and services to global communication companies. The company was founded in July 1905 and is headquartered in Hamilton, Bermuda. |
|
|
