 |
| Market Cap | 3.22B | EPS (ttm) | -2.18 |
| P/E | - | EPS this Y | 26.23% |
| Forward P/E | - | EPS next Y | 37.61% |
| PEG | - | EPS past 5Y | -13.04% |
| P/S | 5.21 | EPS next 5Y | - |
| P/B | 4.33 | EPS Q/Q | -175.27% |
| Dividend | - | Sales Q/Q | 17.76% |
| Insider Own | 17.70% | Inst Own | 80.54% |
| Insider Trans | -0.27% | Inst Trans | -1.00% |
| Short Float | 9.00% | Earnings | Apr 30/a |
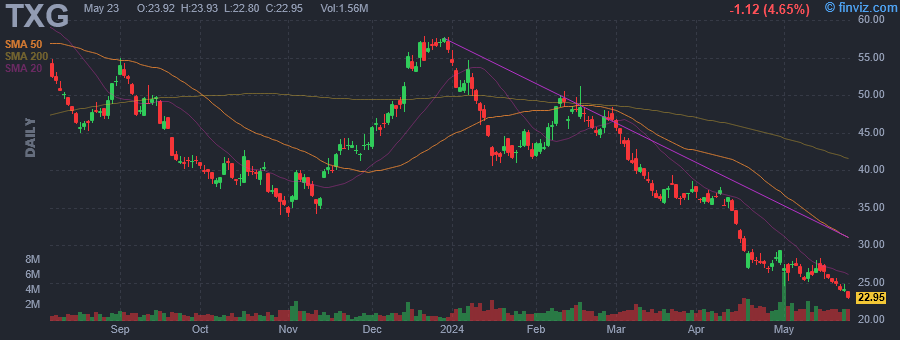
| Analyst Recom | 1.88 | Target Price | 41.82 |
| Avg Volume | 1.46M | 52W Range | 26.30 - 63.57 |
|
|
| May-01-24 | Downgrade |
TD Cowen |
Buy → Hold |
$57 → $32 |
|
|
|
10X Genomics, Inc. is a life science technology company, which engages in building products to interrogate, understand and master biology. Its integrated solutions include single cell transcriptomics, single cell genomics, single cell epigenomes, linked-reads genomics and spatial transcriptomics. The company's products include Single Cell Gene Expression, Immune Profiling, ATAC, and Genome. The company was founded by Serge Saxonov, Ben Hindson and Kevin D. Ness on July 2, 2012 and is headquartered in Pleasanton, CA. |
| Insider Trading |
Relationship |
Date |
Transaction |
Cost |
#Shares |
Value ($) |
#Shares Total |
SEC Form 4 |
| Saxonov Serge | Chief Executive Officer | Mar 04 '24 | Sale | 44.00 | 4,660 | 205,021 | 842,900 | Mar 06 04:12 PM | | Saxonov Serge | Chief Executive Officer | Feb 22 '24 | Sale | 46.34 | 2,821 | 130,737 | 847,560 | Feb 26 04:13 PM | | Hindson Benjamin J. | See Remarks | Feb 22 '24 | Sale | 46.34 | 2,613 | 121,098 | 283,059 | Feb 26 04:12 PM | | McAnear Justin J. | Chief Financial Officer | Feb 22 '24 | Sale | 46.34 | 1,865 | 86,432 | 95,240 | Feb 26 04:12 PM | | Saxonov Serge | Chief Executive Officer | Feb 15 '24 | Sale | 48.87 | 5,000 | 244,332 | 850,381 | Feb 20 04:20 PM |
|
|
 |
 |
| Market Cap | 45.07B | EPS (ttm) | 4.20 |
| P/E | 50.12 | EPS this Y | 6.15% |
| Forward P/E | 23.12 | EPS next Y | 12.96% |
| PEG | 4.13 | EPS past 5Y | - |
| P/S | 8.28 | EPS next 5Y | 12.14% |
| P/B | 30.43 | EPS Q/Q | -2.98% |
| Dividend | - | Sales Q/Q | 13.52% |
| Insider Own | 0.28% | Inst Own | 92.39% |
| Insider Trans | -12.87% | Inst Trans | 2.06% |
| Short Float | 1.04% | Earnings | Feb 29/a |
| Analyst Recom | 2.07 | Target Price | 287.05 |
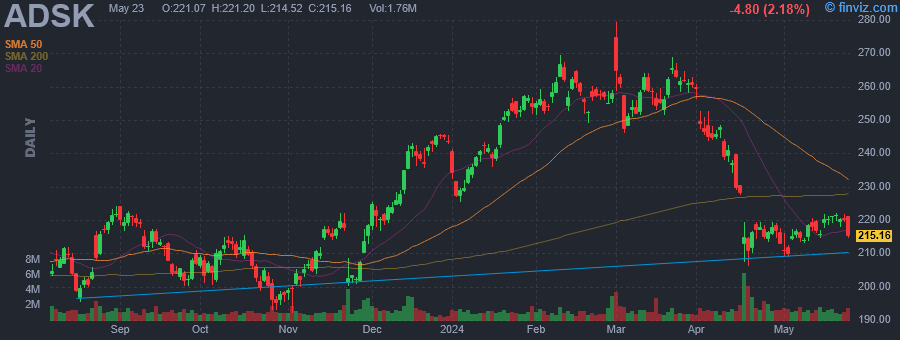
| Avg Volume | 1.56M | 52W Range | 189.54 - 279.53 |
|
|
| May-01-24 | Downgrade |
Berenberg |
Buy → Hold |
$295 |
|
|
|
Autodesk, Inc. engages in the design of software and services. Its products include AutoCAD, BIM 360, Civil 3D, Fusion 360, InfraWorks, Inventor, Maya, PlanGrid, Revit, Shotgun, and 3ds Max. The firm also offers product development and manufacturing software, which provides manufacturers in the automotive, transportation, industrial machinery, consumer products, and building product industries with comprehensive digital design, engineering, and production solutions. Its architecture, engineering, and construction software improves the way buildings, factories, and infrastructure are designed, built, and used. The firm is also involved in digital media and entertainment, which consists of tools for digital sculpting, modeling, animation, effects, rendering, and compositing for design visualization, visual effects, and games production. The company was founded by John Walker in April 1982 and is headquartered in San Francisco, CA. |
| Insider Trading |
Relationship |
Date |
Transaction |
Cost |
#Shares |
Value ($) |
#Shares Total |
SEC Form 4 |
| Hope Stephen W. | SVP & Chief Accounting Officer | Apr 02 '24 | Sale | 249.69 | 75 | 18,727 | 3,450 | Apr 02 05:30 PM | | Anagnost Andrew | President and CEO | Mar 27 '24 | Sale | 259.99 | 21,053 | 5,473,609 | 105,213 | Mar 28 07:24 PM | | Clifford Deborah | EVP, Chief Financial Officer | Mar 27 '24 | Sale | 260.01 | 5,553 | 1,443,821 | 32,259 | Mar 28 07:27 PM | | Hope Stephen W. | SVP & Chief Accounting Officer | Mar 27 '24 | Sale | 260.47 | 1,757 | 457,646 | 3,450 | Mar 28 07:31 PM | | MCDOWELL MARY T | Director | Mar 15 '24 | Sale | 256.66 | 550 | 141,163 | 33,216 | Mar 15 05:37 PM |
|
|
|
 |
| Market Cap | 5.12B | EPS (ttm) | 5.56 |
| P/E | 9.59 | EPS this Y | -3.44% |
| Forward P/E | 8.12 | EPS next Y | 7.81% |
| PEG | 4.22 | EPS past 5Y | 43.74% |
| P/S | 1.37 | EPS next 5Y | 2.27% |
| P/B | 3.02 | EPS Q/Q | -27.33% |
| Dividend | 1.25% | Sales Q/Q | -0.36% |
| Insider Own | 22.87% | Inst Own | 68.39% |
| Insider Trans | -4.59% | Inst Trans | -4.30% |
| Short Float | 4.11% | Earnings | Apr 25/a |
| Analyst Recom | 2.19 | Target Price | 70.73 |
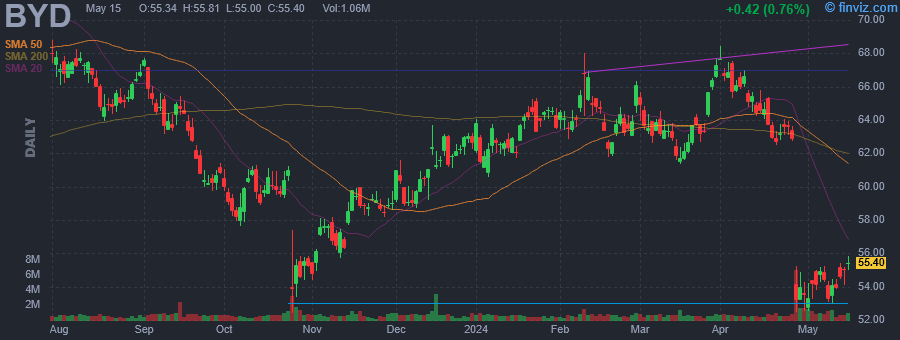
| Avg Volume | 882.88K | 52W Range | 52.42 - 73.00 |
|
|
| May-01-24 | Downgrade |
Argus |
Buy → Hold |
|
|
|
|
Boyd Gaming Corp. is a multi-jurisdictional gaming company, which engages in the management and operation of gaming and entertainment properties. It operates through the following segments: Las Vegas Locals, Downtown Las Vegas, Midwest and South, and Online. The Las Vegas Locals segment consists of eight casinos that primarily serve the resident population in the Las Vegas metropolitan area. The Downtown Las Vegas segment refers to the following casinos: California Hotel and Casino, Fremont Hotel and Casino, and Main Street Station Hotel and Casino. The Midwest and South segment includes four land-based casinos, six dockside riverboat casinos, three racinos, and four barge-based casinos that operate in nine states in the Midwest and southern United States. The Online segment includes the operating results of online gaming operations. The company was founded by William Samuel Boyd and Sam Boyd on January 1, 1975 and is headquartered in Las Vegas, NV. |
| Insider Trading |
Relationship |
Date |
Transaction |
Cost |
#Shares |
Value ($) |
#Shares Total |
SEC Form 4 |
| BOYD WILLIAM S | 10% Owner | Mar 14 '24 | Sale | 62.10 | 32,703 | 2,030,856 | 8,762,746 | Mar 15 06:20 PM | | BOYD WILLIAM S | 10% Owner | Mar 13 '24 | Sale | 63.12 | 63,464 | 4,005,848 | 8,795,449 | Mar 15 06:20 PM | | BOYD WILLIAM S | 10% Owner | Mar 12 '24 | Sale | 63.27 | 125,000 | 7,908,750 | 8,858,913 | Mar 13 04:31 PM | | BOYD WILLIAM S | 10% Owner | Mar 08 '24 | Sale | 63.29 | 125,000 | 7,911,250 | 8,983,913 | Mar 11 06:29 PM | | BOYD WILLIAM S | 10% Owner | Mar 07 '24 | Sale | 63.72 | 125,000 | 7,965,000 | 9,108,913 | Mar 08 05:18 PM |
|
|
| |
 |
| Market Cap | 1.90B | EPS (ttm) | 14.32 |
| P/E | 2.68 | EPS this Y | -53.81% |
| Forward P/E | 5.49 | EPS next Y | 2.60% |
| PEG | 0.52 | EPS past 5Y | -3.85% |
| P/S | 0.38 | EPS next 5Y | 5.17% |
| P/B | 0.65 | EPS Q/Q | 132.28% |
| Dividend | 2.19% | Sales Q/Q | 2.12% |
| Insider Own | 2.22% | Inst Own | 101.45% |
| Insider Trans | -44.23% | Inst Trans | 0.88% |
| Short Float | 7.51% | Earnings | Apr 25/b |
| Analyst Recom | 3.06 | Target Price | 36.69 |
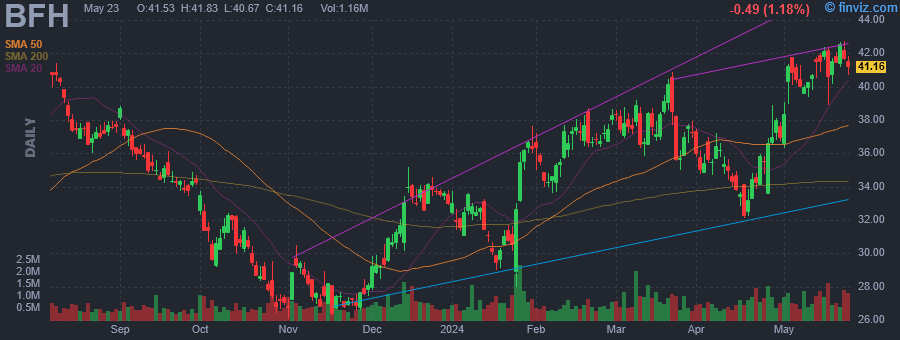
| Avg Volume | 763.47K | 52W Range | 23.19 - 41.89 |
|
|
| May-01-24 | Downgrade |
Argus |
Buy → Hold |
|
|
|
|
Bread Financial Holdings, Inc. engages in the provision of payment, lending, and saving solutions. The firm also offers private label and co-brand credit cards and buy now, pay later products such as installment loans and split-pay offerings. The company was founded in 1996 and is headquartered in Columbus, OH. |
| Insider Trading |
Relationship |
Date |
Transaction |
Cost |
#Shares |
Value ($) |
#Shares Total |
SEC Form 4 |
| Turtle Creek Asset Management | 10% Owner | Jan 29 '24 | Sale | 35.67 | 45,000 | 1,605,247 | 293,092 | Jan 29 09:18 PM | | Turtle Creek Asset Management | 10% Owner | Jan 26 '24 | Sale | 35.53 | 30,000 | 1,065,834 | 295,787 | Jan 26 07:21 PM | | Turtle Creek Asset Management | 10% Owner | Jan 25 '24 | Sale | 32.23 | 30,000 | 966,977 | 297,583 | Jan 26 07:21 PM | | Turtle Creek Asset Management | 10% Owner | Jan 24 '24 | Sale | 30.82 | 30,000 | 924,576 | 299,380 | Jan 26 07:21 PM | | Turtle Creek Asset Management | 10% Owner | Jan 23 '24 | Sale | 31.12 | 30,000 | 933,480 | 301,176 | Jan 23 07:52 PM |
|
|
|
 |
| Market Cap | 694.21M | EPS (ttm) | 0.62 |
| P/E | 40.48 | EPS this Y | 290.00% |
| Forward P/E | 27.87 | EPS next Y | 15.38% |
| PEG | - | EPS past 5Y | 1.34% |
| P/S | 6.04 | EPS next 5Y | - |
| P/B | 1.36 | EPS Q/Q | 135.92% |
| Dividend | 7.38% | Sales Q/Q | 7.94% |
| Insider Own | 4.01% | Inst Own | 88.58% |
| Insider Trans | 0.00% | Inst Trans | -3.54% |
| Short Float | 1.25% | Earnings | Apr 30/a |
| Analyst Recom | 2.00 | Target Price | 30.00 |
| Avg Volume | 180.93K | 52W Range | 24.50 - 37.15 |
|
|
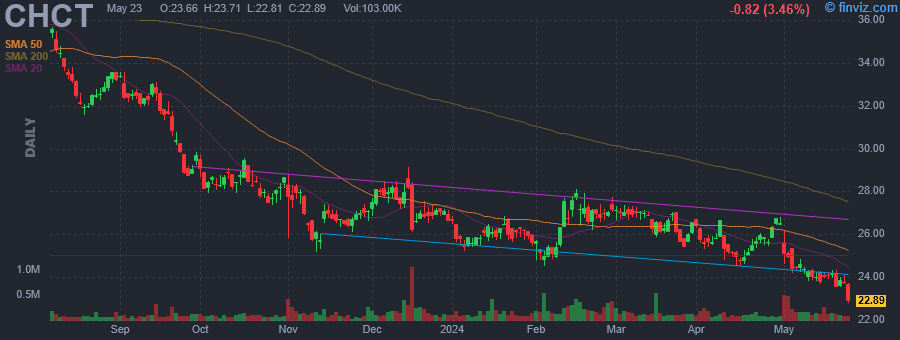
| May-01-24 | Downgrade |
Piper Sandler |
Overweight → Neutral |
$36 → $26 |
|
|
|
Community Healthcare Trust, Inc. is a healthcare real estate company. It engages in acquiring real estate properties that are leased to hospitals, doctors, healthcare systems or other healthcare service providers. The company was founded by Timothy G. Wallace on March 28, 2014, and is headquartered in Franklin, TN. |
|
| |
 |
| Market Cap | 218.59M | EPS (ttm) | -2.48 |
| P/E | - | EPS this Y | -30.65% |
| Forward P/E | - | EPS next Y | 25.51% |
| PEG | - | EPS past 5Y | -27.17% |
| P/S | 5.19 | EPS next 5Y | - |
| P/B | 3.30 | EPS Q/Q | -90.12% |
| Dividend | - | Sales Q/Q | 34.98% |
| Insider Own | 55.51% | Inst Own | 27.89% |
| Insider Trans | -0.05% | Inst Trans | -5.10% |
| Short Float | 8.18% | Earnings | Apr 30/a |
| Analyst Recom | 1.67 | Target Price | 16.60 |
| Avg Volume | 129.78K | 52W Range | 9.92 - 33.13 |
|
|
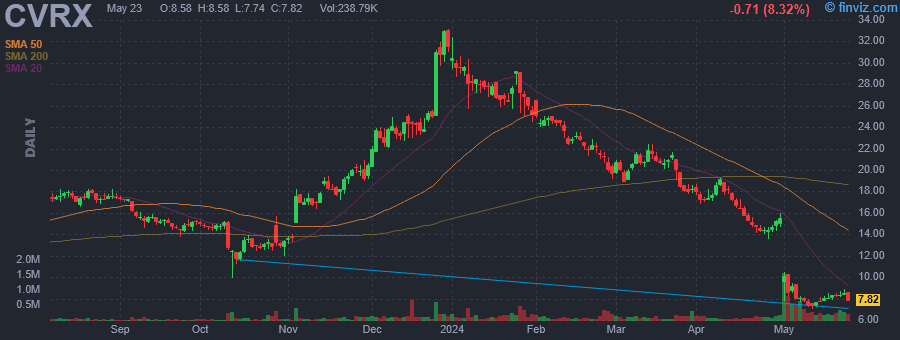
| May-01-24 | Downgrade |
William Blair |
Outperform → Mkt Perform |
|
| May-01-24 | Downgrade |
JP Morgan |
Overweight → Neutral |
$36 → $13 |
| May-01-24 | Resumed |
Craig Hallum |
Buy |
$30 → $23 |
|
|
|
CVRx, Inc. engages in developing, manufacturing, and commercializing neuromodulation solutions for patients with cardiovascular diseases. It operates through the United States, Germany, and Other Countries geographical segments. The company was founded by Robert S. Kieval and Tyler P. Lipschultz in August 2001 and is headquartered in Minneapolis, MN. |
| Insider Trading |
Relationship |
Date |
Transaction |
Cost |
#Shares |
Value ($) |
#Shares Total |
SEC Form 4 |
| Palmer Craig E. | SVP, U.S. SALES | Mar 25 '24 | Option Exercise | 0.24 | 934 | 221 | 1,229 | Mar 27 04:56 PM | | JOHNSON & JOHNSON | 10% Owner | Feb 29 '24 | Option Exercise | 0.72 | 3,855 | 2,792 | 4,103,430 | Mar 06 03:42 PM | | VERRASTRO PAUL | CHIEF MKTG & STRAT OFFICER | Feb 20 '24 | Option Exercise | 5.14 | 5,000 | 25,705 | 5,000 | Feb 22 06:05 PM | | VERRASTRO PAUL | CHIEF MKTG & STRAT OFFICER | Feb 20 '24 | Sale | 21.91 | 2,545 | 55,748 | 2,455 | Feb 22 06:05 PM | | JOHNSON & JOHNSON | 10% Owner | Feb 16 '24 | Sale | 25.81 | 3,725 | 96,142 | 4,099,575 | Mar 06 03:42 PM |
|
|
|
 |
| Market Cap | 70.86B | EPS (ttm) | 6.47 |
| P/E | 8.71 | EPS this Y | -10.88% |
| Forward P/E | 6.48 | EPS next Y | 11.63% |
| PEG | 2.36 | EPS past 5Y | - |
| P/S | 0.20 | EPS next 5Y | 3.69% |
| P/B | 0.95 | EPS Q/Q | -9.33% |
| Dividend | 4.40% | Sales Q/Q | 12.02% |
| Insider Own | 0.17% | Inst Own | 81.97% |
| Insider Trans | -1.27% | Inst Trans | 0.60% |
| Short Float | 1.43% | Earnings | May 01/b |
| Analyst Recom | 1.76 | Target Price | 81.41 |
| Avg Volume | 9.40M | 52W Range | 64.41 - 83.25 |
|
|
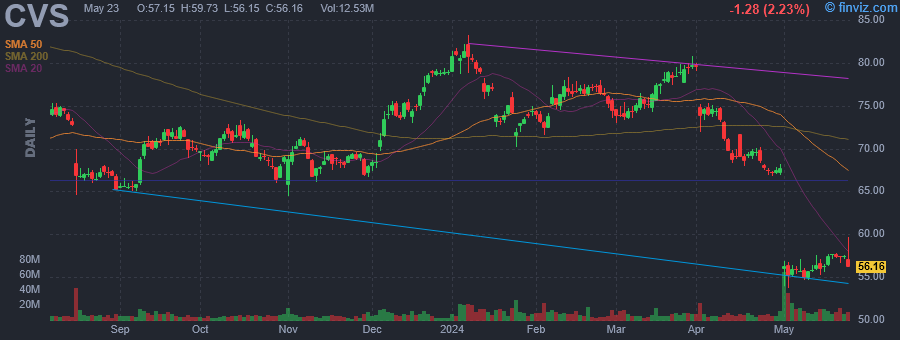
| May-01-24 | Downgrade |
Leerink Partners |
Outperform → Market Perform |
$87 → $60 |
| May-01-24 | Downgrade |
Cantor Fitzgerald |
Overweight → Neutral |
|
|
|
|
CVS Health Corp. is a health solutions company, which engages in the provision of healthcare services. It operates through the following segments: Health Care Benefits, Health Services, Pharmacy and Consumer Wellness, and Corporate and Other. The Health Care Benefits segment operates as a health care benefits provider. The Health Services segment offers a full range of PBM solutions, delivers health care services in its medical clinics, virtually, and in the home. The Pharmacy & Consumer Wellness segment dispenses prescriptions in its retail pharmacies and through its infusion operations. The Corporate and Other Segment is involved in management and administrative expenses. The company was founded by Stanley P. Goldstein and Ralph Hoagland in 1963 and is headquartered in Woonsocket, RI. |
| Insider Trading |
Relationship |
Date |
Transaction |
Cost |
#Shares |
Value ($) |
#Shares Total |
SEC Form 4 |
| Shah Prem S | EVP and Pres-Pharm, Consumer W | Feb 16 '24 | Sale | 76.95 | 29,473 | 2,267,947 | 39,765 | Feb 16 06:46 PM | | LUDWIG EDWARD J | Director | Nov 03 '23 | Buy | 70.47 | 2,000 | 140,930 | 20,630 | Nov 06 10:59 AM | | Clark James David | SVP, Cont & Chief Acct Officer | Aug 03 '23 | Sale | 74.92 | 25,759 | 1,930,004 | 4,698 | Aug 04 05:41 PM | | Lynch Karen S | President and CEO | May 03 '23 | Buy | 69.75 | 14,000 | 976,567 | 431,392 | May 05 08:27 AM |
|
|
| |
 |
| Market Cap | 12.16B | EPS (ttm) | 3.88 |
| P/E | 20.37 | EPS this Y | -6.04% |
| Forward P/E | 17.54 | EPS next Y | 12.78% |
| PEG | 1.91 | EPS past 5Y | 20.00% |
| P/S | 2.83 | EPS next 5Y | 10.69% |
| P/B | 5.44 | EPS Q/Q | 316.50% |
| Dividend | 1.52% | Sales Q/Q | 5.35% |
| Insider Own | 0.83% | Inst Own | 62.99% |
| Insider Trans | -2.43% | Inst Trans | -14.35% |
| Short Float | 1.68% | Earnings | Apr 30/b |
| Analyst Recom | 2.89 | Target Price | 86.74 |
| Avg Volume | 453.93K | 52W Range | 53.91 - 96.66 |
|
|
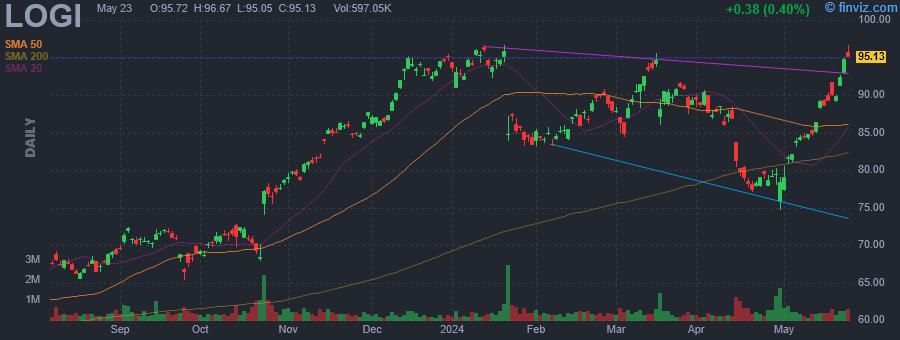
| May-01-24 | Downgrade |
JP Morgan |
Overweight → Neutral |
$92 → $85 |
|
|
|
Logitech International SA is a holding company, which engages in the design, manufacture, and marketing of peripherals for PCs, tablets, and other digital platforms. Its products include mice, keyboards, presentation remotes, headsets, and speakers. The firm offers solutions for healthy computing, wireless charging, streaming, virtual reality, schools, healthcare, and software and apps. Its brands include Logitech, Jaybird, Ultimate Ears, Logitech G, ASTRO Gaming, and Blue Microphones. The company was founded by Daniel Borel, Pierluigi Zappacosta, and Giacamo Marini on October 2, 1981 and is headquartered in Lausanne, Switzerland. |
| Insider Trading |
Relationship |
Date |
Transaction |
Cost |
#Shares |
Value ($) |
#Shares Total |
SEC Form 4 |
| Harnett Samantha | CHIEF LEGAL OFFICER | Apr 08 '24 | Sale | 88.18 | 100 | 8,818 | 11,710 | Apr 08 08:13 PM | | Harnett Samantha | CHIEF LEGAL OFFICER | Mar 11 '24 | Sale | 90.46 | 100 | 9,046 | 11,810 | Mar 11 06:40 PM | | Arunkundrum Prakash | CHIEF OPERATING OFFICER | Feb 26 '24 | Option Exercise | 38.65 | 16,231 | 627,328 | 84,079 | Feb 27 09:30 PM | | Arunkundrum Prakash | CHIEF OPERATING OFFICER | Feb 26 '24 | Sale | 90.00 | 23,023 | 2,072,070 | 61,056 | Feb 27 09:30 PM | | Arunkundrum Prakash | CHIEF OPERATING OFFICER | Feb 23 '24 | Sale | 90.00 | 699 | 62,910 | 67,848 | Feb 27 09:30 PM |
|
|
|
 |
| Market Cap | 2.90B | EPS (ttm) | -0.78 |
| P/E | - | EPS this Y | 85.02% |
| Forward P/E | - | EPS next Y | 54.25% |
| PEG | - | EPS past 5Y | - |
| P/S | 3.30 | EPS next 5Y | 0.21% |
| P/B | 1.27 | EPS Q/Q | -43.99% |
| Dividend | 5.14% | Sales Q/Q | -0.99% |
| Insider Own | 0.70% | Inst Own | 88.77% |
| Insider Trans | -14.10% | Inst Trans | -3.20% |
| Short Float | 5.64% | Earnings | Apr 30/b |
| Analyst Recom | 3.47 | Target Price | 15.62 |
| Avg Volume | 2.06M | 52W Range | 8.90 - 17.69 |
|
|
| May-01-24 | Downgrade |
Piper Sandler |
Neutral → Underweight |
$17 → $11 |
|
|
|
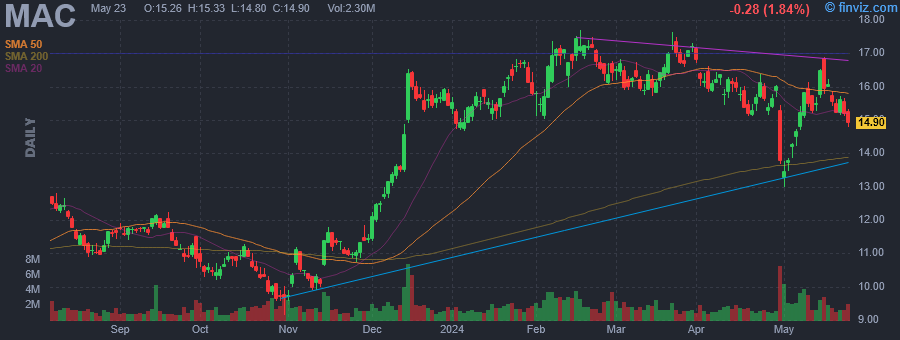
Macerich Co. operates as a real estate investment trust, which engages in the acquisition, ownership, development, redevelopment, management, and leasing of regional and community shopping centers located throughout the United States. The company was founded by Mace Siegel Dana K. Anderson, Arthur M. Coppola and Edward C. Coppola in 1964 and is headquartered in Santa Monica, CA. |
| Insider Trading |
Relationship |
Date |
Transaction |
Cost |
#Shares |
Value ($) |
#Shares Total |
SEC Form 4 |
| COPPOLA EDWARD C | Director | Mar 28 '24 | Sale | 17.19 | 75,000 | 1,289,250 | 560,667 | Mar 29 04:53 PM | | COPPOLA EDWARD C | Director | Mar 27 '24 | Sale | 17.01 | 20,000 | 340,200 | 635,667 | Mar 29 04:53 PM | | O HERN THOMAS E | Director | Mar 20 '24 | Sale | 16.94 | 95,000 | 1,609,300 | 102,900 | Mar 22 06:07 PM | | O HERN THOMAS E | Director | Mar 14 '24 | Sale | 16.39 | 7,964 | 130,530 | 0 | Mar 18 06:09 PM | | COPPOLA EDWARD C | President | Feb 20 '24 | Sale | 17.20 | 50,000 | 860,045 | 655,667 | Feb 22 07:28 PM |
|
|
|
 |
| Market Cap | 14.49B | EPS (ttm) | 5.33 |
| P/E | 16.96 | EPS this Y | -26.72% |
| Forward P/E | 13.59 | EPS next Y | 6.43% |
| PEG | 1.13 | EPS past 5Y | 4.11% |
| P/S | 3.19 | EPS next 5Y | 15.00% |
| P/B | 2.32 | EPS Q/Q | -21.70% |
| Dividend | 3.03% | Sales Q/Q | -9.29% |
| Insider Own | 0.36% | Inst Own | 86.73% |
| Insider Trans | -5.36% | Inst Trans | 1.45% |
| Short Float | 4.48% | Earnings | Apr 30/a |
| Analyst Recom | 2.67 | Target Price | 102.32 |
| Avg Volume | 2.40M | 52W Range | 85.06 - 115.69 |
|
|
| May-01-24 | Downgrade |
TD Cowen |
Buy → Hold |
$125 → $90 |
| May-01-24 | Downgrade |
Susquehanna |
Positive → Neutral |
$125 → $90 |
| May-01-24 | Downgrade |
The Benchmark Company |
Buy → Hold |
|
|
|
May-01-24 07:52PM
|
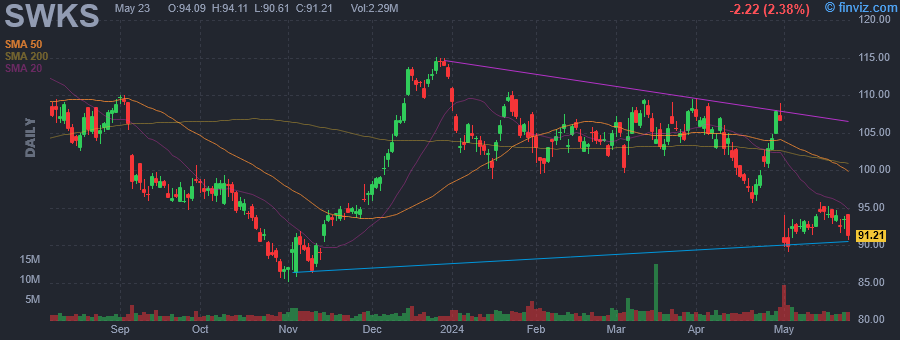
Analyst Report: Skyworks Solutions, Inc.
(Morningstar Research) -15.28% |
|
05:04PM
|
Qualcomm Delivers Beat-And-Raise Report As Diversification Efforts Pay Off
(Investor's Business Daily) |
|
04:54PM
|
S&P 500 Gains and Losses Today: CVS Falls as Health Care Costs Pressure Profits
(Investopedia) |
|
04:52PM
|
Nvidia Stock Drops After Rival AMD Gives Uninspiring Outlook
(Investor's Business Daily) |
|
04:30PM
|
These Stocks Moved the Most Today: CVS, AMD, Super Micro, Amazon, Starbucks, Pfizer, Norwegian, Pinterest, DuPont, and More
(Barrons.com) |
|
02:54PM
|
These Stocks Are Moving the Most Today: CVS, AMD, Super Micro, Amazon, Starbucks, Pfizer, Norwegian, Pinterest, DuPont, and More
(Barrons.com) |
|
02:38PM
|
Argus Cuts Skyworks Solutions Price Target to $120 From $140
(MT Newswires) |
|
01:13PM
|
Skyworks Shares Tumble Following Q2 Results, Analyst Downgrades
(MT Newswires) |
|
12:43PM
|
UBS Cuts Skyworks Solutions Price Target to $100 From $110, Maintains Neutral Rating
(MT Newswires) |
|
12:09PM
|
Why Skyworks Solutions (SWKS) Stock Is Trading Lower Today
(StockStory) |
|
Skyworks Solutions, Inc. engages in the design, development, and manufacture of proprietary semiconductor products. Its products include amplifiers, attenuators, circulators, demodulators, detectors, diodes, directional couplers, front-end modules, hybrids, isolators, lighting and display solutions, mixers, modulators, optocouplers, opt isolators, phase shifters, synthesizers, power dividers and combiners, receivers, switches, and technical ceramics. The company was founded in 1962 and is headquartered in Irvine, CA. |
| Insider Trading |
Relationship |
Date |
Transaction |
Cost |
#Shares |
Value ($) |
#Shares Total |
SEC Form 4 |
| Durham Karilee A | SVP, Human Resources | Dec 14 '23 | Sale | 110.00 | 3,189 | 350,790 | 17,323 | Dec 15 06:38 PM | | Kasnavi Reza | SVP, Tech. & Manufacturing | Nov 17 '23 | Sale | 94.04 | 5,289 | 497,378 | 19,078 | Nov 20 06:30 PM | | TERRY ROBERT JOHN | SVP, Gen. Counsel & Secretary | Nov 14 '23 | Sale | 91.65 | 4,457 | 408,497 | 14,045 | Nov 16 06:30 PM | | Kasnavi Reza | SVP, Tech. & Manufacturing | Nov 13 '23 | Sale | 89.09 | 3,873 | 345,046 | 24,367 | Nov 14 06:47 PM | | TERRY ROBERT JOHN | SVP, Gen. Counsel & Secretary | Nov 09 '23 | Sale | 88.18 | 3,156 | 278,296 | 11,487 | Nov 09 07:42 PM |
|
|
|
