Moving Averages
A moving average is one of the most flexible as well as most-commonly used technical analysis indicators. It is highly popular among traders, mostly because of its simplicity. It works best in a trending environment.
Introduction
In statistics, a moving average is simply a mean of a certain set of data. In case of technical analysis, these data are in most cases represented by closing prices of stocks for the particular days. However, some traders also use separate averages for daily minima and maxima or even an average of midpoint values (which they compute by summing up daily minimum and maximum and dividing by it two). Yet, you can construct a moving average also on a shorter time-frame, for example by using daily- or minute- data.
For example, if you want to make a 10-day moving average, you just add up all the closing prices during the last 10 days and then divide it by 10 (in this case it is a simple moving average). The next day we do the same, except that we again take the prices for the last 10 days, which means that the price that was the last in our computation for the previous day is no longer included in today's average - it is replaced by yesterday's price. The data shift in this manner with every new trading day, hence the term "moving average".
The purpose and use of moving averages in technical analysis
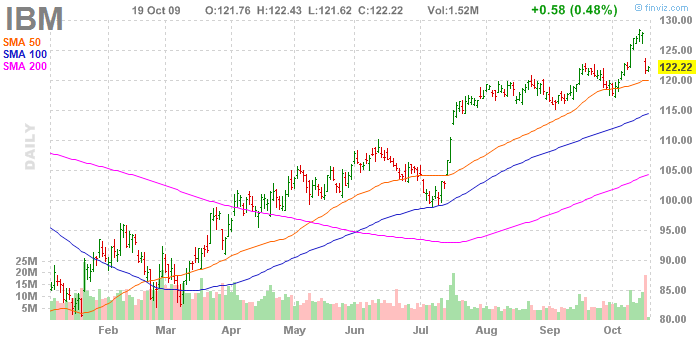
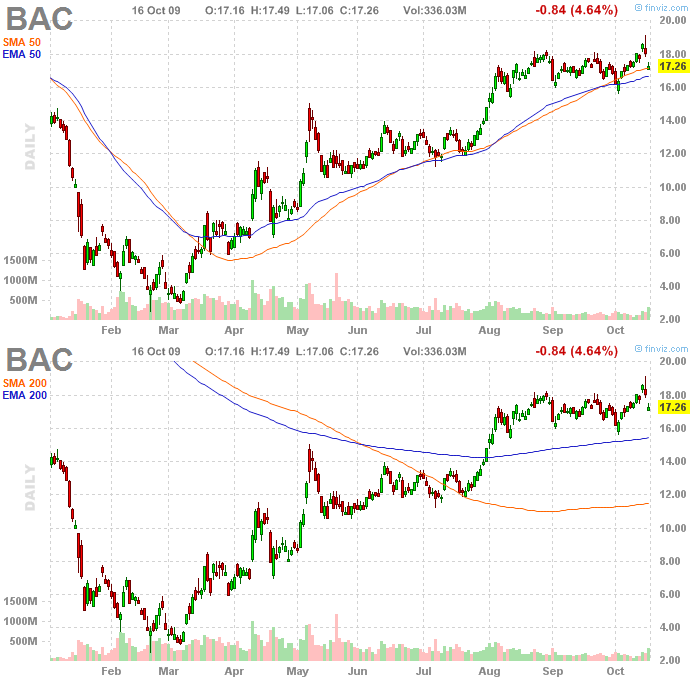
Moving average is a trend-following indicator. Its purpose is to detect the start of a trend, follow its progress, as well as to report its reversal if it occurs. As opposed to charting, moving averages do not anticipate the start or the end of a trend. They only confirm it, but only some time after the actual reversal occurs. It stems from their very construction, as these indicators are based solely on historical data. The less days a moving average contains, the sooner it can detect a trend's reversal. It is because of the amount of historical data, which strongly influences the average. A 20-day moving average generates the signal of a trend reversal sooner than the 50-day average. However, it is also true that the fewer days we use in the moving average's computation, the more false signals we get. Hence, most of the traders use a combination of several moving averages, which all have to yield a signal simultaneously, before a trader opens his position in the market. Nonetheless, a moving average's lag behind the trend cannot be completely eliminated.
Trading signals
Any type of moving average can be used to generate buy or sell signals and this process is very simple. The charting software plots the moving average as a line directly into the price chart. Signals are generated in places where prices intersect these lines.
When the price crosses above the moving average line, it implies the start of a new upward trend and hence it means a buy signal.
On the other hand, if the price crosses under the moving average line and the market also closes in this area, it signals the start of a downward trend and hence it constitutes a selling signal.
Using multiple averages
We can also opt for using multiple moving averages simultaneously, in order to eliminate the "noise" in prices and especially the false signals (whipsaws), which the use of a single moving average yields.
When using multiple averages, a buy signal occurs when the shorter of the averages crosses above the longer average, e.g. the 50-day average crosses above the 200-day average.
Conversely, a sell signal in this case is generated when the 50-day average crosses under the 200-average.
Similarly, we can also use a combination of three averages, e.g. a 5-day, 10-day and 20-day average. In this case, an upward trend is indicated if the 5-day average line is above the 10-day moving average, while the 10-day average is still above the 20-day average. Any crossing of moving averages which leads to this situation is considered a buy signal.
Conversely, downward trend is indicated by the situation when the 5-day average line is lower than the 10-day average, while the 10-day average is lower than the 20-day average.
Using three moving averages simultaneously limits the amount of false signals generated by the system, but it also limits potential for profit, as such a system generates a trading signal only after the trend is firmly established in the market. The entry signal can be even generated only a short time before the trend's reversal. The time intervals used by traders for computing moving averages are quite different. For example, the Fibonacci numbers are very popular, such as using 5-day, 21-day and 89-day averages. In futures trading, the combination 4-, 9- and 18- days is very popular, too.
Pros and cons
The reason why moving averages have been so popular is that they reflect several basic rules of trading. Use of moving averages helps you to cut your losses while letting your profits run. When using moving averages to generate trading signals, you always trade in the direction of the market trend, not against it. Moreover, as opposed to chart patterns analysis or other highly subjective techniques, moving averages can be used to generate trading signals according to clear rules - thus eliminating subjectivity of trading decisions, which can help the trader's psyche. However, a great disadvantage of moving averages is that they work well only when the market is trending. Hence, in periods of choppy markets when prices fluctuate in a particular price range they do not work at all. Such period can easily last more than one third of the time, so relying on moving averages alone is very risky. Some traders that's why recommend combining moving averages with an indicator measuring strength of a trend, such as ADX or to use moving averages only as an confirming indicator for your trading system.
Types of moving averages
The most commonly used types of moving averages are Simple Moving Average (SMA) and Exponentially Weighted Moving Average (EMA, EWMA).
This kind of moving average is also known as arithmetic mean and represents the simplest and most commonly used type of moving average. We compute it by summing up all the closing prices for a given period, which we subsequently divide by the number of days in the period. However, two problems are associated with this kind of average: it takes into account only the data included in the selected period (e.g. a 10-day simple moving average takes into account only the data from the last 10 days and simply ignores all other data prior to this period). It is also often criticized for allocating equal weights to all the data in the data set (i.e. in a 10-day moving average a price from 10 days ago has the same weight as the price from yesterday - 10%). Many traders argue that the data from recent days should carry more weight than older data - which would result in reducing the average's lag behind the trend.
This kind of moving average solves both problems associated with simple moving averages. Firstly, it allocates more weight in its computation to recent data. It also to some extent reflects all the historical data for the particular instrument. This kind of average is named according to the fact that the weights of data towards the past decrease exponentially. The slope of this decrease can be adjusted to the needs of the trader.