 |
| Market Cap | 189.16M | EPS (ttm) | -0.13 |
| P/E | - | EPS this Y | 8.33% |
| Forward P/E | - | EPS next Y | -56.36% |
| PEG | - | EPS past 5Y | 19.25% |
| P/S | 23.64 | EPS next 5Y | - |
| P/B | 2.61 | EPS Q/Q | -39.30% |
| Dividend | - | Sales Q/Q | -39.48% |
| Insider Own | 0.43% | Inst Own | 50.35% |
| Insider Trans | - | Inst Trans | 0.01% |
| Short Float | 6.58% | Earnings | May 09/a |
| Analyst Recom | 1.50 | Target Price | 5.20 |
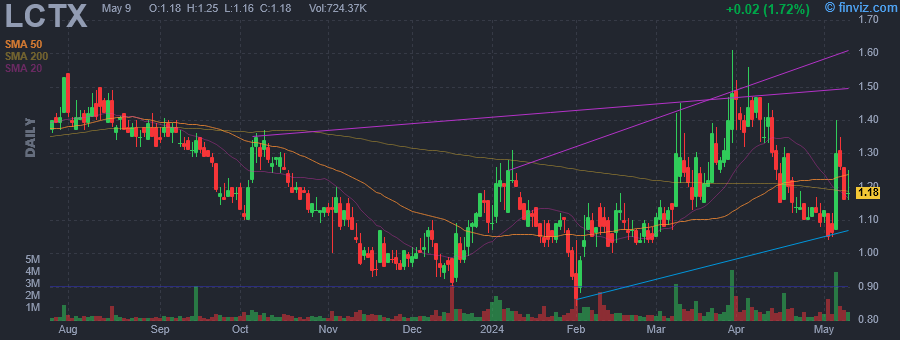
| Avg Volume | 1.12M | 52W Range | 0.84 - 1.61 |
|
|
|
|
Lineage Cell Therapeutics, Inc. operates as a clinical-stage biotechnology company developing new cellular therapies for degenerative retinal diseases, neurological conditions associated with demyelination, and aiding the body in detecting and combating cancer. The company's programs are based on two core proprietary technology platforms: cell replacement and cell and drug delivery. Its cell replacement platform creates new cells and tissues with its pluripotent and progenitor cell technologies. The company's cell and drug delivery programs are based upon its proprietary HyStem cell and drug delivery matrix technology. It engages in the research and development of regenerative medicine or therapeutic products for advancement in the field of oncology, orthopedics, retinal and neurological diseases and disorders, blood and vascular system diseases and disorders, blood plasma volume expansion, diagnostic products for the early detection of cancer and hydrogel products that may be used in surgery and products for human embryonic stem cell research. The company was founded by Judith Segall, Hal Sternberg, Paul E. Segall and Harold D. Waitz on November 30, 1990 and is headquartered in Carlsbad, CA. |
| Insider Trading |
Relationship |
Date |
Transaction |
Cost |
#Shares |
Value ($) |
#Shares Total |
SEC Form 4 |
| Culley Brian M | President and CEO | May 24 '24 | Buy | 1.05 | 10,000 | 10,500 | 154,842 | May 28 09:11 AM | | BAILEY DON M | Director | Feb 08 '24 | Buy | 1.04 | 96,155 | 100,001 | 158,801 | Feb 08 07:00 PM | | BROADWOOD PARTNERS, L.P. | Director | Feb 06 '24 | Buy | 1.04 | 6,730,770 | 7,000,001 | 41,666,255 | Feb 08 06:58 PM | | Jayasuriya Anula | Director | Dec 29 '23 | Buy | 1.09 | 10,000 | 10,900 | 10,000 | Jan 02 07:08 PM |
|
|
 |
 |
| Market Cap | 694.10M | EPS (ttm) | -8.19 |
| P/E | - | EPS this Y | -41.45% |
| Forward P/E | - | EPS next Y | 79.09% |
| PEG | - | EPS past 5Y | 0.08% |
| P/S | 0.44 | EPS next 5Y | - |
| P/B | 2.41 | EPS Q/Q | -609.09% |
| Dividend | - | Sales Q/Q | 0.30% |
| Insider Own | 1.52% | Inst Own | 68.42% |
| Insider Trans | 2.25% | Inst Trans | -11.63% |
| Short Float | 8.46% | Earnings | May 06/a |
| Analyst Recom | 2.50 | Target Price | 26.43 |
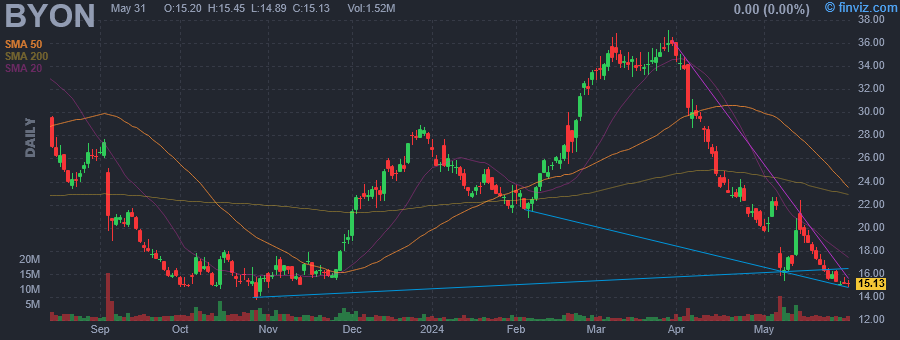
| Avg Volume | 1.87M | 52W Range | 13.71 - 39.27 |
|
|
|
|
Beyond, Inc. engages in the provision of an e-commerce platform. It offers furniture and home furnishing products and services. The company was founded on May 5, 1997 and is headquartered in Midvale, UT. |
| Insider Trading |
Relationship |
Date |
Transaction |
Cost |
#Shares |
Value ($) |
#Shares Total |
SEC Form 4 |
| Burkey Joanna Catherine | Director | May 22 '24 | Sale | 16.73 | 610 | 10,205 | 5,372 | May 23 08:09 PM | | Burkey Joanna Catherine | Director | May 21 '24 | Option Exercise | 0.00 | 1,650 | 0 | 5,982 | May 23 08:09 PM | | Nettles William Benjamin JR | Director | May 21 '24 | Option Exercise | 0.00 | 1,650 | 0 | 21,780 | May 23 08:11 PM | | Corbus Barclay F | Director | May 21 '24 | Option Exercise | 0.00 | 1,650 | 0 | 61,668 | May 23 08:13 PM | | Shapiro Robert Jacob | Director | May 21 '24 | Option Exercise | 0.00 | 1,650 | 0 | 26,728 | May 23 09:05 PM |
|
|
|
 |
| Market Cap | 6.02B | EPS (ttm) | 1.69 |
| P/E | 35.39 | EPS this Y | 3.29% |
| Forward P/E | 33.59 | EPS next Y | 1.37% |
| PEG | 17.61 | EPS past 5Y | -0.98% |
| P/S | 10.74 | EPS next 5Y | 2.01% |
| P/B | 1.20 | EPS Q/Q | -2.40% |
| Dividend | 5.03% | Sales Q/Q | 18.03% |
| Insider Own | 1.80% | Inst Own | 100.38% |
| Insider Trans | 6.57% | Inst Trans | 6.78% |
| Short Float | 3.82% | Earnings | Apr 23/a |
| Analyst Recom | 1.44 | Target Price | 65.84 |
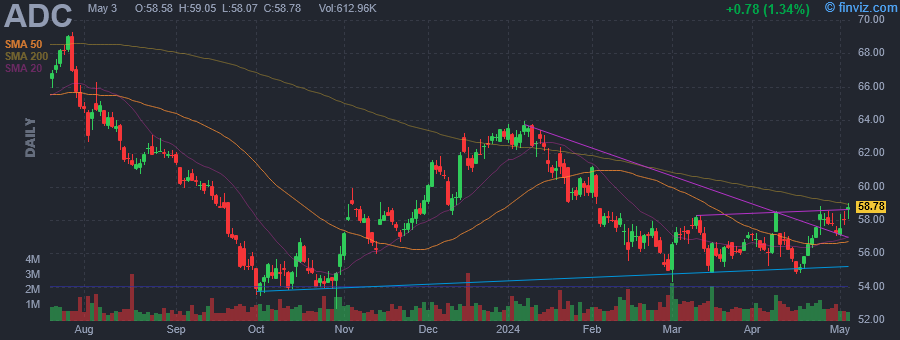
| Avg Volume | 938.45K | 52W Range | 52.69 - 69.26 |
|
|
|
|
Agree Realty Corp. is a real estate investment trust, which focuses on the ownership, development, acquisition, and management of retail properties net leased to national tenants. It specializes in acquiring and developing net leased retail properties for retail tenants. The company was founded by Richard Agree in 1971 and is headquartered in Royal Oak, MI. |
| Insider Trading |
Relationship |
Date |
Transaction |
Cost |
#Shares |
Value ($) |
#Shares Total |
SEC Form 4 |
| RAKOLTA JOHN JR | Director | May 23 '24 | Buy | 59.32 | 20,000 | 1,186,400 | 436,011 | May 28 06:30 AM | | Lehmkuhl Greg | Director | May 23 '24 | Buy | 58.99 | 1,000 | 58,990 | 23,036 | May 28 06:30 AM | | Breslin Stephen | CHIEF ACCOUNTING OFFICER | Mar 14 '24 | Buy | 55.33 | 450 | 24,898 | 10,441 | Mar 15 06:30 AM | | AGREE RICHARD | EXECUTIVE CHAIRMAN OF BOARD | Feb 29 '24 | Buy | 55.50 | 16,000 | 888,000 | 135,855 | Mar 01 06:30 AM | | RAKOLTA JOHN JR | Director | Feb 21 '24 | Buy | 56.75 | 20,000 | 1,135,000 | 412,651 | Feb 22 06:30 AM |
|
|
| |
 |
| Market Cap | 7.25B | EPS (ttm) | -0.29 |
| P/E | - | EPS this Y | 124.05% |
| Forward P/E | 29.27 | EPS next Y | 170.74% |
| PEG | - | EPS past 5Y | 32.14% |
| P/S | 2.26 | EPS next 5Y | 51.10% |
| P/B | 1.24 | EPS Q/Q | 145.19% |
| Dividend | - | Sales Q/Q | 49.44% |
| Insider Own | 6.72% | Inst Own | 39.05% |
| Insider Trans | -0.04% | Inst Trans | 4.43% |
| Short Float | 18.19% | Earnings | Apr 29/b |
| Analyst Recom | 2.83 | Target Price | 8.53 |
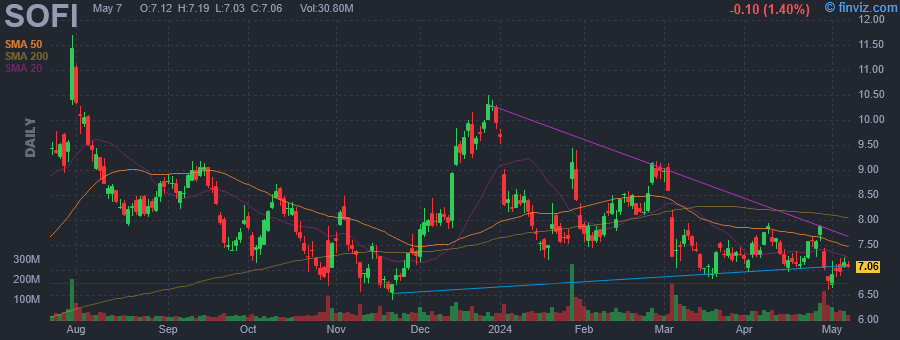
| Avg Volume | 48.57M | 52W Range | 5.59 - 11.70 |
|
|
|
|
SoFi Technologies, Inc. is a financial service platform, which engages in the provision of student loan refinancing options to the private student loan market. It offers home loans, personal loans, and credit cards. It operates through the following segments: Lending, Technology Platform, and Financial Services. The Lending segment includes personal loan, student loan, home loan products, and related servicing activities. The Technology Platform segment focuses on technology products and solutions revenue. The Financial Services segment includes the SoFi Money product, SoFi Invest product, SoFi Credit Card product, SoFi Relay personal finance management product, and other financial services such as lead generation and content for other financial services institutions. The company was founded in 2011 and is headquartered in San Francisco, CA. |
| Insider Trading |
Relationship |
Date |
Transaction |
Cost |
#Shares |
Value ($) |
#Shares Total |
SEC Form 4 |
| Noto Anthony | Chief Executive Officer | May 24 '24 | Buy | 6.92 | 28,860 | 199,752 | 8,091,129 | May 28 06:12 AM | | Noto Anthony | Chief Executive Officer | May 23 '24 | Buy | 6.92 | 28,900 | 199,933 | 8,062,269 | May 23 02:08 PM | | Noto Anthony | Chief Executive Officer | May 03 '24 | Buy | 6.90 | 28,775 | 198,548 | 8,033,369 | May 06 06:02 AM | | Rishel Jeremy | Chief Technology Officer | Mar 19 '24 | Sale | 6.93 | 56,273 | 389,972 | 390,616 | Mar 21 06:37 PM | | Lavet Robert S | General Counsel | Feb 06 '24 | Option Exercise | 0.41 | 24,742 | 10,144 | 1,529,741 | Feb 08 06:32 PM |
|
|
|
 |
| Market Cap | 21.40M | EPS (ttm) | -0.71 |
| P/E | - | EPS this Y | 28.57% |
| Forward P/E | - | EPS next Y | 60.00% |
| PEG | - | EPS past 5Y | -34.55% |
| P/S | 0.26 | EPS next 5Y | - |
| P/B | - | EPS Q/Q | -210.37% |
| Dividend | - | Sales Q/Q | -22.26% |
| Insider Own | 63.40% | Inst Own | 2.90% |
| Insider Trans | 0.25% | Inst Trans | - |
| Short Float | 0.08% | Earnings | May 09/a |
| Analyst Recom | - | Target Price | - |
| Avg Volume | 25.60K | 52W Range | 0.76 - 3.20 |
|
|
|
|
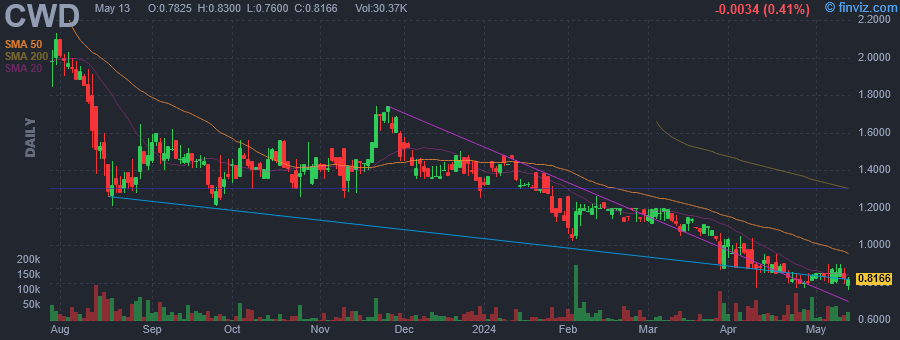
CaliberCos, Inc. is an asset management firm, which creates, manages, and services proprietary products including middlemarket investment funds, private syndications, and direct investments. It operates through the following segments: Fund Management, Development, and Brokerage. The Fund Management segment refers to the fund management activities along with back office and corporate support functions including accounting and human resources. The Development segment focuses on the activities associated with providing real estate development services as their principal developer. The Brokerage segment is involved in the buying, selling, and leasing of all funds assets. The company was founded by John Christopher Loeffler II and Jennifer Schrader in January 2009 and is headquartered in Scottsdale, AZ. |
| Insider Trading |
Relationship |
Date |
Transaction |
Cost |
#Shares |
Value ($) |
#Shares Total |
SEC Form 4 |
| Taylor Lawrence X. III | Director | May 23 '24 | Buy | 0.95 | 1,000 | 950 | 6,000 | May 24 09:13 PM | | Taylor Lawrence X. III | Director | May 22 '24 | Buy | 0.98 | 5,000 | 4,898 | 5,000 | May 24 09:13 PM | | LEUNG JADE | CFO | May 15 '24 | Buy | 0.87 | 28,500 | 24,704 | 672,052 | May 16 06:30 PM | | LOEFFLER JOHN C II | CEO | Nov 13 '23 | Buy | 1.42 | 6,000 | 8,520 | 317,131 | Nov 14 08:06 PM | | LOEFFLER JOHN C II | CEO | Sep 05 '23 | Buy | 1.58 | 10,000 | 15,830 | 10,000 | Sep 06 09:25 PM |
|
|
| |
 |
| Market Cap | 37.82B | EPS (ttm) | 13.59 |
| P/E | 20.35 | EPS this Y | -4.78% |
| Forward P/E | 12.79 | EPS next Y | 15.36% |
| PEG | 2.87 | EPS past 5Y | -17.10% |
| P/S | 1.11 | EPS next 5Y | 7.10% |
| P/B | 4.17 | EPS Q/Q | 152.81% |
| Dividend | 2.47% | Sales Q/Q | -0.59% |
| Insider Own | 1.69% | Inst Own | 86.40% |
| Insider Trans | -3.21% | Inst Trans | 1.17% |
| Short Float | 1.36% | Earnings | May 02/b |
| Analyst Recom | 2.65 | Target Price | 302.06 |
| Avg Volume | 2.90M | 52W Range | 203.18 - 304.24 |
|
|
|
|
Cummins, Inc. engages in the design, manufacture, and distribution of diesel, natural gas, electric and hybrid powertrains and powertrain-related components including filtration, aftertreatment, turbochargers, fuel systems, valvetrain technologies, controls systems, air handling systems, automated transmissions, axles, drivelines, brakes, suspension systems, electric power generation systems, batteries, electrified power systems, hydrogen production technologies, and fuel cell products. It operates through the following segments: Engine, Distribution, Components, Power Systems, and Accelera. The Engine segment manufactures and markets diesel and natural gas-powered engines under the Cummins brand name, for the heavy- and medium-duty truck, bus, recreational vehicle, light-duty automotive, construction, mining, marine, rail, oil and gas, defense, and agricultural markets. The Distribution segment includes power generation systems, high-horsepower engines, heavy-duty and medium-duty engines designed for on- and off-highway use, application engineering services, custom-designed assemblies, retail and wholesale aftermarket parts, and in-shop and field-based repair service. The Components segment supplies products including axles, drivelines, brakes and suspension systems for commercial diesel and natural gas applications, aftertreatment systems, turbochargers, fuel systems, valvetrain technologies, filtration products, automated transmissions, and electronics. The Power Systems segment engages in power generation, industrial, and generator technologies. The Accelera segment designs, manufactures, sells, and supports hydrogen production technologies, as well as electrified power systems, including battery, fuel cell, and electric powertrain technologies. The company was founded by Clessie Lyle Cummins and William Glanton Irwin on February 3, 1919 and is headquartered in Columbus, IN. |
| Insider Trading |
Relationship |
Date |
Transaction |
Cost |
#Shares |
Value ($) |
#Shares Total |
SEC Form 4 |
| Wiltrout Jeffrey T | VP - Corporate Strategy | May 24 '24 | Buy | 285.11 | 282 | 80,401 | 1,262 | May 24 06:04 PM | | Davis Amy Rochelle | VP & Pres. - New Power | May 23 '24 | Option Exercise | 119.48 | 1,980 | 236,566 | 10,825 | May 23 05:28 PM | | Wiltrout Jeffrey T | VP - Corporate Strategy | May 22 '24 | Option Exercise | 152.95 | 1,160 | 177,419 | 1,758 | May 23 01:01 PM | | Fetch Bonnie J | VP - Supply Chain | May 21 '24 | Option Exercise | 149.56 | 3,998 | 597,947 | 5,284 | May 22 03:33 PM | | Bush Jennifer Mary | VP & Pres. - Power Systems | May 20 '24 | Option Exercise | 163.08 | 5,200 | 847,998 | 9,164 | May 21 01:39 PM |
|
|
|
 |
| Market Cap | 3.23B | EPS (ttm) | 3.48 |
| P/E | 13.56 | EPS this Y | 17.88% |
| Forward P/E | 6.76 | EPS next Y | 15.52% |
| PEG | 0.97 | EPS past 5Y | 2.81% |
| P/S | 1.37 | EPS next 5Y | 14.00% |
| P/B | 1.55 | EPS Q/Q | -103.54% |
| Dividend | 2.62% | Sales Q/Q | -46.54% |
| Insider Own | 10.97% | Inst Own | 99.40% |
| Insider Trans | -2.34% | Inst Trans | -3.69% |
| Short Float | 11.02% | Earnings | May 07/a |
| Analyst Recom | 1.50 | Target Price | 62.43 |
| Avg Volume | 964.73K | 52W Range | 37.21 - 58.44 |
|
|
|
|
California Resources Corp. is an independent energy and carbon management company, which engages in energy transition. It focuses on increasing the value of land, mineral and technical resources for decarbonization by developing carbon capture, storage and other emissions reducing projects. The company was founded on April 23, 2014 and is headquartered in Long Beach, CA. |
| Insider Trading |
Relationship |
Date |
Transaction |
Cost |
#Shares |
Value ($) |
#Shares Total |
SEC Form 4 |
| McFarland Mark Allen | Director | May 24 '24 | Sale | 47.18 | 75,000 | 3,538,530 | 141,939 | May 24 05:58 PM | | Roby William B | Director | May 23 '24 | Buy | 46.97 | 388 | 18,246 | 51,014 | May 24 06:02 PM | | McFarland Mark Allen | Director | May 23 '24 | Sale | 46.79 | 55,000 | 2,573,341 | 216,939 | May 24 05:58 PM | | McFarland Mark Allen | Director | May 22 '24 | Sale | 47.29 | 50,000 | 2,364,605 | 271,939 | May 24 05:58 PM | | Gould Christopher D. | EVP & Chief Sustainability Off | Jul 06 '23 | Option Exercise | 0.00 | 29,977 | 0 | 86,442 | Jul 10 05:58 PM |
|
|
| |
 |
| Market Cap | 134.77B | EPS (ttm) | 0.64 |
| P/E | 100.67 | EPS this Y | -0.15% |
| Forward P/E | 30.79 | EPS next Y | 141.17% |
| PEG | 2.14 | EPS past 5Y | - |
| P/S | 3.49 | EPS next 5Y | 47.00% |
| P/B | 12.17 | EPS Q/Q | -302.82% |
| Dividend | - | Sales Q/Q | 14.82% |
| Insider Own | 3.94% | Inst Own | 78.94% |
| Insider Trans | -0.67% | Inst Trans | 1.20% |
| Short Float | 2.52% | Earnings | May 08/b |
| Analyst Recom | 1.25 | Target Price | 88.14 |
| Avg Volume | 18.32M | 52W Range | 37.07 - 82.14 |
|
|
|
|
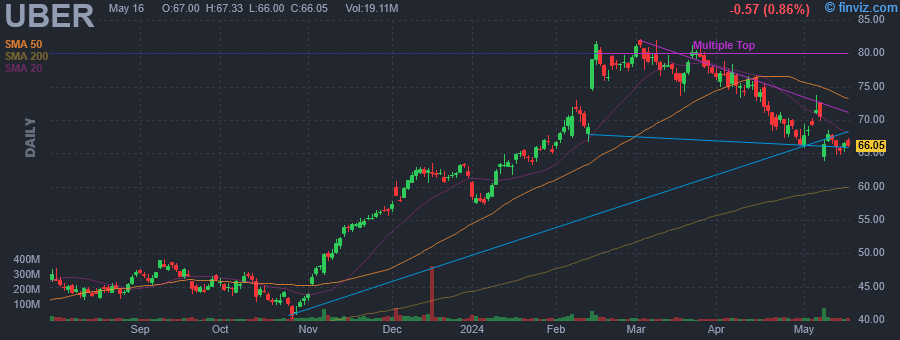
Uber Technologies, Inc. is a technology platform, which engages in the development and operation of technology applications, network, and product to power movement from point A to point B. The firm offers ride services and merchants delivery service providers for meal preparation, grocery and other delivery services. It operates through the following segments: Mobility, Delivery, and Freight. The Mobility segment refers to products that connect consumers with Mobility Drivers who provide rides in a variety of vehicles, such as cars, auto rickshaws, motorbikes, minibuses, or taxis. The Delivery segment offers consumers to search for and discover local restaurants, order a meal, and either pick-up at the restaurant or have the meal delivered and, in certain markets, Delivery also includes offerings for grocery, alcohol and convenience store delivery and other goods. The Freight segment leverages proprietary technology, brand awareness, and experience revolutionizing industries to connect carriers with shippers on Uber's platform, and gives carriers upfront, transparent pricing and the ability to book a shipment. The company was founded by Oscar Salazar Gaitan, Travis Kalanick and Garrett Camp in 2009 and is headquartered in San Francisco, CA. |
| Insider Trading |
Relationship |
Date |
Transaction |
Cost |
#Shares |
Value ($) |
#Shares Total |
SEC Form 4 |
| KHOSROWSHAHI DARA | Chief Executive Officer | May 17 '24 | Option Exercise | 33.65 | 1,000,000 | 33,650,000 | 2,156,996 | May 17 09:46 PM | | KHOSROWSHAHI DARA | Chief Executive Officer | May 17 '24 | Sale | 65.93 | 500,000 | 32,964,000 | 1,656,996 | May 17 09:46 PM | | West Tony | See Remarks | May 13 '24 | Sale | 65.63 | 18,750 | 1,230,597 | 206,338 | May 15 05:17 PM | | Hazelbaker Jill | See Remarks | Feb 14 '24 | Sale | 77.83 | 20,000 | 1,556,674 | 107,290 | Feb 16 06:58 PM | | West Tony | See Remarks | Feb 12 '24 | Sale | 70.08 | 18,750 | 1,313,926 | 185,566 | Feb 14 07:31 PM |
|
|
|
 |
| Market Cap | 3.85B | EPS (ttm) | -0.55 |
| P/E | - | EPS this Y | 4.87% |
| Forward P/E | - | EPS next Y | 9.03% |
| PEG | - | EPS past 5Y | - |
| P/S | - | EPS next 5Y | - |
| P/B | 2.04 | EPS Q/Q | 35.88% |
| Dividend | - | Sales Q/Q | - |
| Insider Own | 49.10% | Inst Own | 42.06% |
| Insider Trans | 2.52% | Inst Trans | -4.95% |
| Short Float | 8.88% | Earnings | May 08/a |
| Analyst Recom | 2.67 | Target Price | 3.77 |
| Avg Volume | 8.09M | 52W Range | 1.32 - 4.81 |
|
|
|
|
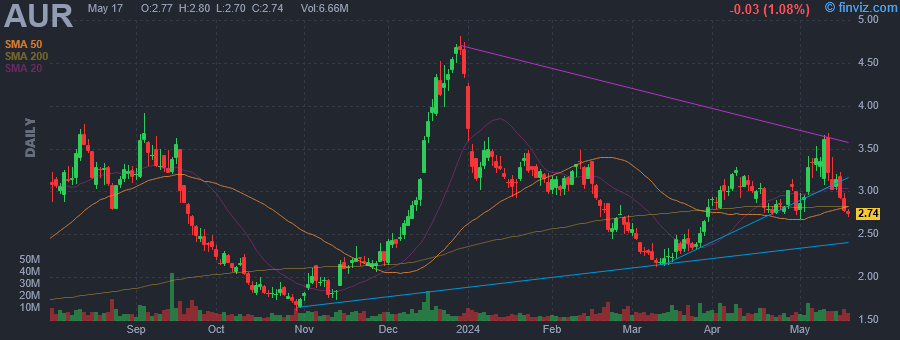
Aurora Innovation, Inc. engages in the design and development of automobile hardware, software, and provision of data services. It primarily offers Aurora Driver which allows a vehicle to drive itself. The company was founded by Chris Urmson, Sterling Anderson and Drew Bagnell in 2017 and is headquartered in Pittsburgh, PA. |
| Insider Trading |
Relationship |
Date |
Transaction |
Cost |
#Shares |
Value ($) |
#Shares Total |
SEC Form 4 |
| Hoffman Reid | Director | May 15 '24 | Sale | 3.16 | 45,600 | 144,146 | 389,694 | May 16 05:09 PM | | Hoffman Reid | Director | May 14 '24 | Sale | 3.09 | 1,013,781 | 3,132,076 | 391,974 | May 14 08:14 PM | | Hoffman Reid | Director | May 13 '24 | Sale | 3.19 | 338,000 | 1,079,403 | 442,663 | May 14 08:14 PM | | Hoffman Reid | Director | Mar 01 '24 | Sale | 2.59 | 80,000 | 207,440 | 459,563 | Mar 01 09:01 PM | | Hoffman Reid | Director | Feb 29 '24 | Sale | 2.52 | 1,000,000 | 2,521,500 | 463,563 | Mar 01 09:01 PM |
|
|
|
 |
| Market Cap | 9.44M | EPS (ttm) | -0.25 |
| P/E | - | EPS this Y | - |
| Forward P/E | - | EPS next Y | - |
| PEG | - | EPS past 5Y | -23.15% |
| P/S | 0.53 | EPS next 5Y | - |
| P/B | 0.49 | EPS Q/Q | 46.42% |
| Dividend | - | Sales Q/Q | 15.44% |
| Insider Own | 27.37% | Inst Own | 3.37% |
| Insider Trans | 4.06% | Inst Trans | 1.54% |
| Short Float | 0.24% | Earnings | May 01/a |
| Analyst Recom | 1.00 | Target Price | 1.25 |
| Avg Volume | 25.69K | 52W Range | 0.90 - 1.59 |
|
|
|
|
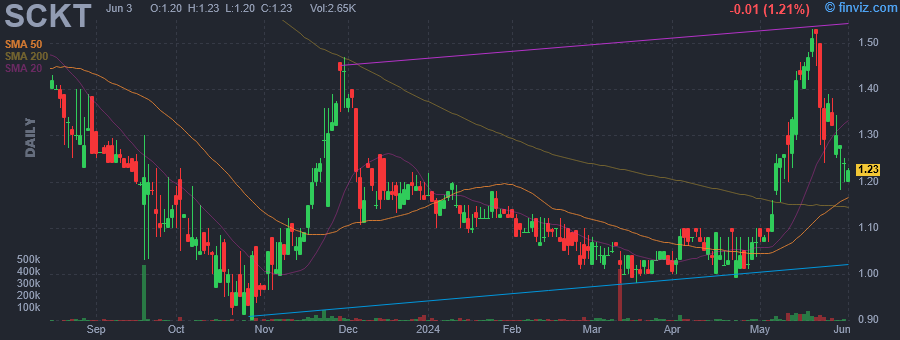
Socket Mobile, Inc. is a mobile data capture company, which engages in the provision of data capture and delivery solutions for enhanced productivity in workforce mobilization. Its products are incorporated into mobile applications used in point of sale (POS), commercial services (field workers), asset tracking, manufacturing process and quality control, transportation and logistics (goods tracking and movement), event management (ticketing, entry, access control, and identification), medical and education. The company's primary products are cordless data capture devices incorporating barcode scanning or RFID/Near Field Communications (NFC) technologies that connect over Bluetooth. All products work with applications running on smartphones, mobile computers and tablets using operating systems from Apple (iOS), Google (Android), and Microsoft (Windows). It also offers an easy-to-use software developer kit (Capture SDK) to application developers, which enables them to provide their users with advanced barcode scanning and RFID/NFC features. The firm's products are integrated in their application solutions and are marketed by the application developers or the resellers of their applications and number of registered developers for data capture applications continues to grow. The company was founded by Michael L. Gifford and Charlie Bass in March 1992 and is headquartered in Fremont, CA. |
| Insider Trading |
Relationship |
Date |
Transaction |
Cost |
#Shares |
Value ($) |
#Shares Total |
SEC Form 4 |
| BASS CHARLIE | Director | May 24 '24 | Buy | 1.37 | 5,000 | 6,846 | 1,416,651 | May 24 05:49 PM | | BASS CHARLIE | Director | May 23 '24 | Buy | 1.33 | 5,000 | 6,631 | 1,411,651 | May 23 05:29 PM | | BASS CHARLIE | Director | May 22 '24 | Buy | 1.46 | 5,000 | 7,302 | 1,406,651 | May 23 05:29 PM | | BASS CHARLIE | Director | May 21 '24 | Buy | 1.51 | 5,000 | 7,558 | 1,401,651 | May 21 05:22 PM | | BASS CHARLIE | Director | May 20 '24 | Buy | 1.51 | 5,000 | 7,558 | 1,396,651 | May 21 05:22 PM |
|
|
|
