 |
| Market Cap | 38.16M | EPS (ttm) | -1.42 |
| P/E | - | EPS this Y | 60.52% |
| Forward P/E | - | EPS next Y | 85.00% |
| PEG | - | EPS past 5Y | -64.63% |
| P/S | 0.11 | EPS next 5Y | - |
| P/B | 0.73 | EPS Q/Q | 13.23% |
| Dividend | - | Sales Q/Q | -9.08% |
| Insider Own | 37.82% | Inst Own | 21.52% |
| Insider Trans | -5.71% | Inst Trans | -11.57% |
| Short Float | 1.72% | Earnings | May 09/a |
| Analyst Recom | 1.00 | Target Price | 4.50 |
| Avg Volume | 74.53K | 52W Range | 1.32 - 8.20 |
|
|
|
|
Fathom Holdings, Inc. is a national, technology driven, end to end real estate services company, which engages in the provision of residential, brokerage, mortgage, title, insurance, and SaaS offerings for brokers and agents. It operates through the following segments: Real Estate Brokerage, Mortgage, Technology, and Corporate and Other Services. The company was founded by Joshua Harley in January 2010 and is headquartered in Cary, NC. |
| Insider Trading |
Relationship |
Date |
Transaction |
Cost |
#Shares |
Value ($) |
#Shares Total |
SEC Form 4 |
| Flanders Scott N | Director | May 29 '24 | Buy | 1.75 | 700 | 1,225 | 602,215 | May 29 04:53 PM | | Flanders Scott N | Director | May 24 '24 | Buy | 1.70 | 3,066 | 5,203 | 601,515 | May 29 04:53 PM | | Flanders Scott N | Director | May 23 '24 | Buy | 1.53 | 2,114 | 3,234 | 598,449 | May 23 05:39 PM | | Flanders Scott N | Director | May 22 '24 | Buy | 1.65 | 25,000 | 41,250 | 596,335 | May 23 05:39 PM | | Flanders Scott N | Director | May 21 '24 | Buy | 1.65 | 1,251 | 2,059 | 571,335 | May 23 05:39 PM |
|
|
 |
 |
| Market Cap | 657.76M | EPS (ttm) | -1.59 |
| P/E | - | EPS this Y | 0.98% |
| Forward P/E | - | EPS next Y | 19.06% |
| PEG | - | EPS past 5Y | - |
| P/S | 0.72 | EPS next 5Y | 36.48% |
| P/B | 0.24 | EPS Q/Q | -155.46% |
| Dividend | 4.29% | Sales Q/Q | -15.19% |
| Insider Own | 3.58% | Inst Own | 106.40% |
| Insider Trans | -2.88% | Inst Trans | -2.82% |
| Short Float | 16.84% | Earnings | May 01/a |
| Analyst Recom | 2.31 | Target Price | 7.35 |
| Avg Volume | 2.19M | 52W Range | 4.05 - 9.85 |
|
|
|
|
Hudson Pacific Properties, Inc. is a real estate company, which acquires, repositions, develops, and operates sustainable office and state of-the-art studio properties in high-barrier-to-entry submarkets in California, the Pacific Northwest, Western Canada, and Greater London, United Kingdom. It operates through the Office Properties and Studio Properties segments. The Office Properties segment manages office properties located in California and the Pacific Northwest. The Studio Properties segment is primarily used for the physical production of media content, such as television programs, feature films, commercials, music videos and photographs. The company was founded by Victor J. Coleman in 2006 and is headquartered in Los Angeles, CA. |
| Insider Trading |
Relationship |
Date |
Transaction |
Cost |
#Shares |
Value ($) |
#Shares Total |
SEC Form 4 |
| LAMMAS MARK T | President | May 29 '24 | Buy | 4.31 | 5,800 | 24,998 | 119,157 | May 29 04:42 PM | | Diramerian Harout Krikor | Chief Financial Officer | May 29 '24 | Buy | 4.29 | 2,325 | 9,974 | 53,246 | May 29 04:41 PM | | COLEMAN VICTOR J | Chief Executive Officer | May 22 '24 | Sale | 5.18 | 100,000 | 517,564 | 387,451 | May 24 07:58 PM | | COLEMAN VICTOR J | Chief Executive Officer | May 14 '24 | Sale | 5.72 | 127,918 | 731,691 | 487,451 | May 16 04:09 PM | | SHOLEM BARRY A | Director | Feb 22 '24 | Buy | 6.69 | 40,000 | 267,600 | 110,176 | Feb 22 07:34 PM |
|
|
|
 |
| Market Cap | 52.80M | EPS (ttm) | -3.94 |
| P/E | - | EPS this Y | - |
| Forward P/E | - | EPS next Y | - |
| PEG | - | EPS past 5Y | - |
| P/S | 7.24 | EPS next 5Y | - |
| P/B | 1.54 | EPS Q/Q | -98.79% |
| Dividend | - | Sales Q/Q | 49.87% |
| Insider Own | 46.49% | Inst Own | 6.94% |
| Insider Trans | 1.69% | Inst Trans | 185.68% |
| Short Float | 3.33% | Earnings | Nov 14/a |
| Analyst Recom | 3.00 | Target Price | 1.00 |
| Avg Volume | 546.98K | 52W Range | 0.40 - 3.25 |
|
|
|
|
Palladyne AI Corp. engages in the design, development, and manufacture of industrial robotic systems that augment human performance by combining human intelligence, instinct, and judgment with the strength, endurance, and precision of machines to enhance employee safety and productivity. Its mobile robotic systems include the Guardian S, Guardian GT, Guardian XO, and Guardian XT. The company was founded in 2015 and is headquartered in Salt Lake City, UT. |
| Insider Trading |
Relationship |
Date |
Transaction |
Cost |
#Shares |
Value ($) |
#Shares Total |
SEC Form 4 |
| WEIBLING DENNIS M | Director | May 28 '24 | Buy | 1.84 | 23,976 | 44,022 | 150,000 | May 29 04:38 PM | | WEIBLING DENNIS M | Director | May 24 '24 | Buy | 1.99 | 15,926 | 31,723 | 126,024 | May 28 05:29 PM | | Wolff Benjamin G | PRESIDENT & CEO | May 22 '24 | Buy | 1.96 | 8,000 | 15,680 | 1,287,946 | May 23 04:30 PM | | WEIBLING DENNIS M | Director | May 22 '24 | Buy | 1.95 | 7,208 | 14,078 | 110,098 | May 23 04:32 PM | | WEIBLING DENNIS M | Director | May 21 '24 | Buy | 1.80 | 2,890 | 5,202 | 102,890 | May 22 04:46 PM |
|
|
| |
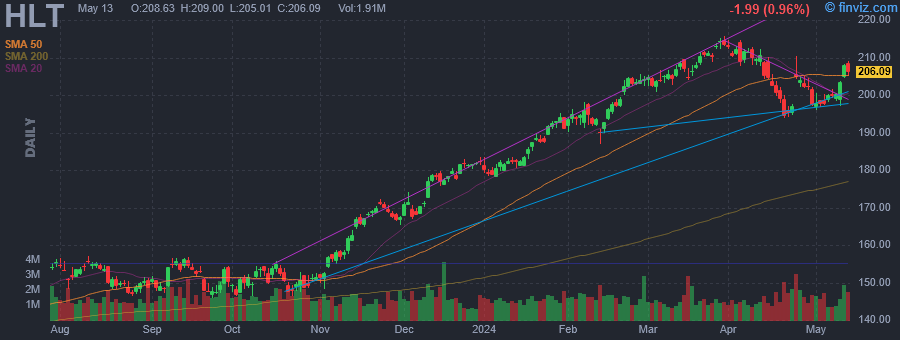 |
| Market Cap | 49.02B | EPS (ttm) | 4.59 |
| P/E | 42.68 | EPS this Y | 14.72% |
| Forward P/E | 23.84 | EPS next Y | 15.43% |
| PEG | 2.71 | EPS past 5Y | 11.53% |
| P/S | 4.66 | EPS next 5Y | 15.73% |
| P/B | - | EPS Q/Q | 35.70% |
| Dividend | 0.33% | Sales Q/Q | 12.21% |
| Insider Own | 2.08% | Inst Own | 96.38% |
| Insider Trans | -0.79% | Inst Trans | -2.94% |
| Short Float | 1.33% | Earnings | Apr 24/b |
| Analyst Recom | 2.27 | Target Price | 217.37 |
| Avg Volume | 1.52M | 52W Range | 134.43 - 215.79 |
|
|
|
|
Hilton Worldwide Holdings, Inc. engages in the provision of hospitality businesses. It operates through the Management and Franchise, and Ownership segments. The Management and Franchise segment operates hotels of third-party owners. The Ownership segment includes owned, leased, and joint venture hotels. The company was founded by Conrad N. Hilton in 1925 and is headquartered in McLean, VA. |
| Insider Trading |
Relationship |
Date |
Transaction |
Cost |
#Shares |
Value ($) |
#Shares Total |
SEC Form 4 |
| Healey Melanie | Director | May 28 '24 | Buy | 199.65 | 2,000 | 399,299 | 14,938 | May 29 04:34 PM | | NASSETTA CHRISTOPHER J | See Remarks | Feb 09 '24 | Option Exercise | 45.46 | 53,488 | 2,431,564 | 2,589,966 | Feb 09 04:46 PM | | NASSETTA CHRISTOPHER J | See Remarks | Feb 09 '24 | Sale | 192.83 | 22,095 | 4,260,653 | 2,567,871 | Feb 09 04:46 PM | | NASSETTA CHRISTOPHER J | See Remarks | Feb 08 '24 | Option Exercise | 45.46 | 21,489 | 976,890 | 2,557,967 | Feb 09 04:46 PM | | NASSETTA CHRISTOPHER J | See Remarks | Feb 08 '24 | Sale | 195.68 | 21,489 | 4,205,070 | 2,536,478 | Feb 09 04:46 PM |
|
|
|
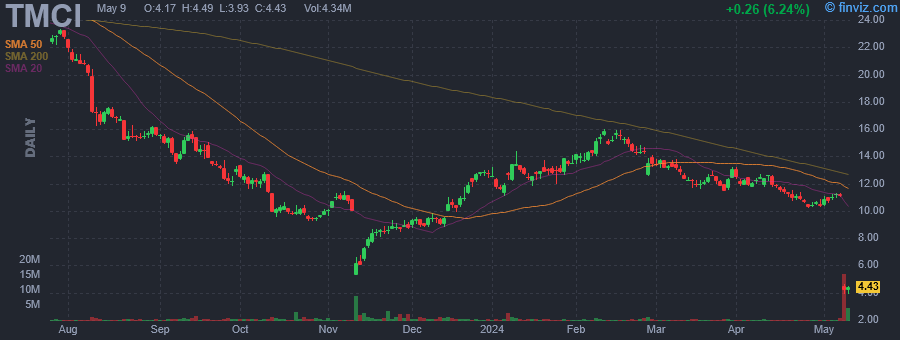 |
| Market Cap | 351.52M | EPS (ttm) | -0.89 |
| P/E | - | EPS this Y | -11.61% |
| Forward P/E | - | EPS next Y | 6.31% |
| PEG | - | EPS past 5Y | -70.68% |
| P/S | 1.79 | EPS next 5Y | - |
| P/B | 2.78 | EPS Q/Q | -31.91% |
| Dividend | - | Sales Q/Q | 21.12% |
| Insider Own | 29.09% | Inst Own | 66.61% |
| Insider Trans | 6.40% | Inst Trans | 10.85% |
| Short Float | 10.35% | Earnings | May 07/a |
| Analyst Recom | 3.00 | Target Price | 6.83 |
| Avg Volume | 1.01M | 52W Range | 3.92 - 27.41 |
|
|
|
|
Treace Medical Concepts, Inc. engages in the design, manufacture, and marketing of orthopedic medical devices and biologic solutions. It offers Lapiplasty, a bunion surgery for three-dimensional bunion correction. It operates and distributes its products and services under the following trademarks: Treace Medical Concepts, Lapiplasty, Fast Grafter, Align My Toe, The Future of Hallux Valgus, Fix It Right The First Time, and Plantar Python. The company was founded by John T. Treace in July 2013 and is headquartered in Ponte Vedra Beach, FL. |
| Insider Trading |
Relationship |
Date |
Transaction |
Cost |
#Shares |
Value ($) |
#Shares Total |
SEC Form 4 |
| TREACE JAMES T | Director | May 28 '24 | Buy | 5.07 | 50,000 | 253,475 | 1,089,441 | May 29 04:33 PM | | MOTT RICHARD W | Director | May 22 '24 | Buy | 4.99 | 12,100 | 60,425 | 1,054,944 | May 23 04:30 PM | | Treace John T. | Chief Executive Officer | May 17 '24 | Buy | 5.56 | 100,000 | 556,170 | 6,343,095 | May 20 04:30 PM | | Treace John T. | Chief Executive Officer | May 14 '24 | Buy | 5.12 | 150,000 | 767,805 | 6,243,095 | May 14 06:19 PM | | Kiernan Jane E | Director | May 14 '24 | Buy | 5.17 | 19,356 | 100,001 | 24,941 | May 14 06:20 PM |
|
|
| |
 |
| Market Cap | 143.08M | EPS (ttm) | 3.83 |
| P/E | 6.76 | EPS this Y | -59.93% |
| Forward P/E | 11.37 | EPS next Y | 27.02% |
| PEG | - | EPS past 5Y | 6.22% |
| P/S | 1.10 | EPS next 5Y | - |
| P/B | 0.82 | EPS Q/Q | -60.07% |
| Dividend | 5.09% | Sales Q/Q | 0.59% |
| Insider Own | 5.06% | Inst Own | 59.96% |
| Insider Trans | 6.32% | Inst Trans | -1.53% |
| Short Float | 3.22% | Earnings | Apr 30/a |
| Analyst Recom | 3.00 | Target Price | 26.75 |
| Avg Volume | 22.29K | 52W Range | 23.32 - 33.58 |
|
|
|
|
Evans Bancorp, Inc. is a bank holding company, which engages in the provision of financial solutions. It operates through the Banking Activities and Insurance Agency Activities segments. The Banking Activities segment offers consumer and commercial banking services such as lending, deposits, annuities, and mutual funds. The Insurance Agency Activities segment includes insurance policies on a commission basis, surety bonds, risk management, and disability reinsurance products. The company was founded on October 28, 1988 and is headquartered in Williamsville, NY. |
| Insider Trading |
Relationship |
Date |
Transaction |
Cost |
#Shares |
Value ($) |
#Shares Total |
SEC Form 4 |
| PL Capital Advisors, LLC | 10% Owner | May 28 '24 | Buy | 26.12 | 21,061 | 550,185 | 576,633 | May 29 04:24 PM | | PL Capital Advisors, LLC | 10% Owner | May 23 '24 | Buy | 27.75 | 2,776 | 77,034 | 555,572 | May 24 05:10 PM | | NASCA DAVID J | President and CEO | Mar 21 '24 | Option Exercise | 30.09 | 798 | 24,012 | 97,188 | Mar 22 02:56 PM | | Connerton John B | Treasurer | Mar 21 '24 | Option Exercise | 30.09 | 313 | 9,418 | 16,815 | Mar 22 02:55 PM | | Connerton John B | Treasurer | Mar 18 '24 | Sale | 29.12 | 3,146 | 91,612 | 16,304 | Mar 19 01:58 PM |
|
|
|
 |
| Market Cap | 76.89M | EPS (ttm) | 1.26 |
| P/E | 11.97 | EPS this Y | - |
| Forward P/E | - | EPS next Y | - |
| PEG | - | EPS past 5Y | 9.96% |
| P/S | 0.93 | EPS next 5Y | - |
| P/B | 0.70 | EPS Q/Q | -44.75% |
| Dividend | 3.70% | Sales Q/Q | 10.93% |
| Insider Own | 20.61% | Inst Own | 33.52% |
| Insider Trans | 2.20% | Inst Trans | -0.49% |
| Short Float | 0.07% | Earnings | Jan 30/a |
| Analyst Recom | - | Target Price | - |
| Avg Volume | 3.54K | 52W Range | 13.49 - 22.33 |
|
|
|
|
Old Point Financial Corp. operates as a bank holding company, which engages in the provision of banking services through its subsidiaries. It offers various consumer, mortgage, and business banking services, including loan, deposit, and cash management services. The company was founded on February 16, 1984 and is headquartered in Hampton, VA. |
| Insider Trading |
Relationship |
Date |
Transaction |
Cost |
#Shares |
Value ($) |
#Shares Total |
SEC Form 4 |
| PL Capital Advisors, LLC | 10% Owner | May 28 '24 | Buy | 14.92 | 1,799 | 26,835 | 627,020 | May 29 04:22 PM | | PL Capital Advisors, LLC | 10% Owner | May 17 '24 | Buy | 14.92 | 2,101 | 31,356 | 625,221 | May 20 04:30 PM | | PL Capital Advisors, LLC | 10% Owner | May 15 '24 | Buy | 14.17 | 871 | 12,346 | 623,120 | May 16 04:42 PM | | PL Capital Advisors, LLC | 10% Owner | May 14 '24 | Buy | 14.25 | 17,403 | 247,961 | 622,249 | May 16 04:42 PM | | WITT JOSEPH R | President/Financial Svcs, CSO | May 10 '24 | Buy | 14.25 | 180 | 2,565 | 21,906 | May 13 11:02 AM |
|
|
| |
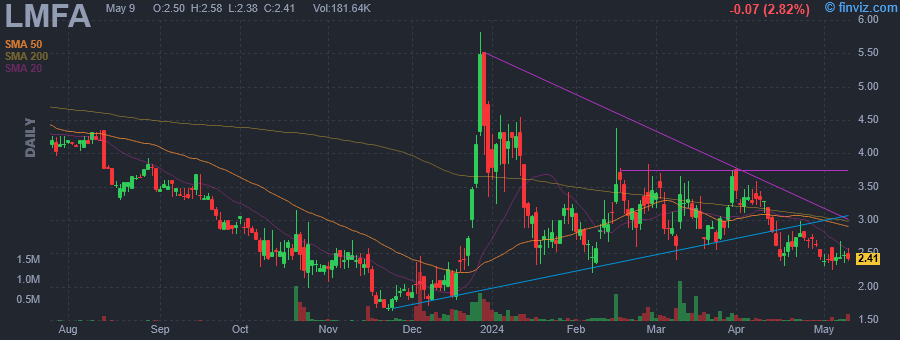 |
| Market Cap | 7.79M | EPS (ttm) | -4.10 |
| P/E | - | EPS this Y | 52.72% |
| Forward P/E | - | EPS next Y | - |
| PEG | - | EPS past 5Y | 13.25% |
| P/S | 0.51 | EPS next 5Y | - |
| P/B | 0.20 | EPS Q/Q | 124.85% |
| Dividend | - | Sales Q/Q | 105.21% |
| Insider Own | 17.77% | Inst Own | 2.49% |
| Insider Trans | -2.85% | Inst Trans | -9.49% |
| Short Float | 6.83% | Earnings | May 16/b |
| Analyst Recom | 2.00 | Target Price | 6.00 |
| Avg Volume | 166.45K | 52W Range | 1.63 - 5.82 |
|
|
|
May-29-24 08:50AM
|
Looking for a Fast-paced Momentum Stock at a Bargain? Consider LM Funding America (LMFA)
(Zacks) |
|
May-16-24 01:52PM
|
LMFA Stock Earnings: LM Funding America Beats EPS, Beats Revenue for Q1 2024
(InvestorPlace) +31.78% |
|
11:15AM
|
LM Funding America, Inc. (LMFA) Reports Q1 Loss, Misses Revenue Estimates
(Zacks) |
|
08:30AM
|
LM Funding America, Inc. Achieves Over 105% Year-Over-Year Revenue Growth to $4.7 Million and Generated $1.9 Million of Net Income for the First Quarter of 2024
(GlobeNewswire) |
|
May-13-24 08:30AM
|
LM Funding America, Inc. Schedules First Quarter 2024 Financial Results and Business Update Conference Call
(GlobeNewswire) |
|
May-09-24 08:30AM
|
LM Funding America, Inc. Provides Monthly Operational and Bitcoin Mining Update for Month Ended April 30, 2024
(GlobeNewswire) |
|
Apr-30-24 08:00AM
|
LM Funding America, Inc. Announces the Appointment of Marty Traber to its Board of Directors
(GlobeNewswire) -6.48% |
|
Apr-09-24 08:30AM
|
LM Funding America, Inc. Provides Monthly Operational and Bitcoin Mining Update for Month Ended March 31, 2024
(GlobeNewswire) |
|
Apr-05-24 12:00PM
|
All You Need to Know About LM Funding America (LMFA) Rating Upgrade to Strong Buy
(Zacks) |
|
Apr-02-24 11:26AM
|
LM Funding America, Inc. (NASDAQ:LMFA) Q4 2023 Earnings Call Transcript
(Insider Monkey) -6.12% |
|
LM Funding America, Inc. is a technology-based specialty finance company, which engages in the provision of funding to nonprofit community associations. It also focuses on business of purchasing delinquent accounts on various terms tailored to suit each association's financial needs, and cryptocurrency mining through its subsidiary. The company was founded by Carollinn Gould and Frank Silcox on January 14, 2008 and is headquartered in Tampa, FL. |
| Insider Trading |
Relationship |
Date |
Transaction |
Cost |
#Shares |
Value ($) |
#Shares Total |
SEC Form 4 |
| TRABER MARTIN A | Director | May 24 '24 | Buy | 3.37 | 5,000 | 16,862 | 5,037 | May 29 04:18 PM | | Duran Ryan H | Vice President of Operations | May 22 '24 | Sale | 3.45 | 500 | 1,725 | 20,318 | May 23 05:07 PM | | Duran Ryan H | Vice President of Operations | May 08 '24 | Sale | 2.38 | 500 | 1,192 | 20,818 | May 08 04:41 PM | | Duran Ryan H | Vice President of Operations | Apr 24 '24 | Sale | 2.83 | 500 | 1,415 | 21,318 | Apr 26 04:34 PM | | Duran Ryan H | Vice President of Operations | Apr 10 '24 | Sale | 3.27 | 500 | 1,635 | 21,818 | Apr 11 04:44 PM |
|
|
|
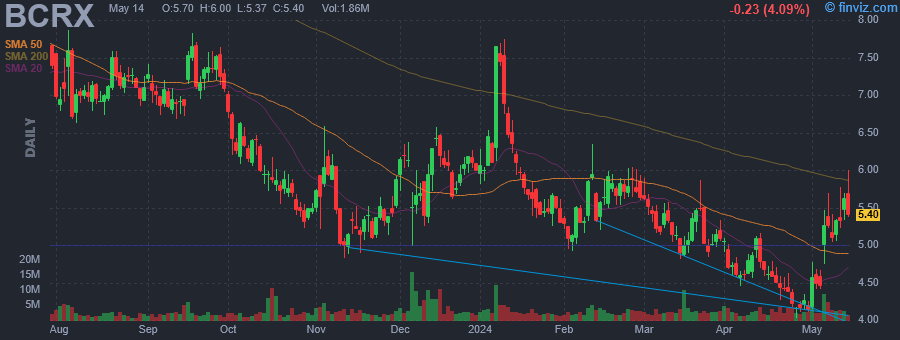 |
| Market Cap | 1.34B | EPS (ttm) | -1.07 |
| P/E | - | EPS this Y | 47.50% |
| Forward P/E | - | EPS next Y | 42.00% |
| PEG | - | EPS past 5Y | -3.73% |
| P/S | 3.77 | EPS next 5Y | 44.80% |
| P/B | - | EPS Q/Q | 39.31% |
| Dividend | - | Sales Q/Q | 34.87% |
| Insider Own | 4.00% | Inst Own | 85.97% |
| Insider Trans | 2.18% | Inst Trans | -1.64% |
| Short Float | 17.34% | Earnings | May 06/b |
| Analyst Recom | 1.33 | Target Price | 14.00 |
| Avg Volume | 3.61M | 52W Range | 4.03 - 8.96 |
|
|
|
|
BioCryst Pharmaceuticals, Inc. is a biotechnology company. It engages in the provision of structure-guided drug design with the goal of developing oral small-molecule and protein therapeutics to target difficult-to-treat rare diseases. The company was founded by William M. Spencer III, Charles E. Bugg, and John A. Montgomery in 1986 and is headquartered in Durham, NC. |
| Insider Trading |
Relationship |
Date |
Transaction |
Cost |
#Shares |
Value ($) |
#Shares Total |
SEC Form 4 |
| ASELAGE STEVE | Director | May 24 '24 | Buy | 6.40 | 2,500 | 16,000 | 2,500 | May 29 04:16 PM | | MILANO VINCENT | Director | May 20 '24 | Buy | 6.25 | 15,000 | 93,750 | 66,997 | May 22 07:21 AM | | Hutson Nancy J | Director | May 20 '24 | Buy | 6.38 | 5,000 | 31,900 | 86,818 | May 22 07:24 AM | | Doyle Anthony | Chief Financial Officer | May 14 '24 | Buy | 5.57 | 36,300 | 202,191 | 266,744 | May 15 07:19 AM | | Thackray Helen M. | Chief R&D Officer | May 14 '24 | Buy | 5.86 | 30,000 | 175,800 | 272,139 | May 15 07:17 AM |
|
|
|
 |
| Market Cap | 3.30B | EPS (ttm) | 60.31 |
| P/E | 12.32 | EPS this Y | 20.38% |
| Forward P/E | 16.51 | EPS next Y | -14.69% |
| PEG | 0.68 | EPS past 5Y | -2.68% |
| P/S | 0.73 | EPS next 5Y | 18.10% |
| P/B | 0.82 | EPS Q/Q | 154.91% |
| Dividend | 0.91% | Sales Q/Q | 11.74% |
| Insider Own | 26.71% | Inst Own | 63.85% |
| Insider Trans | -0.04% | Inst Trans | -0.87% |
| Short Float | 1.94% | Earnings | May 01/b |
| Analyst Recom | 5.00 | Target Price | 625.00 |
| Avg Volume | 15.34K | 52W Range | 551.36 - 778.84 |
|
|
|
|
Graham Holdings Co. engages in the provision of education and media services. It operates through the following segments: Education, Television Broadcasting, Manufacturing, Healthcare, SocialCode, and Other Businesses. The Education segment includes professional training and postsecondary education businesses largely outside the U.S. and English-language programs provided by Kaplan, Inc. The Television Broadcasting segment conducts operations through seven television stations serving the Detroit, Houston, San Antonio, Orlando, Jacksonville, and Roanoke television markets. The Manufacturing segment focuses on the manufacturing operations of Hoover Treated Wood Products, Inc., a supplier of pressure impregnated kiln-dried lumber and plywood products for fire retardant and preservative applications, Dekko, a manufacturer of electrical workspace solutions, architectural lighting and electrical components and assemblies, Joyce/Dayton Corp., a manufacturer of screw jacks and other linear motion systems, and Forney, a global supplier of products and systems that control and monitor combustion processes in electric utility and industrial applications. The Healthcare segment encompasses home health, hospice, and palliative services. The SocialCode segment provides marketing solutions managing data, creative, media, and marketplaces to accelerate client growth. The Other Businesses segment consists of the online publishing and printing of magazines and automotive dealerships. The company was founded by Stilson Hutchins in 1877 and is headquartered in Arlington, VA. |
| Insider Trading |
Relationship |
Date |
Transaction |
Cost |
#Shares |
Value ($) |
#Shares Total |
SEC Form 4 |
| MULCAHY ANNE M | Director | May 28 '24 | Buy | 745.07 | 135 | 100,584 | 662 | May 29 04:15 PM | | Weymouth Katharine | Director | Mar 14 '24 | Sale | 712.99 | 556 | 396,422 | 1,993 | Mar 15 04:21 PM | | GAYNER THOMAS SINNICKSON | Director | Nov 09 '23 | Buy | 607.24 | 100 | 60,724 | 600 | Nov 09 04:20 PM | | Allen Tony | Director | Nov 08 '23 | Sale | 619.03 | 75 | 46,427 | 15 | Nov 09 04:18 PM | | GAYNER THOMAS SINNICKSON | Director | Sep 08 '23 | Buy | 569.83 | 100 | 56,983 | 500 | Sep 12 06:14 PM |
|
|
|
