 |
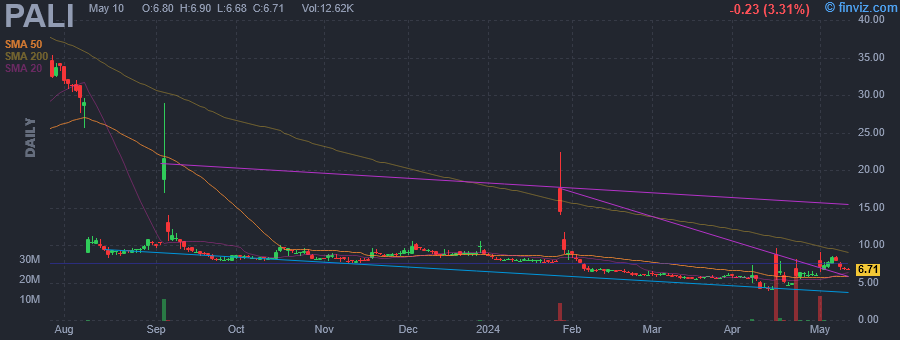
| Market Cap | 4.21M | EPS (ttm) | -24.71 |
| P/E | - | EPS this Y | 56.83% |
| Forward P/E | - | EPS next Y | 24.41% |
| PEG | - | EPS past 5Y | 75.28% |
| P/S | - | EPS next 5Y | - |
| P/B | 0.38 | EPS Q/Q | 43.55% |
| Dividend | - | Sales Q/Q | -100.00% |
| Insider Own | 1.25% | Inst Own | 6.62% |
| Insider Trans | 272.34% | Inst Trans | - |
| Short Float | 3.83% | Earnings | May 14/b |
| Analyst Recom | 1.00 | Target Price | 33.75 |
| Avg Volume | 1.14M | 52W Range | 3.82 - 36.60 |
|
|
|
|
Palisade Bio, Inc. is a biopharmaceutical company, which engages in the development of oral therapies that help patients with acute and chronic gastrointestinal complications stemming from post-operative digestive enzyme damage. It offers LB1148, an oral formulation of a broad-spectrum serine protease inhibitor designed to neutralize the activity of potent digestive proteases released from the gut during surgery. The company was founded on September 6, 2011 and is headquartered in Carlsbad, CA. |
| Insider Trading |
Relationship |
Date |
Transaction |
Cost |
#Shares |
Value ($) |
#Shares Total |
SEC Form 4 |
| Williams Donald Allen | Director | May 28 '24 | Buy | 4.86 | 1,000 | 4,863 | 1,000 | May 29 03:47 PM | | Finley John David | CEO, CFO, Director | May 24 '24 | Buy | 4.81 | 1,000 | 4,810 | 8,437 | May 28 06:02 AM | | Finley John David | CEO, CFO, Director | May 06 '24 | Option Exercise | 0.00 | 443 | 0 | 6,832 | May 08 06:36 PM | | Jones Mitchell Lawrence | CEO, CFO, Director | May 06 '24 | Option Exercise | 0.00 | 460 | 0 | 880 | May 08 06:37 PM | | Finley John David | CEO, CFO, Director | Mar 11 '24 | Option Exercise | 0.00 | 5,558 | 0 | 96,849 | Mar 12 06:29 PM |
|
|
 |
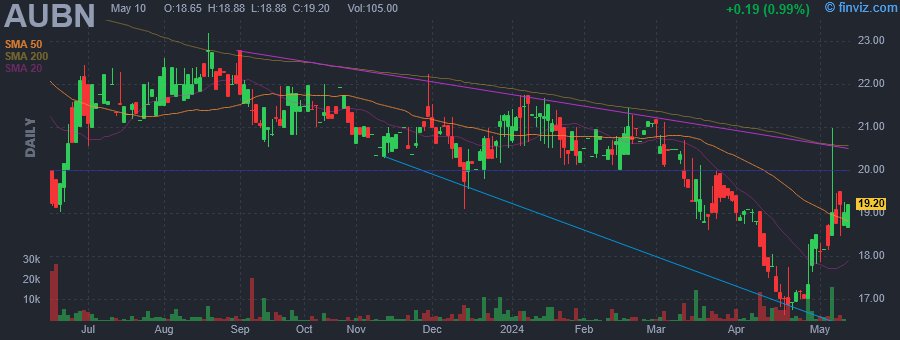 |
| Market Cap | 67.05M | EPS (ttm) | 0.23 |
| P/E | 84.19 | EPS this Y | - |
| Forward P/E | - | EPS next Y | - |
| PEG | - | EPS past 5Y | -30.30% |
| P/S | 2.06 | EPS next 5Y | - |
| P/B | 0.90 | EPS Q/Q | -30.03% |
| Dividend | 5.62% | Sales Q/Q | 12.06% |
| Insider Own | 56.53% | Inst Own | 8.39% |
| Insider Trans | 0.55% | Inst Trans | 4.80% |
| Short Float | 0.15% | Earnings | - |
| Analyst Recom | - | Target Price | - |
| Avg Volume | 4.01K | 52W Range | 16.61 - 23.20 |
|
|
|
|
Auburn National Bancorporation, Inc. is a bank holding company. It engages in the provision of banking services to commercial and retail customers. The firm operates through the following segments: Commercial and Industrial, Construction and Land Development, Commercial Real Estate, Residential Real Estate, and Consumer Installment. The Commercial and Industrial segment includes loans to finance business operations, equipment purchases, or other needs for small and medium-sized commercial customers. The Construction and Land Development segment is comprised of both loans and credit lines for the purpose of purchasing, carrying and developing land into commercial developments or residential subdivisions. The Commercial and Industrial segment provides loans disaggregated into three classes: owner occupied, multi-family and other. The Residential Real Estate segment is involved in consumer mortgage and investment property. The Consumer Installment segment encompasses loans to individuals both secured by personal property and unsecured. The company was founded in 1990 and is headquartered in Auburn, AL. |
| Insider Trading |
Relationship |
Date |
Transaction |
Cost |
#Shares |
Value ($) |
#Shares Total |
SEC Form 4 |
| Walker William James IV | SVP/CFO | May 29 '24 | Buy | 18.84 | 100 | 1,884 | 100 | May 29 03:43 PM | | HOUSEL DAVID E | Director | Apr 30 '24 | Buy | 18.16 | 100 | 1,816 | 7,445 | May 01 11:46 AM | | Hedges David A | President\CEO | Apr 26 '24 | Buy | 17.60 | 10,000 | 176,000 | 11,663 | Apr 29 12:00 PM | | Barrett J Tutt | Director | Apr 09 '24 | Buy | 19.25 | 93 | 1,791 | 8,553 | Apr 10 10:43 AM | | HAM WILLIAM F JR | Director | Apr 09 '24 | Buy | 19.21 | 72 | 1,383 | 4,841 | Apr 10 10:59 AM |
|
|
|
 |
| Market Cap | 937.22M | EPS (ttm) | 0.35 |
| P/E | 30.93 | EPS this Y | 517.00% |
| Forward P/E | 6.82 | EPS next Y | -5.98% |
| PEG | 2.58 | EPS past 5Y | -2.90% |
| P/S | 4.37 | EPS next 5Y | 12.00% |
| P/B | 0.71 | EPS Q/Q | -79.30% |
| Dividend | 12.27% | Sales Q/Q | 10.70% |
| Insider Own | 0.29% | Inst Own | 27.50% |
| Insider Trans | 0.40% | Inst Trans | 2.92% |
| Short Float | 1.24% | Earnings | May 01/b |
| Analyst Recom | 2.70 | Target Price | 11.00 |
| Avg Volume | 527.95K | 52W Range | 9.90 - 12.64 |
|
|
|
|
BlackRock TCP Capital Corp. is a business development company specializing in direct equity and debt investments in middle-market, small businesses, debt securities, senior secured loans, junior loans, originated loans, mezzanine, senior debt instruments, bonds, and secondary-market investments. It typically invests in communication services, public relations services, television, wireless telecommunication services, apparel, textile mills, restaurants, retailing, energy, oil and gas extraction, Patent owners and Lessors, Federal and Federally- Sponsored Credit agencies, insurance, hospital and healthcare centers, Biotechnology, engineering services, heavy electrical equipment, tax accounting, scientific and related consulting services, charter freight air transportation, Information technology consulting, application hosting services, software diagram and design, computer aided design, communication equipment, electronics manufacturing equipment, computer components, chemicals. It seeks to invest in the United States. The fund typically invests between $10 million and $35 million in companies with enterprise values between $100 million and $1500 million including complex situations. It prefers to make equity investments in companies for an ownership stake. |
| Insider Trading |
Relationship |
Date |
Transaction |
Cost |
#Shares |
Value ($) |
#Shares Total |
SEC Form 4 |
| DRAUT ERIC JOHN | Director | May 28 '24 | Buy | 10.89 | 1,000 | 10,890 | 53,532 | May 29 02:04 PM |
|
|
| |
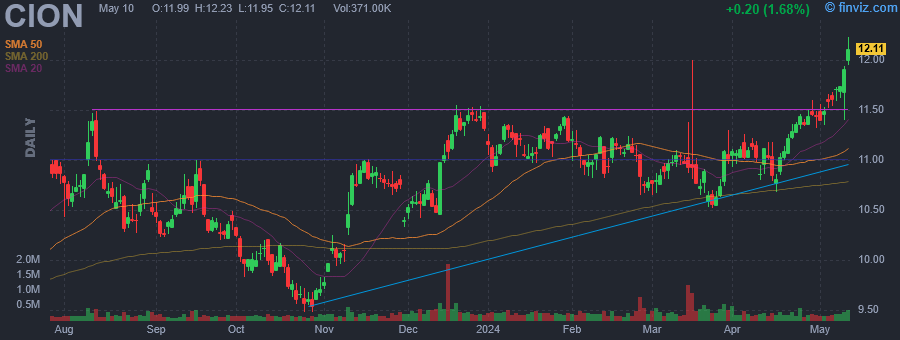 |
| Market Cap | 665.58M | EPS (ttm) | 2.44 |
| P/E | 5.09 | EPS this Y | 96.60% |
| Forward P/E | 7.89 | EPS next Y | -12.26% |
| PEG | - | EPS past 5Y | 26.00% |
| P/S | 2.56 | EPS next 5Y | - |
| P/B | 0.78 | EPS Q/Q | 121.20% |
| Dividend | 10.78% | Sales Q/Q | 13.20% |
| Insider Own | 0.30% | Inst Own | 29.00% |
| Insider Trans | 6.44% | Inst Trans | 52.78% |
| Short Float | 0.20% | Earnings | May 09/b |
| Analyst Recom | 3.00 | Target Price | 12.25 |
| Avg Volume | 293.14K | 52W Range | 9.09 - 12.69 |
|
|
|
|
CION Investment Corporation is a business development company. It specializes in investments in senior secured loans, including unitranche loans, First Lien, second lien loans, long-term subordinated loans, and mezzanine loans; equity interests such as warrants or options; and corporate bonds; and other debt securities in middle-market companies. The firm invests in growth capital, acquisitions, leveraged buyouts, market/product expansion, refinancing and recapitalization. The fund also invests up to 30 percent of their assets opportunistically in other types of investments, including the securities of larger public companies and foreign securities. It also makes investments in the secondary loan market. The fund does not invest in start-up companies, turnaround situations, or companies with speculative business plans. The fund prefers to invest in high tech industries, healthcare, pharmaceuticals, business services, media, chemicals, plastic, rubber, telecommunication, consumer services, advertising, printing and publishing, consumer goods, durables, diversified financials, and other industries. It also invests in homebuilding, restaurants, beverage and tobacco bars, broadcasting, distributors, Non-durable good distribution, food beverage and tobacco, energy, oil gas and consumables fuels, insurance, aerospace and defense, industrial machinery, paper and forest product machinery, information technology, metals and mining, and real estate. It primarily seeks to invest in the United States. The fund seeks to invest between $5 million and $50 million in companies with an EBITDA between $25 million and $75 million with average targeted hold of $25 million. It also purchases minority interests in the form of common or preferred equity in the target companies, typically in conjunction with its debt investments or through a co-investment with a financial sponsor. The fund seeks to exit its investments through an initial public offering of common stock, a merger, a sale, or other recapitalization. |
| Insider Trading |
Relationship |
Date |
Transaction |
Cost |
#Shares |
Value ($) |
#Shares Total |
SEC Form 4 |
| Pinero Eric A. | Chief Legal Officer | May 28 '24 | Buy | 12.42 | 403 | 5,005 | 7,539 | May 29 01:00 PM | | ROMAN STEPHEN | CCO & Secretary | May 22 '24 | Buy | 12.41 | 400 | 4,964 | 9,546 | May 22 11:47 AM | | BRESNER GREGG A. | President & CIO | May 17 '24 | Buy | 12.51 | 2,000 | 25,020 | 52,099 | May 17 03:19 PM | | Reisner Michael A | Co-Chairman & Co-CEO | May 13 '24 | Buy | 12.27 | 407 | 4,994 | 44,160 | May 14 02:30 PM | | Pinero Eric A. | Chief Legal Officer | Apr 05 '24 | Buy | 11.11 | 450 | 5,000 | 7,136 | Apr 05 04:01 PM |
|
|
|
 |
| Market Cap | 90.43M | EPS (ttm) | -0.06 |
| P/E | - | EPS this Y | - |
| Forward P/E | - | EPS next Y | - |
| PEG | - | EPS past 5Y | -31.37% |
| P/S | 2.29 | EPS next 5Y | - |
| P/B | 0.64 | EPS Q/Q | -145.13% |
| Dividend | - | Sales Q/Q | 11.40% |
| Insider Own | 67.49% | Inst Own | 7.89% |
| Insider Trans | 0.39% | Inst Trans | -3.69% |
| Short Float | 0.23% | Earnings | Apr 30/a |
| Analyst Recom | 3.00 | Target Price | 12.00 |
| Avg Volume | 7.78K | 52W Range | 6.46 - 8.75 |
|
|
|
|
Bogota Financial Corp. is a holding company, which engages in the provision of business activities that are permissible for mutual holding companies under New Jersey law, including investing in loans and securities. It includes the acquisition of banking and financial services companies. It operates through the following loan portfolio: residential first mortgage, commercial and multi-family real estate, construction, home equity and other, and commercial and industrial. The company was founded in September 2019 and is headquartered in Teaneck, NJ. |
| Insider Trading |
Relationship |
Date |
Transaction |
Cost |
#Shares |
Value ($) |
#Shares Total |
SEC Form 4 |
| Masterson John J. | Director | May 28 '24 | Buy | 6.78 | 208 | 1,410 | 173,984 | May 29 11:57 AM | | Masterson John J. | Director | May 02 '24 | Buy | 6.70 | 1,192 | 7,986 | 173,776 | May 06 01:37 PM | | Walsh Robert C. | Executive Vice President | Apr 09 '24 | Buy | 6.84 | 250 | 1,710 | 4,750 | Apr 10 12:09 PM | | Masterson John J. | Director | Mar 15 '24 | Buy | 7.30 | 1,400 | 10,220 | 172,584 | Mar 15 05:06 PM | | Pace Kevin | President and CEO | Mar 15 '24 | Buy | 7.30 | 125 | 912 | 43,903 | Mar 18 10:23 AM |
|
|
| |
 |
| Market Cap | 18.45B | EPS (ttm) | 10.19 |
| P/E | 30.53 | EPS this Y | 0.63% |
| Forward P/E | 23.87 | EPS next Y | 10.23% |
| PEG | 5.51 | EPS past 5Y | 7.21% |
| P/S | 6.34 | EPS next 5Y | 5.54% |
| P/B | 14.68 | EPS Q/Q | -27.62% |
| Dividend | - | Sales Q/Q | -6.99% |
| Insider Own | 0.21% | Inst Own | 100.97% |
| Insider Trans | -2.73% | Inst Trans | -0.12% |
| Short Float | 6.37% | Earnings | May 07/b |
| Analyst Recom | 3.15 | Target Price | 325.40 |
| Avg Volume | 429.15K | 52W Range | 231.90 - 367.21 |
|
|
|
|
Waters Corp. engages in the provision of workflow solutions involving liquid chromatography, mass spectrometry, and thermal analysis. It operates through the Waters and TA (TA Instruments) segments. The Waters segment consists of liquid chromatography instruments, mass spectrometry, and precision chemistry consumable products and services. The TA segment products and services include thermal analysis, rheometry and calorimetry instrument systems, and service sales. The company was founded by James Logan Waters in 1958 and is headquartered in Milford, MA. |
| Insider Trading |
Relationship |
Date |
Transaction |
Cost |
#Shares |
Value ($) |
#Shares Total |
SEC Form 4 |
| FEARON RICHARD H | Director | May 28 '24 | Buy | 332.90 | 1,000 | 332,900 | 1,653 | May 29 11:23 AM | | KUEBLER CHRISTOPHER A | Director | May 15 '24 | Option Exercise | 113.88 | 4,000 | 455,520 | 18,716 | May 16 10:55 AM | | KUEBLER CHRISTOPHER A | Director | May 15 '24 | Sale | 361.64 | 4,000 | 1,446,560 | 14,716 | May 16 10:55 AM | | BADDOUR LINDA | Director | Mar 13 '24 | Sale | 355.54 | 500 | 177,770 | 2,250 | Mar 14 11:08 AM | | KUEBLER CHRISTOPHER A | Director | Aug 04 '23 | Option Exercise | 99.22 | 4,000 | 396,880 | 18,382 | Aug 07 09:10 AM |
|
|
|
 |
| Market Cap | 4.24B | EPS (ttm) | 4.49 |
| P/E | 11.17 | EPS this Y | 53.45% |
| Forward P/E | 7.44 | EPS next Y | 4.56% |
| PEG | - | EPS past 5Y | - |
| P/S | 0.18 | EPS next 5Y | -0.20% |
| P/B | 3.78 | EPS Q/Q | 60.30% |
| Dividend | 6.93% | Sales Q/Q | 2.56% |
| Insider Own | 34.80% | Inst Own | 24.76% |
| Insider Trans | 0.01% | Inst Trans | -2.39% |
| Short Float | 4.43% | Earnings | May 08/b |
| Analyst Recom | 2.57 | Target Price | 62.00 |
| Avg Volume | 538.97K | 52W Range | 41.95 - 64.89 |
|
|
|
May-28-24 01:34PM
|
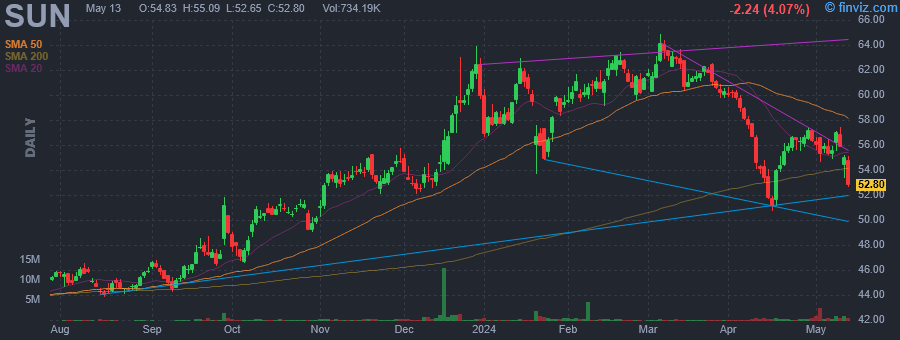
Hedge Fund and Insider Trading News: Alan Howard, Highbridge Capital, Elliott Management, Tide Capital, ExodusPoint Capital Management, Integra LifeSciences Holdings Corporation (IART), Sunoco LP (SUN), and More
(Insider Monkey) |
|
May-24-24 09:08PM
|
Lightning Round: Moderna, Comfort System USA, Sunoco, Celestica and AMC
(CNBC TV) |
|
10:31AM
|
Here's Why It Is Worth Investing in Sunoco (SUN) Stock Now
(Zacks) |
|
May-21-24 09:40AM
|
Should Value Investors Buy Sunoco (SUN) Stock?
(Zacks) |
|
May-20-24 02:18PM
|
1Q24: MLPs Beat Analyst Expectations and Raise Guidance
(ETF Trends) |
|
May-13-24 11:44AM
|
12 Undervalued Stocks That Just Raised Their Dividends
(Insider Monkey) |
|
May-10-24 07:05AM
|
Sunoco LP's Dividend Analysis
(GuruFocus.com) |
|
May-09-24 04:31PM
|
Energy Transfer LP (NYSE:ET) Q1 2024 Earnings Call Transcript
(Insider Monkey) |
|
01:36PM
|
Dont Miss Dividend Growth in Midstream
(ETF Trends) |
|
01:17PM
|
Sunoco LP (NYSE:SUN) Q1 2024 Earnings Call Transcript
(Insider Monkey) |
|
Sunoco LP engages in the management and distribution of fuel products. It operates through Fuel Distribution and Marketing and All Other segments. The Fuel Distribution and Marketing segment supplies fuels and other petroleum products, which it supplies to third-party dealers and distributors, independent operators of commission agent, other commercial consumers of motor fuel and to retail locations. The All Other segment refers to motor fuel sales, non-motor fuel sales, and lease income. The company was founded in 1886 and is headquartered in Dallas, TX. |
| Insider Trading |
Relationship |
Date |
Transaction |
Cost |
#Shares |
Value ($) |
#Shares Total |
SEC Form 4 |
| Fails Karl R | EVP & Chief Operations Officer | May 24 '24 | Buy | 50.18 | 3,000 | 150,540 | 230,916 | May 29 09:00 AM | | Hand Brian A | EVP-Chief Sales Officer | May 24 '24 | Buy | 49.59 | 2,000 | 99,180 | 153,255 | May 29 09:00 AM | | Kim Joseph | President & CEO | May 23 '24 | Buy | 50.50 | 5,000 | 252,516 | 10,000 | May 28 09:00 AM | | Skidmore David K | Director | Apr 17 '24 | Buy | 52.10 | 1,500 | 78,144 | 14,608 | Apr 19 04:10 PM | | Dodderer Arnold | GC & Asst. Sec. | Dec 05 '23 | Sale | 53.20 | 7,832 | 416,623 | 77,890 | Dec 07 06:17 PM |
|
|
| |
 |
| Market Cap | 1.35B | EPS (ttm) | 1.12 |
| P/E | 4.85 | EPS this Y | 11.20% |
| Forward P/E | - | EPS next Y | - |
| PEG | - | EPS past 5Y | 0.10% |
| P/S | 4.85 | EPS next 5Y | - |
| P/B | 1.13 | EPS Q/Q | - |
| Dividend | 17.57% | Sales Q/Q | 13.10% |
| Insider Own | 0.19% | Inst Own | 5.11% |
| Insider Trans | - | Inst Trans | - |
| Short Float | 0.73% | Earnings | May 14/a |
| Analyst Recom | 1.50 | Target Price | 6.00 |
| Avg Volume | 2.45M | 52W Range | 4.41 - 5.70 |
|
|
|
|
Oxford Lane Capital Corp. is a close ended fund launched and managed by Oxford Lane Management LLC. It invests in fixed income securities. The fund primarily invests in securitization vehicles which in turn invest in senior secured loans made to companies whose debt is rated below investment grade or is unrated. Oxford Lane Capital Corp was formed on June 9, 2010 and is domiciled in the United States. |
| Insider Trading |
Relationship |
Date |
Transaction |
Cost |
#Shares |
Value ($) |
#Shares Total |
SEC Form 4 |
| COHEN JONATHAN H | Chief Executive Officer | May 28 '24 | Buy | 5.40 | 4,630,000 | 25,002,000 | 4,864,728 | May 29 08:00 AM | | ROSENTHAL SAUL B | President | May 28 '24 | Buy | 5.40 | 2,315,000 | 12,501,000 | 2,315,000 | May 29 08:01 AM | | ROSENTHAL SAUL B | President | May 28 '24 | Buy | 5.40 | 2,315,000 | 12,501,000 | 2,514,887 | May 29 08:01 AM |
|
|
|
 |
| Market Cap | 69.43M | EPS (ttm) | -0.10 |
| P/E | - | EPS this Y | - |
| Forward P/E | - | EPS next Y | - |
| PEG | - | EPS past 5Y | - |
| P/S | - | EPS next 5Y | - |
| P/B | 6.13 | EPS Q/Q | -234.89% |
| Dividend | - | Sales Q/Q | - |
| Insider Own | 95.24% | Inst Own | 4.31% |
| Insider Trans | 2.40% | Inst Trans | - |
| Short Float | 4.15% | Earnings | - |
| Analyst Recom | - | Target Price | - |
| Avg Volume | 3.46K | 52W Range | 10.21 - 16.73 |
|
|
|
|
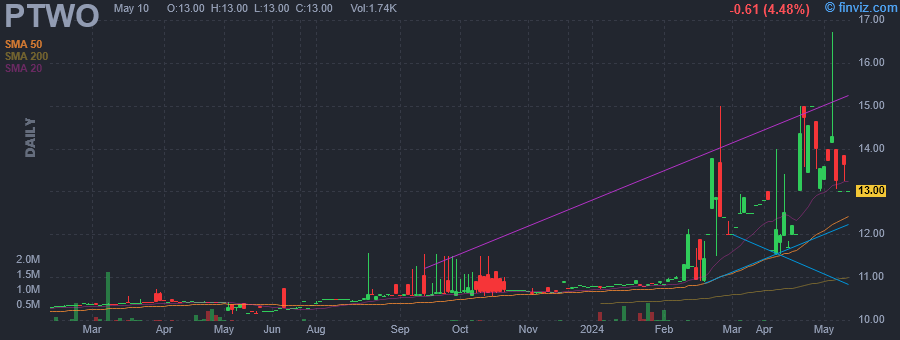
Pono Capital Two, Inc. operates as a blank check company, which was formed for the purpose of effecting a merger, capital stock exchange, asset acquisition, stock purchase, reorganization, or similar business combination with one or more businesses. The company was founded on March 11, 2022 and is headquartered in Honolulu, HI. |
| Insider Trading |
Relationship |
Date |
Transaction |
Cost |
#Shares |
Value ($) |
#Shares Total |
SEC Form 4 |
| ZUU Co. Ltd. | 10% Owner | May 23 '24 | Buy | 13.00 | 789 | 10,257 | 1,459,163 | May 28 09:00 PM | | ZUU Co. Ltd. | 10% Owner | May 16 '24 | Buy | 13.00 | 1 | 13 | 1,458,374 | May 20 09:00 PM | | ZUU Co. Ltd. | 10% Owner | May 15 '24 | Buy | 13.00 | 8 | 104 | 1,458,373 | May 15 09:00 PM | | ZUU Co. Ltd. | 10% Owner | May 14 '24 | Buy | 12.99 | 140 | 1,819 | 1,458,365 | May 15 09:00 PM | | ZUU Co. Ltd. | 10% Owner | May 13 '24 | Buy | 13.00 | 190 | 2,470 | 1,458,225 | May 15 09:00 PM |
|
|
|
 |
| Market Cap | 997.85M | EPS (ttm) | -1.00 |
| P/E | - | EPS this Y | 64.54% |
| Forward P/E | - | EPS next Y | 47.00% |
| PEG | - | EPS past 5Y | 8.72% |
| P/S | 7.87 | EPS next 5Y | - |
| P/B | 1.72 | EPS Q/Q | -24.79% |
| Dividend | - | Sales Q/Q | 81.30% |
| Insider Own | 1.64% | Inst Own | 69.84% |
| Insider Trans | 57.90% | Inst Trans | -1.58% |
| Short Float | 3.21% | Earnings | May 08/a |
| Analyst Recom | 1.00 | Target Price | 3.58 |
| Avg Volume | 2.58M | 52W Range | 1.57 - 3.16 |
|
|
|
|
Standard BioTools Inc. engages in the provision of biotechnology tools and services for clinical research. It sells preparatory and analytical instruments for mass cytometry, polymerase chain reaction, library prep, single cell genomics, and consumables including integrated fluidic circuits (IFCs), assays, and reagents. The company was founded by Stephen D. Quake and Gajus Vincent Worthington on May 19, 1999 and is headquartered in South San Francisco, CA. |
| Insider Trading |
Relationship |
Date |
Transaction |
Cost |
#Shares |
Value ($) |
#Shares Total |
SEC Form 4 |
| Casdin Partners Master Fund, L | Director | May 23 '24 | Buy | 2.60 | 100,000 | 260,000 | 46,075,821 | May 28 08:45 PM | | Casdin Partners Master Fund, L | Director | May 22 '24 | Buy | 2.58 | 150,000 | 387,735 | 45,975,821 | May 22 07:53 PM | | Casdin Partners Master Fund, L | Director | May 21 '24 | Buy | 2.56 | 350,000 | 895,930 | 45,825,821 | May 22 07:53 PM | | Casdin Partners Master Fund, L | Director | May 20 '24 | Buy | 2.58 | 100,000 | 258,130 | 45,475,821 | May 22 07:53 PM | | Casdin Partners Master Fund, L | Director | May 17 '24 | Buy | 2.56 | 352,072 | 902,044 | 45,375,821 | May 17 08:11 PM |
|
|
|
