 |
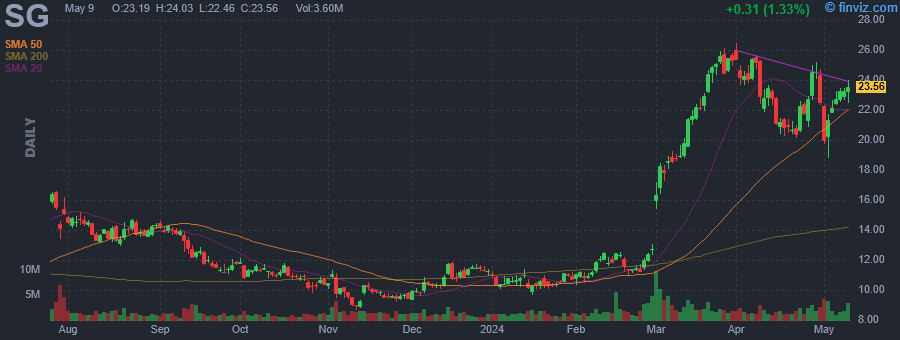
| Market Cap | 3.60B | EPS (ttm) | -0.94 |
| P/E | - | EPS this Y | 25.18% |
| Forward P/E | - | EPS next Y | 21.17% |
| PEG | - | EPS past 5Y | -12.71% |
| P/S | 5.84 | EPS next 5Y | 27.00% |
| P/B | 7.65 | EPS Q/Q | 23.54% |
| Dividend | - | Sales Q/Q | 26.22% |
| Insider Own | 14.65% | Inst Own | 78.71% |
| Insider Trans | -4.35% | Inst Trans | 15.53% |
| Short Float | 12.54% | Earnings | May 09/a |
| Analyst Recom | 1.89 | Target Price | 29.25 |
| Avg Volume | 3.00M | 52W Range | 8.64 - 34.45 |
|
|
|
May-16-24 04:42PM
|
Sweetgreen Insider Sold Shares Worth $4,695,375, According to a Recent SEC Filing
(MT Newswires) |
|
May-14-24 06:00AM
|
How Sweetgreen has benefitted from its recent success
(Nation's Restaurant News) |
|
May-13-24 03:07PM
|
Sweetgreen beats sad desk salad vibes to soar above fast-food competitors. It can thank fancy foods, high pricesand robots
(Fortune) |
|
May-10-24 05:56PM
|
Fed rates, Tesla Supercharger backpedal, Novavax's 'new chapter': Market Domination
(Yahoo Finance Video) +33.96% |
|
04:27PM
|
Sweetgreen, This Year's Fastest-Rising Restaurant Stock, Is Making Another Big Move
(Investor's Business Daily) |
|
02:27PM
|
Sweetgreen sees 5% same-store sales increases amid rising labor costs in California
(Nation's Restaurant News) |
|
02:24PM
|
Sweetgreen's Shares Surge as RBC Points to Ongoing Comparable Sales Momentum
(MT Newswires) |
|
01:55PM
|
Sweetgreen Is Flying. Its a Growth Stock With Salad Robots.
(Barrons.com) |
|
01:27PM
|
Biden's reported tariffs, Novavax and Sweetgreen shares: Yahoo Finance
(Yahoo Finance Video) |
|
01:23PM
|
Top Stock Movers Now: TSMC, Moderna, Sweetgreen, and More
(Investopedia) |
|
Sweetgreen, Inc. owns and operates a chain of salad restaurants. It offers drinks, sides, local bowls, salads, plates, and warm bowls. The company was founded by Nicolas Jammet, Jonathan Neman and Nathaniel E. Ru in November 2006 and is headquartered in Los Angeles, CA. |
| Insider Trading |
Relationship |
Date |
Transaction |
Cost |
#Shares |
Value ($) |
#Shares Total |
SEC Form 4 |
| Neman Jonathan | CHIEF EXECUTIVE OFFICER | May 15 '24 | Sale | 31.30 | 200,000 | 6,260,500 | 0 | May 16 04:38 PM | | Ru Nathaniel | Chief Brand Officer | May 15 '24 | Sale | 31.30 | 150,000 | 4,695,375 | 0 | May 16 04:36 PM | | Jammet Nicolas | Chief Concept Officer | May 15 '24 | Sale | 31.30 | 150,000 | 4,695,375 | 0 | May 16 04:37 PM | | Reback Mitch | CHIEF FINANCIAL OFFICER | Mar 12 '24 | Sale | 21.01 | 29,475 | 619,270 | 405,584 | Mar 12 06:36 PM | | Neman Jonathan | CHIEF EXECUTIVE OFFICER | Mar 01 '24 | Sale | 16.36 | 58,067 | 950,120 | 0 | Mar 04 07:37 PM |
|
|
 |
 |
| Market Cap | 5.42B | EPS (ttm) | 12.29 |
| P/E | 11.17 | EPS this Y | -11.98% |
| Forward P/E | 12.18 | EPS next Y | 5.62% |
| PEG | - | EPS past 5Y | 87.73% |
| P/S | 0.78 | EPS next 5Y | - |
| P/B | 2.40 | EPS Q/Q | 7.32% |
| Dividend | 0.58% | Sales Q/Q | 6.55% |
| Insider Own | 1.00% | Inst Own | 97.83% |
| Insider Trans | -7.05% | Inst Trans | -0.79% |
| Short Float | 2.89% | Earnings | May 06/a |
| Analyst Recom | 2.57 | Target Price | 149.33 |
| Avg Volume | 352.12K | 52W Range | 67.12 - 154.67 |
|
|
|
|
Boise Cascade Co. engages in the manufacture and distribution of engineered wood products (EWP) and plywood. It operates through the Wood Products and Building Materials Distribution (BMD) segments. The Wood Products segment manufactures and sells engineered wood products, plywood, particleboard, studs and ponderosa pine lumber. The Building Materials Distribution segment distributes and sells a broad line of building materials, including engineered wood products, oriented strand board, plywood, lumber, and general line items such as siding, metal products, insulation, roofing, and composite decking. The company was founded in 1957 and is headquartered in Boise, ID. |
| Insider Trading |
Relationship |
Date |
Transaction |
Cost |
#Shares |
Value ($) |
#Shares Total |
SEC Form 4 |
| Strom Jeffrey Robert | EVP, BMD | May 15 '24 | Sale | 140.00 | 3,000 | 420,000 | 40,353 | May 16 04:36 PM | | Twedt Jill | SVP General Counsel & Corp Sec | May 13 '24 | Sale | 135.00 | 1,852 | 250,020 | 37,437 | May 13 04:53 PM | | Strom Jeffrey Robert | EVP, BMD | May 09 '24 | Sale | 135.00 | 2,500 | 337,500 | 43,353 | May 13 04:50 PM | | HOGANS MACK L | Director | Apr 05 '24 | Sale | 149.15 | 0 | 17 | 3,055 | Apr 08 04:55 PM | | Brown Dean Michael | EVP, Wood Products | Mar 04 '24 | Sale | 139.09 | 11,117 | 1,546,239 | 40,237 | Mar 05 06:24 PM |
|
|
|
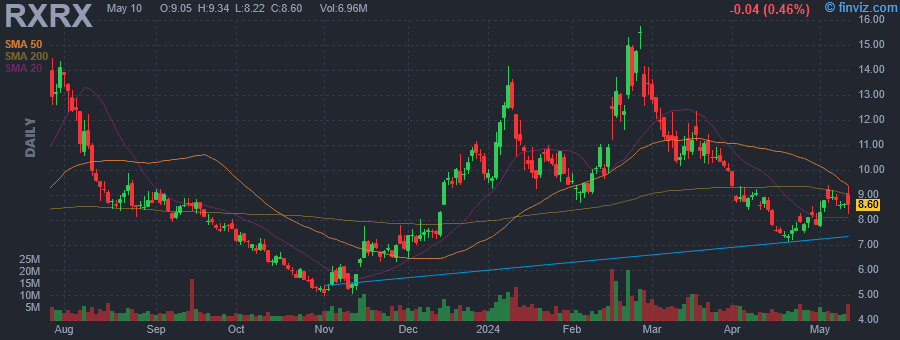 |
| Market Cap | 2.26B | EPS (ttm) | -1.60 |
| P/E | - | EPS this Y | -5.93% |
| Forward P/E | - | EPS next Y | -8.96% |
| PEG | - | EPS past 5Y | -43.41% |
| P/S | 48.86 | EPS next 5Y | 12.00% |
| P/B | 5.81 | EPS Q/Q | -13.55% |
| Dividend | - | Sales Q/Q | 13.68% |
| Insider Own | 22.27% | Inst Own | 71.65% |
| Insider Trans | -2.07% | Inst Trans | 4.55% |
| Short Float | 21.94% | Earnings | May 09/a |
| Analyst Recom | 2.43 | Target Price | 13.00 |
| Avg Volume | 6.24M | 52W Range | 4.92 - 16.75 |
|
|
|
|
Recursion Pharmaceuticals, Inc. is a clinical-stage biotechnology company that combines automation, artificial intelligence, machine learning, and in vivo validation capabilities to discover novel medicines. Its Recursion operating system enables advanced machine learning approaches to reveal drug candidates, mechanisms of action, novel chemistry, and potential toxicity, with the eventual goal of decoding biology and advancing new therapeutics that radically improve people's lives. The company was founded by Blake Borgeson, Christopher C. Gibson, and Dean Y. Li on November 5, 2013 and is headquartered in Salt Lake City, UT. |
| Insider Trading |
Relationship |
Date |
Transaction |
Cost |
#Shares |
Value ($) |
#Shares Total |
SEC Form 4 |
| Borgeson Blake | Director | May 14 '24 | Sale | 10.12 | 20,054 | 202,934 | 7,198,360 | May 16 04:35 PM | | Gibson Christopher | Chief Executive Officer | May 02 '24 | Sale | 8.47 | 50,000 | 423,500 | 834,820 | May 03 06:24 PM | | Gibson Christopher | Chief Executive Officer | May 01 '24 | Sale | 7.73 | 50,000 | 386,500 | 863,524 | May 03 06:24 PM | | Borgeson Blake | Director | Apr 30 '24 | Sale | 7.95 | 11,447 | 90,964 | 7,218,414 | May 02 05:41 PM | | Marriott Tina | President and COO | Apr 25 '24 | Option Exercise | 1.06 | 3,000 | 3,180 | 546,231 | Apr 29 06:41 PM |
|
|
| |
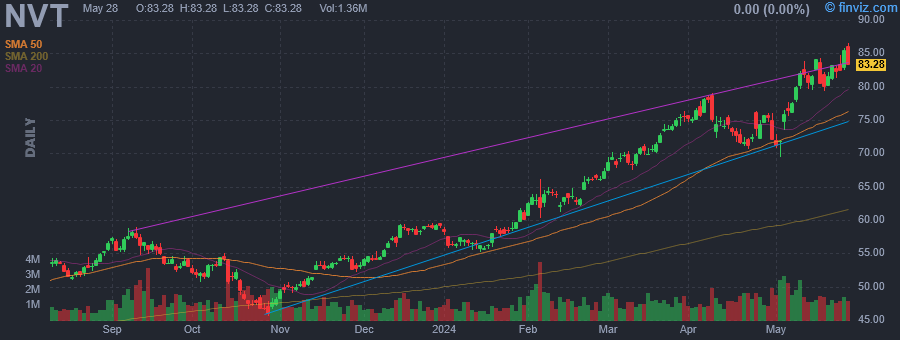 |
| Market Cap | 13.35B | EPS (ttm) | 3.44 |
| P/E | 23.40 | EPS this Y | 6.41% |
| Forward P/E | 22.60 | EPS next Y | 9.28% |
| PEG | 3.00 | EPS past 5Y | 21.44% |
| P/S | 3.93 | EPS next 5Y | 7.80% |
| P/B | 4.16 | EPS Q/Q | 11.71% |
| Dividend | 0.90% | Sales Q/Q | 18.09% |
| Insider Own | 1.09% | Inst Own | 92.65% |
| Insider Trans | -19.38% | Inst Trans | -0.74% |
| Short Float | 1.06% | Earnings | May 03/b |
| Analyst Recom | 1.79 | Target Price | 85.71 |
| Avg Volume | 1.43M | 52W Range | 40.22 - 84.19 |
|
|
|
|
nVent Electric Plc engages in the provision of electrical connection and protection solutions. It operates through the following segments: Enclosures, Thermal Management, and Electrical & Fastening Solutions. The Enclosures segment offers solutions that protect, connect, and manage heat in critical electronics, communication, control, and power equipment. The Thermal Management segment includes electric thermal solutions that connect and protect critical buildings, infrastructure, industrial processes, and people. The Electrical & Fastening Solution segment consists of fastening solutions that connect and protect electrical and mechanical systems and civil structures. The company was founded on May 30, 2017, and is headquartered in London, the United Kingdom. |
| Insider Trading |
Relationship |
Date |
Transaction |
Cost |
#Shares |
Value ($) |
#Shares Total |
SEC Form 4 |
| Ruzynski Joseph A. | President of Enclosures | May 15 '24 | Option Exercise | 25.24 | 23,767 | 599,943 | 101,960 | May 16 04:35 PM | | Ruzynski Joseph A. | President of Enclosures | May 14 '24 | Option Exercise | 26.95 | 125,325 | 3,377,861 | 157,845 | May 16 04:35 PM | | Ruzynski Joseph A. | President of Enclosures | May 14 '24 | Sale | 80.94 | 20,500 | 1,659,372 | 32,520 | May 16 04:35 PM | | van der Kolk Robert J. | See Remarks below | Mar 01 '24 | Option Exercise | 0.00 | 4,139 | 0 | 46,324 | Mar 05 06:38 PM | | Faulconer Michael B | President - Thermal Management | Mar 01 '24 | Option Exercise | 0.00 | 4,139 | 0 | 37,248 | Mar 05 06:16 PM |
|
|
|
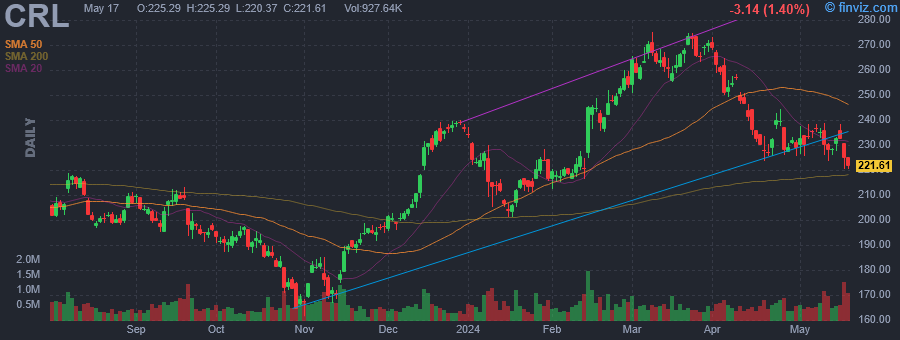 |
| Market Cap | 11.58B | EPS (ttm) | 8.61 |
| P/E | 26.10 | EPS this Y | 3.35% |
| Forward P/E | 18.12 | EPS next Y | 12.47% |
| PEG | 2.77 | EPS past 5Y | 14.84% |
| P/S | 2.82 | EPS next 5Y | 9.41% |
| P/B | 3.18 | EPS Q/Q | -29.82% |
| Dividend | - | Sales Q/Q | -1.73% |
| Insider Own | 2.04% | Inst Own | 102.24% |
| Insider Trans | -2.85% | Inst Trans | 3.21% |
| Short Float | 3.76% | Earnings | May 09/b |
| Analyst Recom | 1.94 | Target Price | 263.40 |
| Avg Volume | 530.26K | 52W Range | 161.65 - 275.00 |
|
|
|
|
Charles River Laboratories International, Inc. engages in providing products and services to help pharmaceutical and biotechnology companies. It operates through the following segments: Research Models and Services (RMS), Discovery and Safety Assessment (DSA), and Manufacturing Solutions. The RMS segment includes its insourcing solutions business and Charles River accelerator and development lab footprint. The DSA segment offers regulatory-required safety testing of potential new drugs, vaccines, industrial and agricultural chemicals, consumer products, veterinary medicines, and medical devices. The Manufacturing Solutions segment focuses on microbial solutions and biologics solutions. The company was founded by Henry L. Foster in 1947 and is headquartered in Wilmington, MA. |
| Insider Trading |
Relationship |
Date |
Transaction |
Cost |
#Shares |
Value ($) |
#Shares Total |
SEC Form 4 |
| MASSARO GEORGE | Director | May 15 '24 | Sale | 235.62 | 332 | 78,225 | 5,855 | May 16 04:35 PM | | LaPlume Joseph W | EVP, Corp Strategy & Develop | May 10 '24 | Sale | 226.97 | 1,304 | 295,969 | 23,276 | May 14 04:49 PM | | Knell Michael Gunnar | CSVP&Chief Accounting Officer | Mar 08 '24 | Sale | 267.52 | 808 | 216,156 | 7,024 | Mar 11 04:42 PM | | Knell Michael Gunnar | CSVP&Chief Accounting Officer | Mar 04 '24 | Sale | 261.05 | 2,750 | 717,890 | 7,832 | Mar 05 04:54 PM | | Creamer Victoria L | EVP & Chief People Officer | Feb 29 '24 | Sale | 253.70 | 5,000 | 1,268,500 | 13,550 | Mar 01 05:37 PM |
|
|
| |
 |
| Market Cap | 3.21B | EPS (ttm) | 4.44 |
| P/E | 37.28 | EPS this Y | 17.87% |
| Forward P/E | 26.89 | EPS next Y | 16.10% |
| PEG | - | EPS past 5Y | -5.80% |
| P/S | 2.04 | EPS next 5Y | - |
| P/B | 3.50 | EPS Q/Q | 92.75% |
| Dividend | 1.75% | Sales Q/Q | 6.48% |
| Insider Own | 21.62% | Inst Own | 77.38% |
| Insider Trans | -0.57% | Inst Trans | -1.43% |
| Short Float | 4.44% | Earnings | May 06/a |
| Analyst Recom | 2.00 | Target Price | 182.00 |
| Avg Volume | 88.65K | 52W Range | 133.23 - 177.71 |
|
|
|
|
J&J Snack Foods Corp. engages in the manufacturing of nutritional snack foods and distribution of frozen beverages to the food service and retail supermarket industries. It operates through the following segments: Food Service, Retail Supermarkets, and Frozen Beverages. The Food Service segment includes soft pretzels, frozen novelties, churros, handheld products, and baked goods. The Retail Supermarkets segment offers soft pretzel products including Superpretzel, frozen juice treats and desserts, including Luigi's real Italian ice, Minute Maid juice bars and soft frozen lemonade, Whole Fruit frozen fruit bars and sorbet, Philly Swirl cups and sticks, ICEE Squeeze-Up Tubes and dough enrobed handheld products including Patio burritos. The Frozen Beverages segment provides frozen beverages to the food service industry primarily under the names ICEE, SLUSH PUPPIE, and PARROT ICE in the United States, Mexico, and Canada, as well as repair and maintenance services. The company was founded by Gerald B. Shreiber in 1971 and is headquartered in Mount Laurel, NJ. |
| Insider Trading |
Relationship |
Date |
Transaction |
Cost |
#Shares |
Value ($) |
#Shares Total |
SEC Form 4 |
| Roshkoff Marjorie Shreiber | Director | May 15 '24 | Sale | 161.34 | 625 | 100,840 | 68,834 | May 16 04:34 PM | | Cranmer Robert | Senior VP, Operations | May 09 '24 | Option Exercise | 125.83 | 1,500 | 188,745 | 3,150 | May 13 04:32 PM | | Cranmer Robert | Senior VP, Operations | May 09 '24 | Sale | 162.03 | 2,278 | 369,111 | 872 | May 13 04:32 PM | | Roshkoff Marjorie Shreiber | Director | Feb 15 '24 | Sale | 147.73 | 625 | 92,334 | 69,459 | Feb 20 04:33 PM | | FACHNER DAN | Chairman, President & CEO | Nov 30 '23 | Option Exercise | 125.83 | 11,580 | 1,457,111 | 41,360 | Dec 01 04:32 PM |
|
|
|
 |
| Market Cap | 2.54B | EPS (ttm) | 1.57 |
| P/E | 14.75 | EPS this Y | 21.05% |
| Forward P/E | 6.16 | EPS next Y | 87.29% |
| PEG | - | EPS past 5Y | - |
| P/S | 3.89 | EPS next 5Y | -0.30% |
| P/B | 2.38 | EPS Q/Q | 704.62% |
| Dividend | 3.49% | Sales Q/Q | 25.58% |
| Insider Own | 41.22% | Inst Own | 42.32% |
| Insider Trans | -1.51% | Inst Trans | - |
| Short Float | 9.51% | Earnings | May 06/b |
| Analyst Recom | 1.27 | Target Price | 26.00 |
| Avg Volume | 860.12K | 52W Range | 15.12 - 24.49 |
|
|
|
|
Atlas Energy Solutions, Inc. operates as a proppant and proppant logistics company. It offers services to the oil and gas industry. The company was founded by Ben M. Brigham in 2017 and is headquartered in Austin, TX. |
| Insider Trading |
Relationship |
Date |
Transaction |
Cost |
#Shares |
Value ($) |
#Shares Total |
SEC Form 4 |
| McEver Chad M. | Member of 10% Owner Group | May 14 '24 | Sale | 22.97 | 5,595 | 128,517 | 551,755 | May 16 04:34 PM | | Schmidt Richard W | Member of 10% Owner Group | May 10 '24 | Sale | 22.80 | 22,400 | 510,720 | 1,029,263 | May 13 04:38 PM | | Schmidt Richard W | Member of 10% Owner Group | May 09 '24 | Sale | 22.98 | 51,150 | 1,175,427 | 1,051,663 | May 13 04:38 PM | | Schmidt Richard W | Member of 10% Owner Group | Mar 26 '24 | Sale | 22.21 | 16,740 | 371,795 | 1,102,813 | Mar 27 01:25 PM | | Schmidt Richard W | Member of 10% Owner Group | Mar 25 '24 | Sale | 22.44 | 21,043 | 472,205 | 1,119,553 | Mar 27 01:25 PM |
|
|
| |
 |
| Market Cap | 22.80B | EPS (ttm) | 3.81 |
| P/E | 60.60 | EPS this Y | 4.21% |
| Forward P/E | 22.93 | EPS next Y | 9.37% |
| PEG | 6.06 | EPS past 5Y | 1.36% |
| P/S | 4.19 | EPS next 5Y | 10.00% |
| P/B | 3.55 | EPS Q/Q | -100.74% |
| Dividend | 0.97% | Sales Q/Q | 2.49% |
| Insider Own | 0.30% | Inst Own | 97.87% |
| Insider Trans | -3.78% | Inst Trans | 0.33% |
| Short Float | 2.41% | Earnings | May 08/a |
| Analyst Recom | 2.00 | Target Price | 241.57 |
| Avg Volume | 510.16K | 52W Range | 195.47 - 254.00 |
|
|
|
|
STERIS Plc engages in the provision of healthcare and life science products and service solutions. It operates through the following segments: Healthcare, Life Sciences, Applied Sterilization Technologies, and Dental. The Healthcare segment provides a comprehensive offering for healthcare providers worldwide, focused on sterile processing departments and procedural centers, such as operating rooms and endoscopy suites. The Life Sciences segment designs, manufactures, and sells consumable products, equipment maintenance, specialty services, and capital equipment. The Applied Sterilization Technologies segment is involved in contract sterilization and testing services for medical device and pharmaceutical manufacturers. The Dental segment offers a comprehensive offering for dental practitioners and dental schools, offering instruments, infection prevention consumables and instrument management systems. The company was founded in 1985 and is headquartered in Dublin, Ireland. |
| Insider Trading |
Relationship |
Date |
Transaction |
Cost |
#Shares |
Value ($) |
#Shares Total |
SEC Form 4 |
| Sohi Mohsen | Director | May 14 '24 | Option Exercise | 51.53 | 2,037 | 104,967 | 24,398 | May 16 04:33 PM | | Burton Karen L | VP & CAO | May 14 '24 | Sale | 235.95 | 3,000 | 707,850 | 3,759 | May 16 04:31 PM | | Sohi Mohsen | Director | May 14 '24 | Sale | 233.72 | 2,037 | 476,093 | 22,361 | May 16 04:33 PM | | KOSECOFF JACQUELINE B | Director | May 13 '24 | Option Exercise | 51.53 | 4,584 | 236,214 | 4,584 | May 15 04:39 PM | | KOSECOFF JACQUELINE B | Director | May 13 '24 | Sale | 231.53 | 4,584 | 1,061,334 | 0 | May 15 04:39 PM |
|
|
|
 |
| Market Cap | 7.72B | EPS (ttm) | -6.54 |
| P/E | - | EPS this Y | 4.26% |
| Forward P/E | 10.79 | EPS next Y | 16.94% |
| PEG | - | EPS past 5Y | - |
| P/S | 0.70 | EPS next 5Y | 10.50% |
| P/B | 1.01 | EPS Q/Q | 30.55% |
| Dividend | - | Sales Q/Q | -4.52% |
| Insider Own | 17.45% | Inst Own | 80.31% |
| Insider Trans | -0.16% | Inst Trans | 0.19% |
| Short Float | 3.24% | Earnings | Apr 25/a |
| Analyst Recom | 2.76 | Target Price | 126.14 |
| Avg Volume | 604.92K | 52W Range | 76.02 - 131.19 |
|
|
|
|
Mohawk Industries, Inc. engages in the manufacture, design, and distribution of residential and commercial flooring products. It operates through the following segments: Global Ceramic, Flooring North America (NA), and Flooring Rest of the World (ROW). The Global Ceramic segment designs, manufactures, sources, distributes and markets a broad line of ceramic, porcelain and natural stone tile products. The Flooring NA segment includes floor covering product lines, in a broad range of colors, textures, and patterns. The Flooring ROW segment consists of laminate, hardwood flooring, and vinyl flooring products, roofing elements, insulation boards, medium-density fiberboard, and chipboards. The company was founded on December 22, 1988, and is headquartered in Calhoun, GA. |
| Insider Trading |
Relationship |
Date |
Transaction |
Cost |
#Shares |
Value ($) |
#Shares Total |
SEC Form 4 |
| Patton Rodney David | VP BUSINESS STRATEGY | May 15 '24 | Sale | 125.33 | 2,267 | 284,129 | 13,054 | May 16 04:33 PM | | Patton Rodney David | VP BUSINESS STRATEGY | Mar 12 '24 | Sale | 119.51 | 1,551 | 185,352 | 15,321 | Mar 12 05:03 PM | | Brunk James | CFO - VP FINANCE | Feb 28 '24 | Sale | 117.43 | 4,007 | 470,542 | 18,902 | Feb 29 04:12 PM | | HELEN SUZANNE L | Possible Member of Group | Dec 14 '23 | Sale | 107.01 | 4,500 | 481,554 | 4,453 | Dec 15 05:33 PM | | HELEN SUZANNE L | Possible Member of Group | Dec 13 '23 | Sale | 94.09 | 5,500 | 517,473 | 8,953 | Dec 15 05:33 PM |
|
|
|
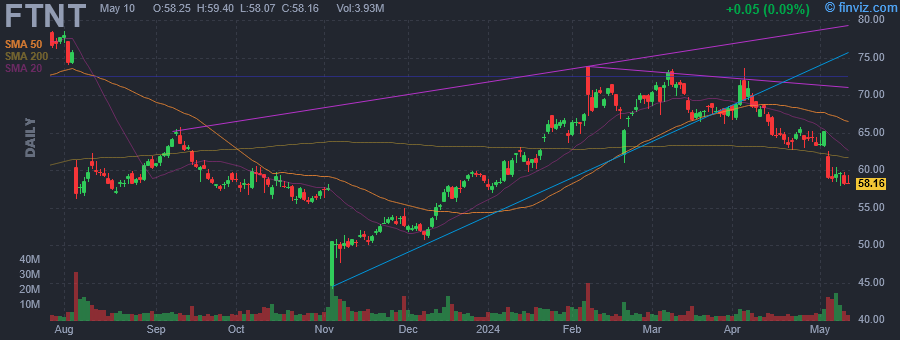 |
| Market Cap | 46.78B | EPS (ttm) | 1.53 |
| P/E | 39.93 | EPS this Y | 8.36% |
| Forward P/E | 31.18 | EPS next Y | 11.20% |
| PEG | 2.69 | EPS past 5Y | 30.73% |
| P/S | 8.67 | EPS next 5Y | 14.86% |
| P/B | - | EPS Q/Q | 24.41% |
| Dividend | - | Sales Q/Q | 7.21% |
| Insider Own | 17.56% | Inst Own | 68.49% |
| Insider Trans | -0.45% | Inst Trans | -4.27% |
| Short Float | 2.56% | Earnings | May 02/a |
| Analyst Recom | 2.38 | Target Price | 71.16 |
| Avg Volume | 5.46M | 52W Range | 44.12 - 81.24 |
|
|
|
|
Fortinet, Inc. provides cybersecurity solutions to a variety of businesses, such as enterprises, communication service providers, government organizations, and small to medium-sized businesses. Its product portfolio includes network security, secure access service edge, enterprise networking, security operations, application security, and operational technology. The company was founded by Ken Xie and Michael Xie in October 2000 and is headquartered in Sunnyvale, CA. |
| Insider Trading |
Relationship |
Date |
Transaction |
Cost |
#Shares |
Value ($) |
#Shares Total |
SEC Form 4 |
| Xie Ken | PRESIDENT & CEO | May 15 '24 | Option Exercise | 9.81 | 41,667 | 408,837 | 48,749,282 | May 16 04:31 PM | | Xie Ken | PRESIDENT & CEO | May 15 '24 | Sale | 60.90 | 24,230 | 1,475,716 | 48,725,052 | May 16 04:31 PM | | Xie Ken | PRESIDENT & CEO | May 14 '24 | Option Exercise | 9.81 | 41,667 | 408,837 | 48,731,877 | May 16 04:31 PM | | Xie Ken | PRESIDENT & CEO | May 14 '24 | Sale | 60.05 | 24,262 | 1,456,846 | 48,707,615 | May 16 04:31 PM | | Xie Michael | VP, ENGINEERING & CTO | May 02 '24 | Sale | 64.48 | 24,710 | 1,593,183 | 10,867,018 | May 02 05:36 PM |
|
|
|
