 |
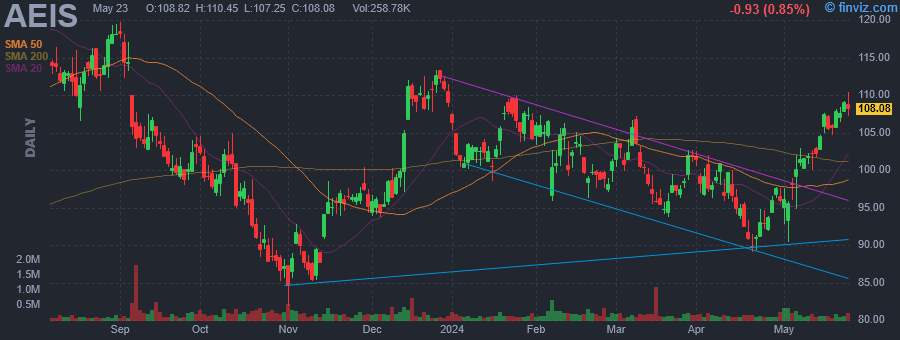
| Market Cap | 3.49B | EPS (ttm) | 3.40 |
| P/E | 27.51 | EPS this Y | -31.36% |
| Forward P/E | 17.26 | EPS next Y | 61.72% |
| PEG | 5.85 | EPS past 5Y | -1.88% |
| P/S | 2.11 | EPS next 5Y | 4.70% |
| P/B | 3.05 | EPS Q/Q | -14.05% |
| Dividend | 0.29% | Sales Q/Q | -17.42% |
| Insider Own | 0.94% | Inst Own | 106.85% |
| Insider Trans | -1.29% | Inst Trans | 0.26% |
| Short Float | 7.36% | Earnings | May 01/a |
| Analyst Recom | 2.40 | Target Price | 106.14 |
| Avg Volume | 229.12K | 52W Range | 81.86 - 126.38 |
|
|
|
|
Advanced Energy Industries, Inc. engages in the provision of power electronics conversion products. Its products include AC-DC power supply units, DC-DC conversion, high voltage amplifiers and power supplies, plasma power, controllers, sense and measurement. The company was founded by Douglas S. Schatz in 1981 and is headquartered in Denver, CO. |
| Insider Trading |
Relationship |
Date |
Transaction |
Cost |
#Shares |
Value ($) |
#Shares Total |
SEC Form 4 |
| DelSanto Anne | Director | May 01 '24 | Sale | 94.99 | 148 | 14,059 | 5,056 | May 02 11:36 AM | | DelSanto Anne | Director | Apr 01 '24 | Sale | 101.89 | 148 | 15,080 | 5,204 | Apr 02 12:27 PM | | DelSanto Anne | Director | Mar 01 '24 | Sale | 101.35 | 148 | 15,000 | 5,352 | Mar 01 05:24 PM | | Kelley Stephen Douglas | President and CEO | Feb 21 '24 | Option Exercise | 99.60 | 19,801 | 1,972,180 | 102,619 | Feb 23 06:29 PM | | Oldham Paul R | EVP, CFO | Feb 21 '24 | Option Exercise | 99.60 | 4,949 | 492,920 | 37,383 | Feb 23 06:30 PM |
|
|
 |
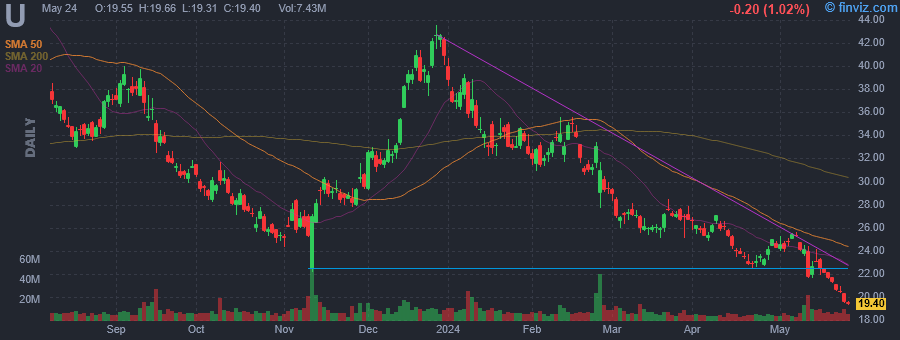 |
| Market Cap | 9.49B | EPS (ttm) | -2.16 |
| P/E | - | EPS this Y | -37.61% |
| Forward P/E | 23.02 | EPS next Y | 55.97% |
| PEG | - | EPS past 5Y | -34.36% |
| P/S | 4.34 | EPS next 5Y | - |
| P/B | 2.94 | EPS Q/Q | 20.27% |
| Dividend | - | Sales Q/Q | 35.10% |
| Insider Own | 33.34% | Inst Own | 48.48% |
| Insider Trans | -0.58% | Inst Trans | -0.34% |
| Short Float | 10.96% | Earnings | May 09/a |
| Analyst Recom | 2.53 | Target Price | 29.83 |
| Avg Volume | 8.88M | 52W Range | 22.20 - 50.08 |
|
|
|
|
Unity Software, Inc. engages in the developing video gaming software. It also provides software solutions to create, run and monetize interactive, real-time two-dimensional and three-dimensional content for mobile phones, tablets, consoles, and augmented and virtual reality devices. Its platform is used by developers, artists, and designers to build content for gaming, film, retail, automotive, architecture, engineering, and construction industries. The company was founded by Joachim Ante and David Helgason in 2004 and is headquartered in San Francisco, CA. |
| Insider Trading |
Relationship |
Date |
Transaction |
Cost |
#Shares |
Value ($) |
#Shares Total |
SEC Form 4 |
| Carpenter Carol W. | SVP & Chief Marketing Officer | May 01 '24 | Sale | 24.18 | 2,000 | 48,360 | 442,617 | May 02 11:31 AM | | Gupta Anirma | SVP, Chief Legal Officer | Apr 29 '24 | Sale | 24.42 | 1,037 | 25,324 | 386,706 | Apr 30 01:18 PM | | Carpenter Carol W. | SVP & Chief Marketing Officer | Apr 01 '24 | Sale | 26.58 | 2,000 | 53,160 | 444,617 | Apr 01 07:14 PM | | Gupta Anirma | SVP, Chief Legal Officer | Mar 25 '24 | Sale | 26.93 | 927 | 24,964 | 387,743 | Mar 26 01:25 PM | | The Felix | SVP Product & Technology, Grow | Mar 08 '24 | Sale | 27.28 | 5,000 | 136,400 | 293,948 | Mar 08 06:55 PM |
|
|
|
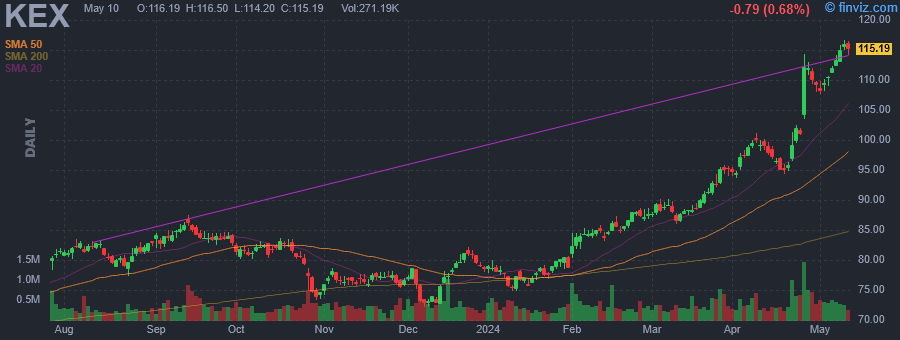 |
| Market Cap | 6.42B | EPS (ttm) | 4.24 |
| P/E | 25.88 | EPS this Y | 39.67% |
| Forward P/E | 17.06 | EPS next Y | 23.84% |
| PEG | 8.09 | EPS past 5Y | 23.26% |
| P/S | 2.04 | EPS next 5Y | 3.20% |
| P/B | 2.02 | EPS Q/Q | 76.24% |
| Dividend | - | Sales Q/Q | 7.67% |
| Insider Own | 0.99% | Inst Own | 96.88% |
| Insider Trans | -12.24% | Inst Trans | 0.41% |
| Short Float | 1.79% | Earnings | Apr 25/b |
| Analyst Recom | 1.00 | Target Price | 124.00 |
| Avg Volume | 444.19K | 52W Range | 69.22 - 114.35 |
|
|
|
|
Kirby Corp. is a tank barge operator, which engages in transporting bulk liquid products. It transports petrochemicals, black oil, refined petroleum products, and agricultural chemicals. It operates through Marine Transportation and Distribution and Services segments. The Marine Transportation segment provides marine transportation by United States flagged vessels principally of liquid cargoes throughout the United States inland waterway system. The Distribution and Services segment is involved in after-market service and genuine replacement parts for engines, transmissions, reduction gears and related equipment used in oilfield services, marine, power generation, on-highway, and other industrial applications. The company was founded in 1921 and is headquartered in Houston, TX. |
| Insider Trading |
Relationship |
Date |
Transaction |
Cost |
#Shares |
Value ($) |
#Shares Total |
SEC Form 4 |
| Woodruff William Matthew | VP of Public and Govt Affairs | May 01 '24 | Sale | 109.25 | 3,750 | 409,688 | 941 | May 02 11:16 AM | | STEWART RICHARD ROSS | Director | Apr 30 '24 | Sale | 109.60 | 676 | 74,090 | 23,488 | May 01 02:15 PM | | ALARIO RICHARD J | Director | Apr 25 '24 | Option Exercise | 99.52 | 6,000 | 597,120 | 31,313 | Apr 29 12:11 PM | | STEWART RICHARD ROSS | Director | Apr 25 '24 | Option Exercise | 99.52 | 6,000 | 597,120 | 27,660 | Apr 29 12:19 PM | | Waterman William M. | Director | Apr 24 '24 | Option Exercise | 99.52 | 6,000 | 597,120 | 91,398 | Apr 26 11:48 AM |
|
|
| |
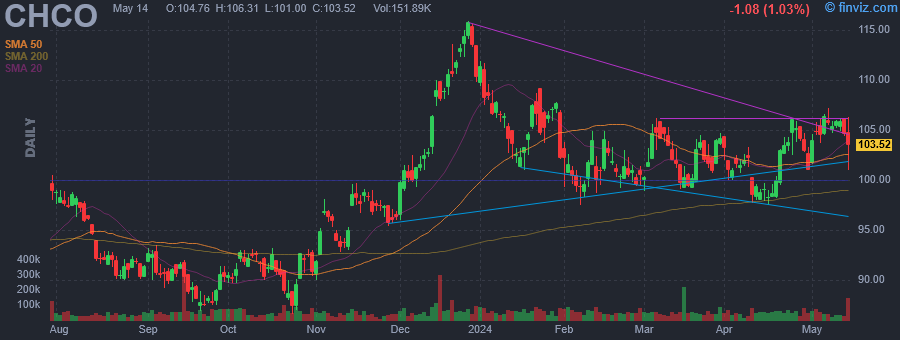 |
| Market Cap | 1.56B | EPS (ttm) | 7.95 |
| P/E | 13.22 | EPS this Y | 0.57% |
| Forward P/E | 14.18 | EPS next Y | -3.14% |
| PEG | 1.65 | EPS past 5Y | 11.12% |
| P/S | 4.41 | EPS next 5Y | 8.00% |
| P/B | 2.28 | EPS Q/Q | 21.20% |
| Dividend | 2.74% | Sales Q/Q | 14.53% |
| Insider Own | 2.34% | Inst Own | 72.67% |
| Insider Trans | -4.69% | Inst Trans | 1.49% |
| Short Float | 6.67% | Earnings | Apr 23/b |
| Analyst Recom | 3.00 | Target Price | 106.17 |
| Avg Volume | 60.27K | 52W Range | 82.53 - 115.89 |
|
|
| Today | Reiterated |
Hovde Group |
Market Perform |
$110 → $113 |
|
|
|
City Holding Co. is a financial holding company, which engages in the provision of financial and community banking services. Its products produced and services rendered by City National include Commercial Banking, Consumer Banking, Mortgage Banking, and Wealth Management and Trust Services. The company was founded on March 12, 1982 and is headquartered in Charleston, WV. |
| Insider Trading |
Relationship |
Date |
Transaction |
Cost |
#Shares |
Value ($) |
#Shares Total |
SEC Form 4 |
| BUMGARNER DAVID L | EVP & Chief Financial Officer | May 01 '24 | Sale | 103.20 | 1,499 | 154,694 | 9,951 | May 02 11:04 AM | | Quinlan Michael T Jr | EVP, Retail Banking | Apr 26 '24 | Sale | 104.74 | 1,773 | 185,699 | 3,400 | Apr 29 11:48 AM | | FISHER ROBERT D | Director | Apr 16 '24 | Buy | 97.73 | 219 | 21,403 | 43,497 | Apr 18 11:42 AM | | HYLTON TRACY W II | Director | Apr 16 '24 | Buy | 97.73 | 189 | 18,471 | 59,834 | Apr 18 11:42 AM | | FILE W H III | Director | Apr 16 '24 | Buy | 97.73 | 167 | 16,321 | 26,172 | Apr 18 11:41 AM |
|
|
|
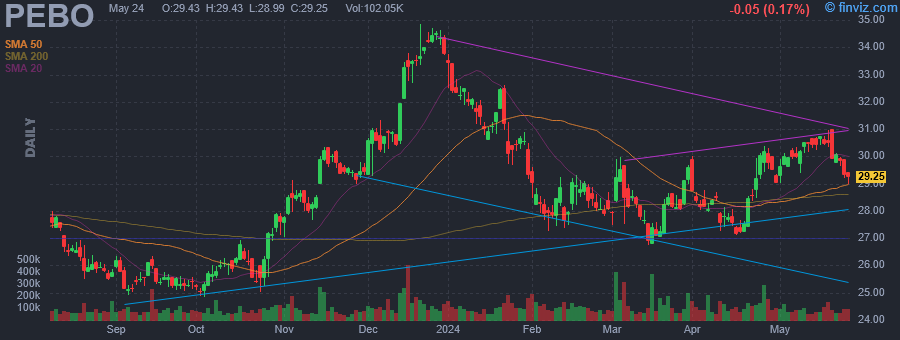 |
| Market Cap | 1.06B | EPS (ttm) | 3.34 |
| P/E | 8.95 | EPS this Y | -19.89% |
| Forward P/E | 8.63 | EPS next Y | 2.19% |
| PEG | 1.12 | EPS past 5Y | 7.39% |
| P/S | 1.84 | EPS next 5Y | 8.00% |
| P/B | 1.00 | EPS Q/Q | -10.92% |
| Dividend | 5.30% | Sales Q/Q | 48.63% |
| Insider Own | 5.97% | Inst Own | 54.35% |
| Insider Trans | -0.52% | Inst Trans | -0.62% |
| Short Float | 2.07% | Earnings | Apr 23/b |
| Analyst Recom | 2.43 | Target Price | 33.83 |
| Avg Volume | 131.00K | 52W Range | 23.05 - 34.85 |
|
|
|
|
Peoples Bancorp, Inc. operates as a financial holding company, which engages in banking, investment, insurance, and trust solutions. It offers various demand deposit accounts, savings accounts, money market accounts and certificates of deposit, commercial, consumer, real estate mortgage loans and lines of credit, debit and automated teller machine cards, credit cards for individuals and businesses, merchant credit card transaction processing services, corporate and personal trust services, safe deposit rental facilities, money orders and cashier's checks, life, health, property and casualty insurance products, brokerage services, and custom-tailored fiduciary, employee benefit plans and asset management & administration services. The company was founded in 1980 and is headquartered in Marietta, OH. |
| Insider Trading |
Relationship |
Date |
Transaction |
Cost |
#Shares |
Value ($) |
#Shares Total |
SEC Form 4 |
| Kirkham Michael Ryan | EVP/General Counsel | May 01 '24 | Sale | 29.48 | 700 | 20,636 | 10,710 | May 02 09:15 AM | | Wilcox Tyler J | Chief Executive Officer | Apr 30 '24 | Sale | 29.01 | 8,621 | 250,079 | 40,231 | May 02 09:14 AM | | Smith Dwight Eric | Director | Feb 13 '24 | Buy | 28.15 | 500 | 14,075 | 3,416 | Feb 15 03:18 PM | | SKINNER FRANCES A | Director | Feb 07 '24 | Buy | 27.70 | 400 | 11,080 | 5,134 | Feb 07 02:14 PM | | SKINNER FRANCES A | Director | Feb 06 '24 | Buy | 27.93 | 300 | 8,379 | 4,734 | Feb 06 05:11 PM |
|
|
| |
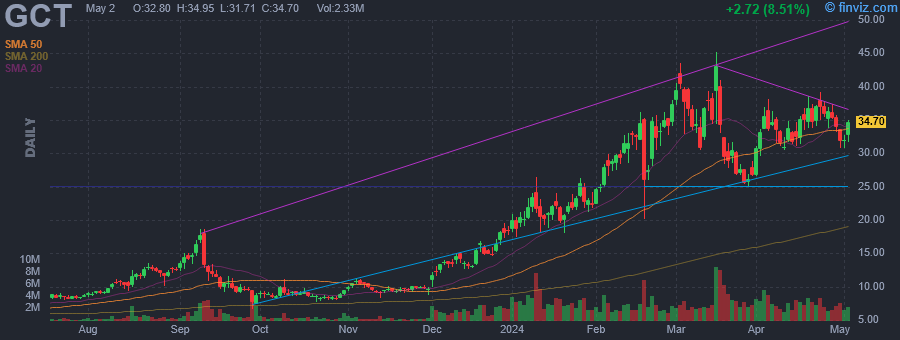 |
| Market Cap | 1.38B | EPS (ttm) | 2.30 |
| P/E | 14.78 | EPS this Y | 26.52% |
| Forward P/E | 9.32 | EPS next Y | 25.43% |
| PEG | - | EPS past 5Y | 208.72% |
| P/S | 1.97 | EPS next 5Y | - |
| P/B | 4.78 | EPS Q/Q | 151.39% |
| Dividend | - | Sales Q/Q | 94.85% |
| Insider Own | 58.04% | Inst Own | 16.15% |
| Insider Trans | -4.30% | Inst Trans | 375.82% |
| Short Float | 14.93% | Earnings | Mar 15/b |
| Analyst Recom | 1.00 | Target Price | 40.50 |
| Avg Volume | 2.98M | 52W Range | 4.97 - 45.18 |
|
|
|
|
GigaCloud Technology, Inc. specializes in global end-to-end business-to-business (B2B) electronic commerce (e-commerce) for large parcel merchandise. The firm's B2B ecommerce platform, which it refers to as the GigaCloud Marketplace, integrates everything from product discovery, payments, and messaging portals, leveraging channel diversification for suppliers, while resellers gain access to thousands of products backed by a complete logistics package. Its global marketplace seamlessly connects manufacturers, primarily in Asia, with resellers, primarily in the U.S., Asia, and Europe, to execute cross-border transactions with confidence, speed, and efficiency. The firm offers a comprehensive solution that transports products from the manufacturer's warehouse to the end customer's doorstep, all in one place. The company was founded by Lei Wu on August 29, 2006 and is headquartered in El Monte, CA. |
| Insider Trading |
Relationship |
Date |
Transaction |
Cost |
#Shares |
Value ($) |
#Shares Total |
SEC Form 4 |
| Wu Lei | Chief Executive Officer | Apr 30 '24 | Sale | 31.87 | 44,000 | 1,402,284 | 709,816 | May 01 09:40 PM | | Wu Lei | Chief Executive Officer | Apr 29 '24 | Sale | 34.06 | 44,000 | 1,498,421 | 753,816 | May 01 09:40 PM | | Wu Lei | Chief Executive Officer | Apr 26 '24 | Sale | 35.89 | 44,000 | 1,579,291 | 797,816 | Apr 29 09:49 PM | | Wu Lei | Chief Executive Officer | Apr 25 '24 | Sale | 36.12 | 44,000 | 1,589,200 | 841,816 | Apr 29 09:49 PM | | Wu Lei | Chief Executive Officer | Apr 24 '24 | Sale | 36.54 | 44,000 | 1,607,722 | 885,816 | Apr 26 09:23 PM |
|
|
|
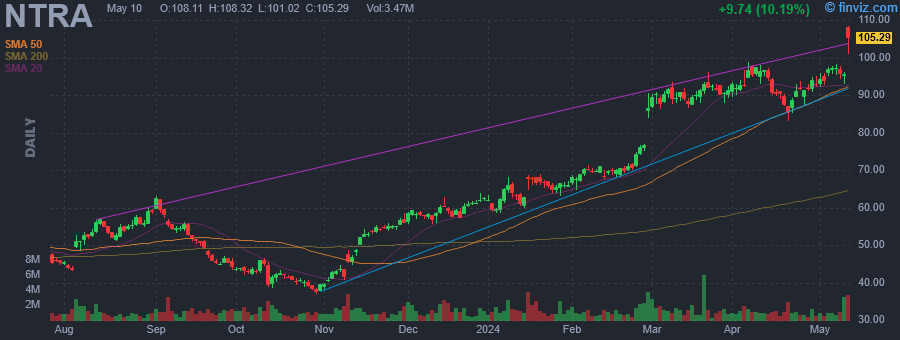 |
| Market Cap | 11.48B | EPS (ttm) | -3.80 |
| P/E | - | EPS this Y | 38.74% |
| Forward P/E | - | EPS next Y | 48.70% |
| PEG | - | EPS past 5Y | -11.28% |
| P/S | 10.61 | EPS next 5Y | - |
| P/B | 14.68 | EPS Q/Q | 52.15% |
| Dividend | - | Sales Q/Q | 43.20% |
| Insider Own | 6.33% | Inst Own | 90.87% |
| Insider Trans | -15.63% | Inst Trans | 1.75% |
| Short Float | 5.03% | Earnings | May 09/a |
| Analyst Recom | 1.50 | Target Price | 103.89 |
| Avg Volume | 1.38M | 52W Range | 36.90 - 98.82 |
|
|
|
|
Natera, Inc. is a diagnostics company, which engages in the discovery, development, and commercialization of genetic testing services. It provides Panorama non-invasive prenatal test (NIPT), Vistara, horizon carrier screening (HCS), spectrum pre-implantation genetic screening and spectrum pre-implantation genetic diagnosis, Anora products of conception (POC) and non-invasive paternity testing (PAT). The company was founded by Matthew Rabinowitz and Jonathan Sheena in November 2003 and is headquartered in Austin, TX. |
| Insider Trading |
Relationship |
Date |
Transaction |
Cost |
#Shares |
Value ($) |
#Shares Total |
SEC Form 4 |
| Chapman Steven Leonard | CEO AND PRESIDENT | Apr 29 '24 | Sale | 93.14 | 4,084 | 380,378 | 226,235 | May 01 09:05 PM | | Brophy Michael Burkes | CHIEF FINANCIAL OFFICER | Apr 29 '24 | Sale | 93.14 | 1,238 | 115,306 | 69,408 | May 01 09:05 PM | | Moshkevich Solomon | PRESIDENT, CLINICALDIAGNOSTICS | Apr 29 '24 | Sale | 93.14 | 1,196 | 111,394 | 115,833 | May 01 09:05 PM | | RABINOWITZ DANIEL | SEC. AND CHIEF LEGAL OFFICER | Apr 29 '24 | Sale | 93.14 | 1,057 | 98,448 | 204,495 | May 01 09:05 PM | | Fesko John | PRESIDENT, CHIEF BUS. OFFICER | Apr 29 '24 | Sale | 93.14 | 929 | 86,526 | 110,748 | May 01 09:05 PM |
|
|
| |
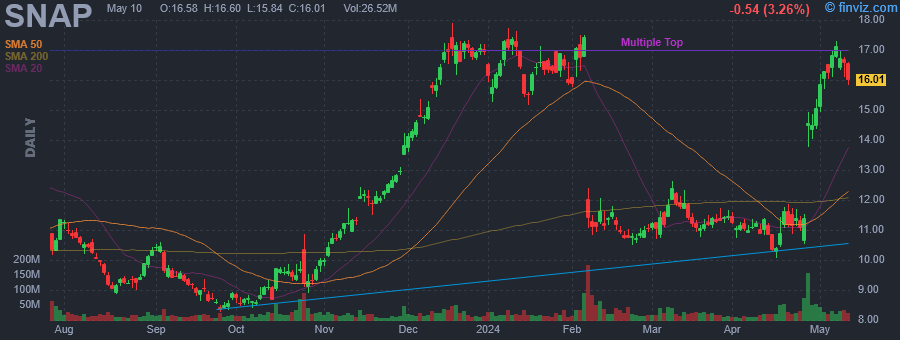 |
| Market Cap | 26.67B | EPS (ttm) | -0.80 |
| P/E | - | EPS this Y | 36.55% |
| Forward P/E | - | EPS next Y | 41.84% |
| PEG | - | EPS past 5Y | 3.22% |
| P/S | 5.54 | EPS next 5Y | - |
| P/B | 12.46 | EPS Q/Q | 10.88% |
| Dividend | - | Sales Q/Q | 20.85% |
| Insider Own | 36.88% | Inst Own | 48.16% |
| Insider Trans | -0.32% | Inst Trans | -11.90% |
| Short Float | 7.96% | Earnings | Apr 25/a |
| Analyst Recom | 2.67 | Target Price | 14.85 |
| Avg Volume | 36.28M | 52W Range | 7.86 - 17.90 |
|
|
|
|
Snap, Inc. is a technology company. It engages in the provision of a visual messaging application that was created to help people communicate through short videos and images. The company was founded by Frank Reginald Brown IV, Evan Thomas Spiegel, and Robert C. Murphy in 2010 and is headquartered in Santa Monica, CA. |
| Insider Trading |
Relationship |
Date |
Transaction |
Cost |
#Shares |
Value ($) |
#Shares Total |
SEC Form 4 |
| Murphy Robert C. | Chief Technology Officer | Apr 29 '24 | Sale | 14.27 | 1,000,000 | 14,274,500 | 59,894,865 | May 01 09:00 PM | | Spiegel Evan | Chief Executive Officer | Apr 29 '24 | Sale | 14.35 | 150,000 | 2,153,025 | 3,477,844 | May 01 09:00 PM | | Morrow Rebecca | CAO | Apr 16 '24 | Sale | 10.19 | 428 | 4,362 | 492,656 | Apr 18 07:00 PM | | O'Sullivan Michael J. | General Counsel | Mar 28 '24 | Sale | 11.53 | 18,000 | 207,594 | 474,812 | Apr 01 07:00 PM | | Andersen Derek | Chief Financial Officer | Mar 18 '24 | Sale | 10.99 | 96,953 | 1,065,979 | 2,534,689 | Mar 20 07:00 PM |
|
|
|
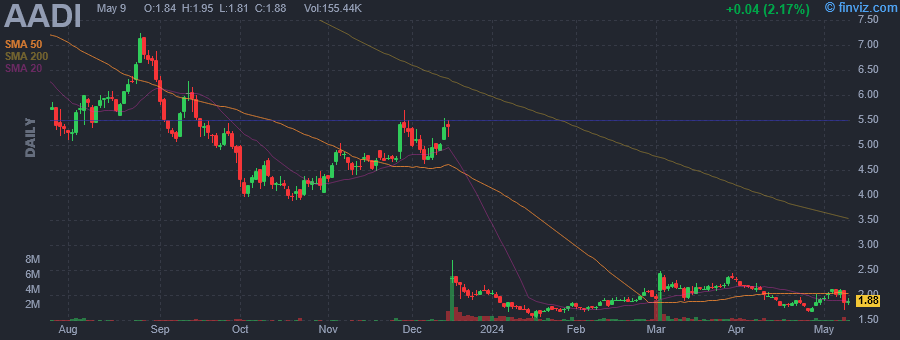 |
| Market Cap | 49.47M | EPS (ttm) | -2.44 |
| P/E | - | EPS this Y | -1.07% |
| Forward P/E | - | EPS next Y | -18.00% |
| PEG | - | EPS past 5Y | 11.87% |
| P/S | 2.03 | EPS next 5Y | - |
| P/B | 0.47 | EPS Q/Q | -16.38% |
| Dividend | - | Sales Q/Q | 21.03% |
| Insider Own | 28.99% | Inst Own | 41.20% |
| Insider Trans | -3.92% | Inst Trans | 13.61% |
| Short Float | 6.31% | Earnings | May 08/b |
| Analyst Recom | 1.40 | Target Price | 11.67 |
| Avg Volume | 346.35K | 52W Range | 1.55 - 8.60 |
|
|
|
|
Aadi Bioscience, Inc. operates as a clinical-stage biopharmaceutical company. It develops precision therapies for genetically-defined cancer patients with mTOR pathway driver alterations such as alterations in TSC1 or TSC2 genes. The company was founded by Neil Desai in November 2007 and is headquartered in Los Angeles, CA. |
| Insider Trading |
Relationship |
Date |
Transaction |
Cost |
#Shares |
Value ($) |
#Shares Total |
SEC Form 4 |
| Desai Neil | EXECUTIVE CHAIRMAN | May 01 '24 | Sale | 1.93 | 40,000 | 77,184 | 1,331,543 | May 01 08:50 PM | | Desai Neil | EXECUTIVE CHAIRMAN | Apr 02 '24 | Sale | 2.23 | 22,228 | 49,513 | 1,371,543 | Apr 03 04:49 PM | | Desai Neil | EXECUTIVE CHAIRMAN | Apr 01 '24 | Sale | 2.31 | 17,772 | 41,101 | 1,393,771 | Apr 03 04:49 PM | | Desai Neil | EXECUTIVE CHAIRMAN | Mar 04 '24 | Sale | 2.10 | 14,964 | 31,415 | 1,411,543 | Mar 04 07:22 PM | | Desai Neil | EXECUTIVE CHAIRMAN | Mar 01 '24 | Sale | 1.97 | 27,036 | 53,226 | 1,426,507 | Mar 04 07:22 PM |
|
|
|
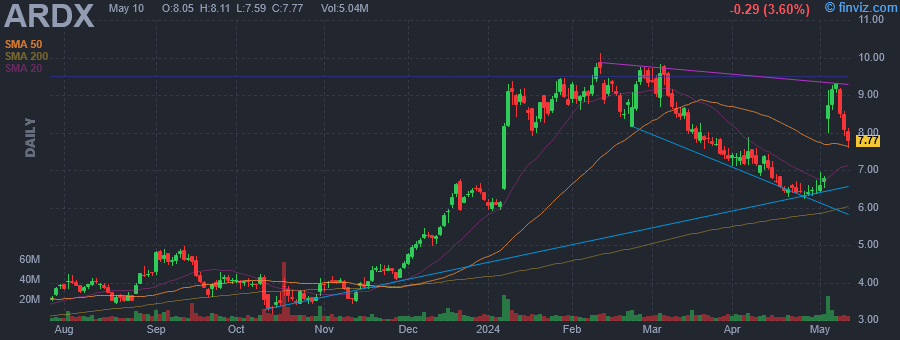 |
| Market Cap | 1.55B | EPS (ttm) | -0.30 |
| P/E | - | EPS this Y | -53.23% |
| Forward P/E | 160.42 | EPS next Y | 109.06% |
| PEG | - | EPS past 5Y | 28.61% |
| P/S | 12.49 | EPS next 5Y | 30.00% |
| P/B | 9.31 | EPS Q/Q | -324.64% |
| Dividend | - | Sales Q/Q | -22.22% |
| Insider Own | 3.86% | Inst Own | 59.57% |
| Insider Trans | -6.38% | Inst Trans | 50.07% |
| Short Float | 15.17% | Earnings | May 02/a |
| Analyst Recom | 1.00 | Target Price | 13.39 |
| Avg Volume | 5.54M | 52W Range | 3.16 - 10.13 |
|
|
|
|
Ardelyx, Inc. is a biopharmaceutical company, which engages in the business of developing and commercializing biopharmaceutical products. The firm is also involved in developing a unique and innovative platform that enables the discovery of new biological mechanisms and pathways to develop potent and efficacious therapies that minimize the side effects and drug-drug interactions frequently encountered with traditional, systemically absorbed medicines. The company was founded by Dominique Charmot, Peter G. Schultz, and Jean M. Frechet in October 2007 and is headquartered in Waltham, MA. |
| Insider Trading |
Relationship |
Date |
Transaction |
Cost |
#Shares |
Value ($) |
#Shares Total |
SEC Form 4 |
| RAAB MICHAEL | President & CEO | Apr 29 '24 | Option Exercise | 0.99 | 30,000 | 29,700 | 1,340,933 | May 01 07:59 PM | | RAAB MICHAEL | President & CEO | Apr 29 '24 | Sale | 6.40 | 30,000 | 192,057 | 1,310,933 | May 01 07:59 PM | | RAAB MICHAEL | President & CEO | Apr 15 '24 | Sale | 7.06 | 7,500 | 52,924 | 1,310,933 | Apr 17 04:20 PM | | RAAB MICHAEL | President & CEO | Apr 01 '24 | Sale | 7.31 | 1,518 | 11,097 | 1,318,433 | Apr 02 04:05 PM | | GRAMMER ELIZABETH A | See Remarks | Mar 20 '24 | Sale | 7.73 | 86,000 | 664,978 | 312,993 | Mar 22 04:42 PM |
|
|
|
