 |
| Market Cap | 6.36B | EPS (ttm) | 7.00 |
| P/E | 8.59 | EPS this Y | 13.30% |
| Forward P/E | 6.95 | EPS next Y | 9.39% |
| PEG | - | EPS past 5Y | 30.73% |
| P/S | 0.85 | EPS next 5Y | -6.80% |
| P/B | 1.18 | EPS Q/Q | 0.96% |
| Dividend | - | Sales Q/Q | 2.28% |
| Insider Own | 2.76% | Inst Own | 98.59% |
| Insider Trans | -28.33% | Inst Trans | -3.20% |
| Short Float | 2.42% | Earnings | Apr 30/b |
| Analyst Recom | 2.56 | Target Price | 65.98 |
| Avg Volume | 762.48K | 52W Range | 37.23 - 62.64 |
|
|
|
|
Taylor Morrison Home Corp. engages in the business of residential homebuilding and the development of lifestyle communities. It operates through the following segments: East, Central, West, and Financial Services. The East segment includes operations in Atlanta, Charlotte, Chicago, Orlando, Raleigh, Southwest Florida, and Tampa regions. The Central segment consists of Austin, Dallas, Denver, and Houston. The West segment covers Bay Area, Phoenix, Sacramento, and Southern California. The Financial Services segment provides a number of finance-related services through mortgage lending operations. The company was founded on November 15, 2012 and is headquartered in Scottsdale, AZ. |
| Insider Trading |
Relationship |
Date |
Transaction |
Cost |
#Shares |
Value ($) |
#Shares Total |
SEC Form 4 |
| Palmer Sheryl | Chairman, President and CEO | May 15 '24 | Sale | 61.70 | 100,000 | 6,170,000 | 19,211 | May 16 05:14 PM | | LYON WILLIAM H | Director | Mar 28 '24 | Sale | 62.32 | 153,000 | 9,535,590 | 40,570 | Mar 29 07:35 PM | | LYON WILLIAM H | Director | Mar 22 '24 | Sale | 60.33 | 164,000 | 9,894,120 | 43,570 | Mar 25 04:18 PM | | Palmer Sheryl | Chairman, President and CEO | Mar 15 '24 | Sale | 56.61 | 100,000 | 5,661,000 | 119,211 | Mar 19 04:03 PM | | LYON WILLIAM H | Director | Mar 07 '24 | Sale | 58.16 | 46,668 | 2,714,211 | 2,577,316 | Mar 07 08:37 PM |
|
|
 |
 |
| Market Cap | 1.60B | EPS (ttm) | 1.23 |
| P/E | 86.48 | EPS this Y | 12.98% |
| Forward P/E | 33.50 | EPS next Y | 9.66% |
| PEG | 9.50 | EPS past 5Y | -0.50% |
| P/S | 2.62 | EPS next 5Y | 9.10% |
| P/B | 3.34 | EPS Q/Q | -19.32% |
| Dividend | 1.66% | Sales Q/Q | 4.83% |
| Insider Own | 1.66% | Inst Own | 104.68% |
| Insider Trans | -7.14% | Inst Trans | -3.15% |
| Short Float | 4.77% | Earnings | May 07/a |
| Analyst Recom | 1.33 | Target Price | 120.50 |
| Avg Volume | 73.21K | 52W Range | 78.08 - 124.11 |
|
|
|
|
U.S. Physical Therapy, Inc. operates outpatient physical therapy clinics, which provide pre-and post-operative care and treatment for orthopedic-related disorders, sports-related injuries, preventative care, rehabilitation of injured workers and neurological-related injuries. It operates through the Physical Therapy Operations and Industrial Injury Prevention Services segments. The Physical Therapy Operations segment consists of physical therapy and occupational therapy clinics that provide pre-and postoperative care and treatment for orthopedic related disorders, sports-related injuries, preventive care, rehabilitation of injured workers and neurological injuries. The Industrial Injury Prevention Services segment includes onsite injury prevention and rehabilitation, performance optimization and ergonomic assessments. The company was founded in 1990 and is headquartered in Houston, TX. |
| Insider Trading |
Relationship |
Date |
Transaction |
Cost |
#Shares |
Value ($) |
#Shares Total |
SEC Form 4 |
| KUNTZ EDWARD L | Director | May 15 '24 | Sale | 107.57 | 2,500 | 268,925 | 3,280 | May 16 05:14 PM | | Williams Eric Joseph | Co-Chief Operations Officer | May 10 '24 | Sale | 104.22 | 2,500 | 260,550 | 16,814 | May 14 06:19 PM | | REEVE GRAHAM D. | COO | May 10 '24 | Sale | 105.46 | 1,724 | 181,813 | 6,970 | May 14 06:15 PM | | Binstein Richard | EVP Gen'l Counsel & Secretary | Mar 13 '24 | Sale | 106.55 | 2,000 | 213,100 | 15,006 | Mar 14 05:11 PM | | HENDRICKSON CAREY P | Chief Financial Officer | Mar 13 '24 | Sale | 107.28 | 1,800 | 193,103 | 21,186 | Mar 14 05:23 PM |
|
|
|
 |
| Market Cap | 4.75B | EPS (ttm) | 2.88 |
| P/E | 32.34 | EPS this Y | 245.24% |
| Forward P/E | 7.44 | EPS next Y | 32.62% |
| PEG | 1.56 | EPS past 5Y | 1.14% |
| P/S | 1.53 | EPS next 5Y | 20.73% |
| P/B | 1.33 | EPS Q/Q | 30.01% |
| Dividend | 0.86% | Sales Q/Q | 65.81% |
| Insider Own | 5.66% | Inst Own | 88.23% |
| Insider Trans | -12.66% | Inst Trans | -11.80% |
| Short Float | 2.28% | Earnings | Apr 24/a |
| Analyst Recom | 1.50 | Target Price | 106.56 |
| Avg Volume | 245.27K | 52W Range | 58.65 - 94.78 |
|
|
|
May-16-24 05:19PM
|
Pennymac Financial Services Insider Sold Shares Worth $1,048,800, According to a Recent SEC Filing
(MT Newswires) |
|
May-07-24 03:06AM
|
PennyMac Financial Services Insider Sold Shares Worth $1,493,927, According to a Recent SEC Filing
(MT Newswires) |
|
Apr-26-24 11:58AM
|
UBS Lowers PennyMac Financial Services' Price Target to $100 From $105, Maintains Neutral Rating
(MT Newswires) |
|
09:59AM
|
Keefe Bruyette & Woods Adjusts PennyMac Financial Services Price Target to $100 From $105, Maintains Outperform Rating
(MT Newswires) |
|
08:39AM
|
PennyMac Financial Services, Inc. (NYSE:PFSI) Q1 2024 Earnings Call Transcript
(Insider Monkey) |
|
Apr-25-24 11:52AM
|
11 Tips to Get Approved for a Mortgage
(Insider Monkey) -6.38% |
|
09:53AM
|
Deutsche Bank Adjusts PennyMac Financial Services Price Target to $112 From $115, Maintains Buy Rating
(MT Newswires) |
|
07:10AM
|
Q1 2024 PennyMac Financial Services Inc Earnings Call
(Thomson Reuters StreetEvents) |
|
04:29AM
|
PennyMac Financial Services Q1 Earnings, Revenue Rise; Keeps Quarterly Dividend of $0.20 a Share
(MT Newswires) |
|
03:25AM
|
PennyMac Financial Services Inc (PFSI) Q1 2024 Earnings Call Transcript Highlights: Key ...
(GuruFocus.com) |
|
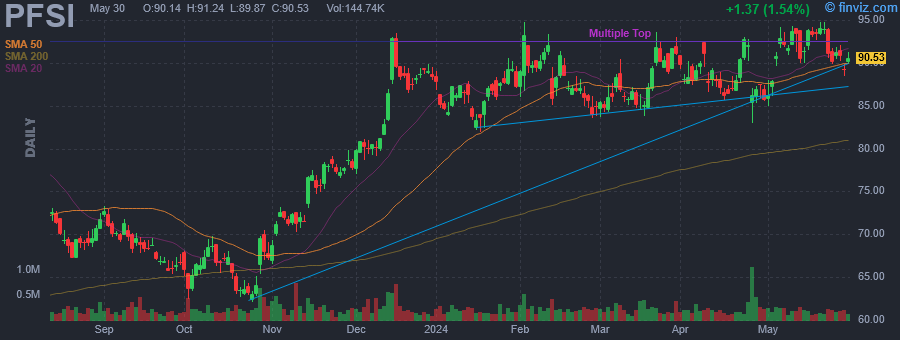
PennyMac Financial Services, Inc. operates as a holding company, which engages in the production and servicing of U.S. residential mortgage loans. It operates through the following segments: Loan Production, Loan Servicing, and Investment Management. The Loan Production segment is sourced through three channels: correspondent production, consumer direct lending and broker direct lending. The Loan Servicing segment performs loan administration, collection, and default management activities. The Investment Management segment currently manages PennyMac Mortgage Investment Trust. The company was founded by Stanford L. Kurland on July 2, 2008 and is headquartered in Westlake Village, CA. |
| Insider Trading |
Relationship |
Date |
Transaction |
Cost |
#Shares |
Value ($) |
#Shares Total |
SEC Form 4 |
| Perotti Daniel Stanley | Chief Financial Officer | May 15 '24 | Sale | 92.00 | 11,400 | 1,048,800 | 246,497 | May 16 05:12 PM | | SPECTOR DAVID | Chairman & CEO | May 15 '24 | Sale | 93.16 | 10,000 | 931,581 | 240,604 | May 16 05:10 PM | | MAZZELLA JOSEPH F | Director | May 03 '24 | Sale | 90.73 | 16,465 | 1,493,927 | 116,546 | May 06 06:38 PM | | SPECTOR DAVID | Chairman & CEO | Apr 09 '24 | Sale | 90.72 | 10,000 | 907,209 | 250,604 | Apr 11 05:47 PM | | STARK DEREK | Chief Legal Officer | Mar 25 '24 | Sale | 89.44 | 5,255 | 470,007 | 27,084 | Mar 26 05:17 PM |
|
|
| |
 |
| Market Cap | 135.66M | EPS (ttm) | -0.77 |
| P/E | - | EPS this Y | 20.67% |
| Forward P/E | - | EPS next Y | 10.92% |
| PEG | - | EPS past 5Y | - |
| P/S | 13.20 | EPS next 5Y | - |
| P/B | 1.34 | EPS Q/Q | -12.85% |
| Dividend | - | Sales Q/Q | - |
| Insider Own | 47.43% | Inst Own | 17.10% |
| Insider Trans | -6.96% | Inst Trans | -2.33% |
| Short Float | 7.80% | Earnings | May 13/a |
| Analyst Recom | 1.00 | Target Price | 1.60 |
| Avg Volume | 496.13K | 52W Range | 0.45 - 2.17 |
|
|
|
|
Hyzon Motors, Inc. operates as a hydrogen mobility company. It engages in designing, developing, and manufacturing both standalone and integrated hydrogen fuel cells and systems as well as purpose-designed hydrogen-powered commercial vehicles. The company was founded in 2020 and is headquartered in Bolingbrook, IL. |
| Insider Trading |
Relationship |
Date |
Transaction |
Cost |
#Shares |
Value ($) |
#Shares Total |
SEC Form 4 |
| HORIZON FUEL CELL TECHNOLOGIES | 10% Owner | May 15 '24 | Sale | 0.56 | 23,710 | 13,278 | 90,353,010 | May 16 05:10 PM | | HORIZON FUEL CELL TECHNOLOGIES | 10% Owner | May 14 '24 | Sale | 0.57 | 201,500 | 114,855 | 90,376,720 | May 16 05:10 PM | | HORIZON FUEL CELL TECHNOLOGIES | 10% Owner | May 10 '24 | Sale | 0.56 | 60,145 | 33,681 | 90,578,220 | May 13 10:26 AM | | HORIZON FUEL CELL TECHNOLOGIES | 10% Owner | May 09 '24 | Sale | 0.57 | 10,089 | 5,751 | 90,638,365 | May 13 10:26 AM | | HORIZON FUEL CELL TECHNOLOGIES | 10% Owner | Apr 10 '24 | Sale | 0.00 | 1,999,532 | 2,000 | 90,648,454 | Apr 29 10:45 AM |
|
|
|
 |
| Market Cap | 4.30B | EPS (ttm) | -0.55 |
| P/E | - | EPS this Y | 4.87% |
| Forward P/E | - | EPS next Y | 17.30% |
| PEG | - | EPS past 5Y | - |
| P/S | - | EPS next 5Y | - |
| P/B | 2.28 | EPS Q/Q | 35.88% |
| Dividend | - | Sales Q/Q | - |
| Insider Own | 49.04% | Inst Own | 42.06% |
| Insider Trans | -0.82% | Inst Trans | -4.96% |
| Short Float | 8.91% | Earnings | May 08/a |
| Analyst Recom | 2.67 | Target Price | 3.77 |
| Avg Volume | 7.96M | 52W Range | 1.30 - 4.81 |
|
|
|
|
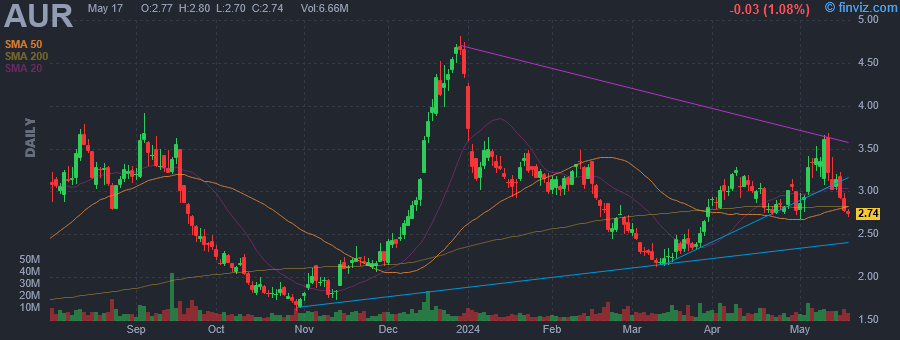
Aurora Innovation, Inc. engages in the design and development of automobile hardware, software, and provision of data services. It primarily offers Aurora Driver which allows a vehicle to drive itself. The company was founded by Chris Urmson, Sterling Anderson and Drew Bagnell in 2017 and is headquartered in Pittsburgh, PA. |
| Insider Trading |
Relationship |
Date |
Transaction |
Cost |
#Shares |
Value ($) |
#Shares Total |
SEC Form 4 |
| Hoffman Reid | Director | May 15 '24 | Sale | 3.16 | 45,600 | 144,146 | 389,694 | May 16 05:09 PM | | Hoffman Reid | Director | May 14 '24 | Sale | 3.09 | 1,013,781 | 3,132,076 | 391,974 | May 14 08:14 PM | | Hoffman Reid | Director | May 13 '24 | Sale | 3.19 | 338,000 | 1,079,403 | 442,663 | May 14 08:14 PM | | Hoffman Reid | Director | Mar 01 '24 | Sale | 2.59 | 80,000 | 207,440 | 459,563 | Mar 01 09:01 PM | | Hoffman Reid | Director | Feb 29 '24 | Sale | 2.52 | 1,000,000 | 2,521,500 | 463,563 | Mar 01 09:01 PM |
|
|
| |
 |
| Market Cap | 4.22B | EPS (ttm) | 2.92 |
| P/E | 29.78 | EPS this Y | 11.27% |
| Forward P/E | 20.66 | EPS next Y | 16.92% |
| PEG | 7.26 | EPS past 5Y | 16.04% |
| P/S | 1.79 | EPS next 5Y | 4.10% |
| P/B | 1.78 | EPS Q/Q | -29.69% |
| Dividend | 0.23% | Sales Q/Q | 8.99% |
| Insider Own | 1.66% | Inst Own | 90.20% |
| Insider Trans | -2.49% | Inst Trans | -1.05% |
| Short Float | 0.85% | Earnings | May 02/a |
| Analyst Recom | 1.40 | Target Price | 98.80 |
| Avg Volume | 230.70K | 52W Range | 61.98 - 89.44 |
|
|
|
|
Arcosa, Inc. engages in the provision of infrastructure-related products and services. It operates through the following segments: Construction Products, Energy Equipment, and Transportation Products. The Construction Products segment produces and sells construction aggregates, and manufactures and sells trench shields and shoring products and services for infrastructure-related projects. The Energy Equipment manufactures and sells products for energy-related businesses, including structural wind towers, steel utility structures for electricity transmission and distribution, and storage and distribution containers. The Transportation Products segment covers the manufacture and sale of products for the inland waterway and rail transportation industries, including barges, barge-related products, axles, and couplers. The company was founded in December 2017 and is headquartered in Dallas, TX. |
| Insider Trading |
Relationship |
Date |
Transaction |
Cost |
#Shares |
Value ($) |
#Shares Total |
SEC Form 4 |
| Cole Kerry S | Group President | May 15 '24 | Sale | 88.71 | 10,978 | 973,833 | 18,527 | May 16 05:07 PM | | Collins Jesse E. Jr. | Group President | May 15 '24 | Sale | 88.71 | 9,626 | 853,953 | 12,970 | May 16 05:06 PM | | Carrillo Antonio | President & CEO | Aug 17 '23 | Sale | 76.59 | 8,398 | 643,208 | 348,972 | Aug 17 05:41 PM | | Carrillo Antonio | President & CEO | Aug 16 '23 | Sale | 77.32 | 26,233 | 2,028,436 | 357,370 | Aug 16 06:16 PM | | Carrillo Antonio | President & CEO | Aug 15 '23 | Sale | 78.25 | 14,411 | 1,127,700 | 383,603 | Aug 16 06:16 PM |
|
|
|
 |
| Market Cap | 788.65M | EPS (ttm) | -5.88 |
| P/E | - | EPS this Y | 24.79% |
| Forward P/E | - | EPS next Y | 67.08% |
| PEG | - | EPS past 5Y | - |
| P/S | 9.09 | EPS next 5Y | 13.60% |
| P/B | 2.01 | EPS Q/Q | 9.76% |
| Dividend | - | Sales Q/Q | -18.37% |
| Insider Own | 8.61% | Inst Own | 87.86% |
| Insider Trans | -4.07% | Inst Trans | -3.02% |
| Short Float | 9.47% | Earnings | May 08/a |
| Analyst Recom | 1.42 | Target Price | 39.08 |
| Avg Volume | 649.60K | 52W Range | 11.83 - 28.80 |
|
|
|
|
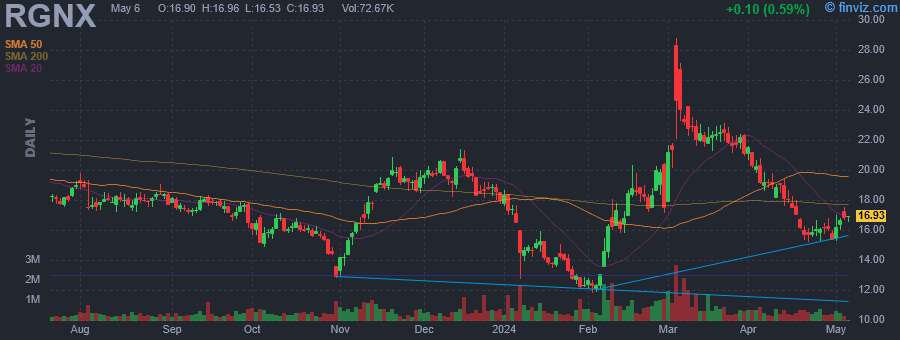
REGENXBIO, Inc. is a clinical-stage biotechnology company, which engages in the development, commercialization, and licensing of recombinant adeno-associated virus gene therapy. Its product candidates include the NAV Technology Platform, which consists of exclusive rights to novel adeno-associated viral vectors, and therapeutic programs such as RGX-314, RGX-202, RGX-121, RGX-111, RGX-181, and RGX-381. The company was founded by Kenneth T. Mills and James M. Wilson on July 16, 2008 and is headquartered in Rockville, MD. |
| Insider Trading |
Relationship |
Date |
Transaction |
Cost |
#Shares |
Value ($) |
#Shares Total |
SEC Form 4 |
| Mills Kenneth T. | President and CEO | May 14 '24 | Option Exercise | 3.76 | 15,000 | 56,400 | 423,035 | May 16 05:06 PM | | Mills Kenneth T. | President and CEO | May 14 '24 | Sale | 15.81 | 15,000 | 237,222 | 408,035 | May 16 05:06 PM | | Mills Kenneth T. | President and CEO | Apr 15 '24 | Option Exercise | 3.76 | 15,000 | 56,400 | 423,035 | Apr 17 05:05 PM | | Mills Kenneth T. | President and CEO | Apr 15 '24 | Sale | 18.19 | 15,000 | 272,871 | 408,035 | Apr 17 05:05 PM | | Vasista Vittal | Chief Financial Officer | Mar 19 '24 | Option Exercise | 3.76 | 20,041 | 75,354 | 246,534 | Mar 21 05:20 PM |
|
|
| |
 |
| Market Cap | 7.13B | EPS (ttm) | 7.18 |
| P/E | 18.47 | EPS this Y | 2.26% |
| Forward P/E | 12.04 | EPS next Y | 11.02% |
| PEG | 2.25 | EPS past 5Y | 5.38% |
| P/S | 1.80 | EPS next 5Y | 8.20% |
| P/B | 2.15 | EPS Q/Q | -12.67% |
| Dividend | - | Sales Q/Q | -7.99% |
| Insider Own | 1.21% | Inst Own | 100.68% |
| Insider Trans | -0.27% | Inst Trans | 0.75% |
| Short Float | 4.52% | Earnings | May 08/b |
| Analyst Recom | 1.75 | Target Price | 165.29 |
| Avg Volume | 409.05K | 52W Range | 109.59 - 161.01 |
|
|
|
|
The Middleby Corp. engages in the design, manufacture, marketing, and distribution of foodservice equipment. It operates through the following segments: Commercial Foodservice Equipment Group, Food Processing Equipment Group, Residential Kitchen Equipment Group, and Corporate and Other. The Commercial Foodservice Equipment Group segment manufactures, sells, and distributes foodservice equipment for the restaurant and institutional kitchen industry. The Food Processing Equipment Group segment manufactures preparation, cooking, packaging, food handling, and food safety equipment for the food processing industry. The Residential Kitchen Equipment Group segment manufactures, sells, and distributes kitchen equipment such as cookers, stoves, ovens, refrigerators, dishwashers, microwaves, cooktops, wine coolers, ice machines, ventilation, and outdoor equipment for the residential market. The Corporate and Other segment refers to the corporate and other general company assets and operations. The company was founded in 1888 and is headquartered in Elgin, IL. |
| Insider Trading |
Relationship |
Date |
Transaction |
Cost |
#Shares |
Value ($) |
#Shares Total |
SEC Form 4 |
| Palisi Chapin Sarah | Director | May 15 '24 | Sale | 137.18 | 235 | 32,237 | 7,211 | May 16 05:05 PM | | McCarthy Cathy L | Director | Mar 05 '24 | Sale | 153.12 | 1,000 | 153,125 | 7,971 | Mar 06 06:39 PM | | Palisi Chapin Sarah | Director | Feb 22 '24 | Sale | 151.47 | 350 | 53,015 | 6,306 | Feb 26 05:49 PM | | Palisi Chapin Sarah | Director | Dec 11 '23 | Sale | 135.55 | 150 | 20,332 | 6,656 | Dec 13 04:22 PM | | Pool III James K | Chief Technology and* | Sep 01 '23 | Sale | 146.82 | 500 | 73,410 | 35,908 | Sep 01 04:55 PM |
|
|
|
 |
| Market Cap | 3.65B | EPS (ttm) | 4.23 |
| P/E | 15.53 | EPS this Y | -14.15% |
| Forward P/E | 10.26 | EPS next Y | 19.32% |
| PEG | - | EPS past 5Y | - |
| P/S | 0.46 | EPS next 5Y | -15.00% |
| P/B | 1.68 | EPS Q/Q | -30.45% |
| Dividend | - | Sales Q/Q | -20.93% |
| Insider Own | 3.63% | Inst Own | 95.18% |
| Insider Trans | -4.39% | Inst Trans | -3.01% |
| Short Float | 2.35% | Earnings | Apr 29/a |
| Analyst Recom | 2.67 | Target Price | 62.28 |
| Avg Volume | 381.54K | 52W Range | 43.40 - 69.69 |
|
|
|
|
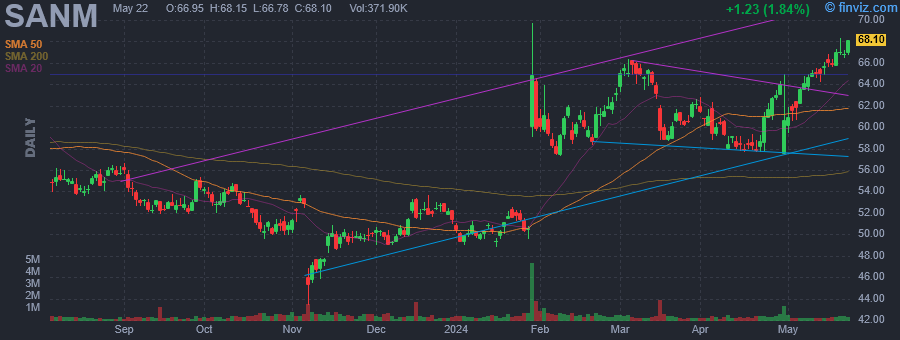
Sanmina Corp. engages in the provision of integrated manufacturing solutions, components, products and repair, logistics and after-market services. It operates through the following segments: Integrated Manufacturing Solutions (IMS) and Components, Products and Services (CPS). The IMS segment consists of printed circuit board assembly and test, final system assembly and test and direct-order-fulfillment. The CPS segment includes interconnect systems and mechanical systems. The company was founded by Jure Sola in 1980 and is headquartered in San Jose, CA. |
| Insider Trading |
Relationship |
Date |
Transaction |
Cost |
#Shares |
Value ($) |
#Shares Total |
SEC Form 4 |
| REID ALAN McWILLIAMS | EVP, Global Human Resources | May 15 '24 | Sale | 66.37 | 2,472 | 164,067 | 35,179 | May 16 05:04 PM | | REID ALAN McWILLIAMS | EVP, Global Human Resources | May 14 '24 | Sale | 65.43 | 3,528 | 230,837 | 37,651 | May 16 05:04 PM | | DELANEY EUGENE A | Director | May 09 '24 | Option Exercise | 24.14 | 7,181 | 173,349 | 108,068 | May 10 05:05 PM | | DELANEY EUGENE A | Director | May 09 '24 | Sale | 64.91 | 7,181 | 466,090 | 100,887 | May 10 05:05 PM | | Hedley David V III | Director | Mar 18 '24 | Sale | 60.01 | 394 | 23,644 | 5,774 | Mar 19 05:59 PM |
|
|
|
 |
| Market Cap | 374.40M | EPS (ttm) | 0.35 |
| P/E | 19.88 | EPS this Y | -13.86% |
| Forward P/E | 9.75 | EPS next Y | 53.31% |
| PEG | - | EPS past 5Y | -26.33% |
| P/S | 0.84 | EPS next 5Y | - |
| P/B | 1.22 | EPS Q/Q | -175.12% |
| Dividend | - | Sales Q/Q | 4.42% |
| Insider Own | 56.29% | Inst Own | 33.99% |
| Insider Trans | -0.06% | Inst Trans | -0.27% |
| Short Float | 2.46% | Earnings | Mar 07/a |
| Analyst Recom | 1.40 | Target Price | 9.88 |
| Avg Volume | 78.78K | 52W Range | 6.12 - 9.15 |
|
|
|
|
Concrete Pumping Holdings, Inc. engages in the provision of waste management solutions and services. It operates through the following business segments: U.S. Concrete Pumping, U.S. Concrete Waste Management Services, and the U.K. Operations. The U.S. Concrete Pumping segment includes services under the Brundage-Bone and Capital Pumping trade names. The U.S. Concrete Waste Management Services involves the pans and containers rented to customers and the disposal services under the Eco-Pan trade name. The U.K. Operations segment relates to the concrete pumping services and leasing of concrete pumping equipment to customers under the Camfaud Concrete Pumps and Premier Concrete Pumping trade names. The company was founded in 1983 and is headquartered in Thornton, CO. |
| Insider Trading |
Relationship |
Date |
Transaction |
Cost |
#Shares |
Value ($) |
#Shares Total |
SEC Form 4 |
| Young Bruce F. | Chief Executive Officer | May 14 '24 | Option Exercise | 0.87 | 697,544 | 606,863 | 2,040,753 | May 16 05:05 PM | | Young Bruce F. | Chief Executive Officer | May 14 '24 | Option Exercise | 0.87 | 10,565 | 9,192 | 2,045,753 | May 16 05:04 PM | | Young Bruce F. | Chief Executive Officer | May 14 '24 | Sale | 7.00 | 5,000 | 35,000 | 2,040,753 | May 16 05:04 PM | | Young Bruce F. | Chief Executive Officer | Apr 17 '24 | Option Exercise | 0.87 | 7,518 | 6,541 | 2,049,275 | Apr 17 07:08 PM | | Young Bruce F. | Chief Executive Officer | Apr 17 '24 | Sale | 7.06 | 3,522 | 24,865 | 2,045,753 | Apr 17 07:08 PM |
|
|
|
