 |
| Market Cap | 272.69M | EPS (ttm) | -0.44 |
| P/E | - | EPS this Y | -67.18% |
| Forward P/E | - | EPS next Y | 60.23% |
| PEG | - | EPS past 5Y | - |
| P/S | 1.95 | EPS next 5Y | - |
| P/B | 1.77 | EPS Q/Q | 33.69% |
| Dividend | - | Sales Q/Q | -15.91% |
| Insider Own | 25.54% | Inst Own | 61.45% |
| Insider Trans | 1.20% | Inst Trans | 1.02% |
| Short Float | 1.32% | Earnings | May 10/b |
| Analyst Recom | 2.00 | Target Price | 5.40 |
| Avg Volume | 405.98K | 52W Range | 1.87 - 5.00 |
|
|
|
|
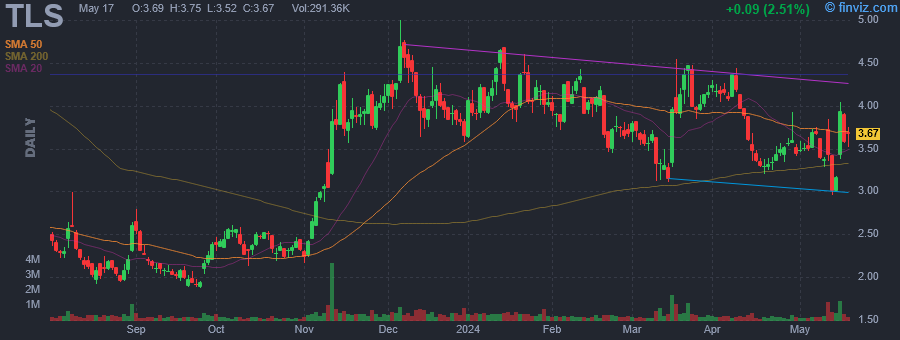
Telos Corp. engages in the design and provision of advanced technologies to deliver solutions that empower and protect the demanding enterprises. Its solutions include cyber security, cyber risk management and compliance, secure mobility, identity management, and information technology and enterprise solutions. The company was founded in October 1971 and is headquartered in Ashburn, VA. |
| Insider Trading |
Relationship |
Date |
Transaction |
Cost |
#Shares |
Value ($) |
#Shares Total |
SEC Form 4 |
| Schaufeld Fredrick | Director | May 17 '24 | Buy | 3.67 | 44,821 | 164,493 | 386,265 | May 17 04:25 PM | | Wood John B | Chairman and CEO | May 15 '24 | Buy | 3.93 | 25,000 | 98,250 | 4,868,281 | May 16 05:13 PM | | Schaufeld Fredrick | Director | May 15 '24 | Buy | 3.48 | 1,932 | 6,723 | 341,444 | May 16 05:09 PM | | Schaufeld Fredrick | Director | May 14 '24 | Buy | 3.14 | 84,063 | 263,958 | 339,512 | May 14 05:41 PM | | Wood John B | Chairman and CEO | May 14 '24 | Buy | 3.11 | 50,000 | 155,500 | 4,843,281 | May 14 05:43 PM |
|
|
 |
 |
| Market Cap | 8.86B | EPS (ttm) | 45.08 |
| P/E | 20.97 | EPS this Y | - |
| Forward P/E | - | EPS next Y | - |
| PEG | - | EPS past 5Y | - |
| P/S | 1.33 | EPS next 5Y | - |
| P/B | 5.53 | EPS Q/Q | 26.75% |
| Dividend | 0.21% | Sales Q/Q | 1.27% |
| Insider Own | 44.28% | Inst Own | 42.39% |
| Insider Trans | 0.00% | Inst Trans | -5.14% |
| Short Float | 2.38% | Earnings | May 06/a |
| Analyst Recom | 3.00 | Target Price | 144.00 |
| Avg Volume | 48.50K | 52W Range | 602.97 - 1030.00 |
|
|
|
|
Coca-Cola Consolidated, Inc. engages in the production, marketing, and distribution of nonalcoholic beverages. Its products include sparkling and still beverages as well as energy products and noncarbonated beverages such as bottled water, tea, ready to drink coffee, enhanced water, juices, and sports drinks. It operates through the Nonalcoholic Beverages, and All Other segments. The company was founded by J. B. Harrison in 1902 and is headquartered in Charlotte, NC. |
| Insider Trading |
Relationship |
Date |
Transaction |
Cost |
#Shares |
Value ($) |
#Shares Total |
SEC Form 4 |
| Everett Morgan Harrison | Vice Chair | Dec 18 '23 | Buy | 856.00 | 2 | 1,712 | 2 | May 17 04:22 PM |
|
|
|
 |
| Market Cap | 330.51M | EPS (ttm) | 4.68 |
| P/E | 10.23 | EPS this Y | -5.25% |
| Forward P/E | 9.74 | EPS next Y | 6.84% |
| PEG | - | EPS past 5Y | 8.99% |
| P/S | 2.27 | EPS next 5Y | - |
| P/B | 1.10 | EPS Q/Q | -13.12% |
| Dividend | 0.74% | Sales Q/Q | 18.32% |
| Insider Own | 37.60% | Inst Own | 21.98% |
| Insider Trans | -0.12% | Inst Trans | -1.50% |
| Short Float | 0.50% | Earnings | Apr 25/a |
| Analyst Recom | 1.00 | Target Price | 62.00 |
| Avg Volume | 7.86K | 52W Range | 44.42 - 58.00 |
|
|
|
|
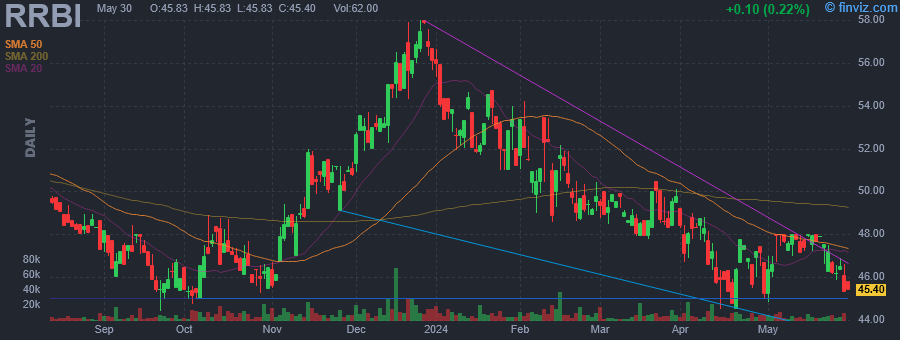
Red River Bancshares, Inc. is a bank holding company, which engages in the provision of banking products and services for commercial and retail customers through its subsidiary. It offers real estate and commercial loans, treasury management, retail banking networks, private banking, residential mortgage lending, and investment services. The company was founded on March 16, 1998 and is headquartered in Alexandria, LA. |
| Insider Trading |
Relationship |
Date |
Transaction |
Cost |
#Shares |
Value ($) |
#Shares Total |
SEC Form 4 |
| BROWN MICHAEL J | Director | May 16 '24 | Buy | 47.68 | 197 | 9,393 | 3,000 | May 17 04:06 PM | | BROWN MICHAEL J | Director | May 15 '24 | Buy | 47.95 | 700 | 33,568 | 2,803 | May 17 04:06 PM | | BROWN MICHAEL J | Director | May 14 '24 | Buy | 47.77 | 202 | 9,650 | 2,103 | May 15 04:08 PM | | BROWN MICHAEL J | Director | May 13 '24 | Buy | 47.75 | 401 | 19,147 | 1,901 | May 15 04:08 PM | | Price Teddy Ray | Director | May 03 '24 | Buy | 47.08 | 738 | 34,742 | 367,478 | May 03 02:22 PM |
|
|
| |
 |
| Market Cap | 763.71M | EPS (ttm) | 1.09 |
| P/E | 30.84 | EPS this Y | -19.73% |
| Forward P/E | 12.23 | EPS next Y | 27.99% |
| PEG | 3.08 | EPS past 5Y | - |
| P/S | 0.59 | EPS next 5Y | 10.00% |
| P/B | 1.17 | EPS Q/Q | -72.01% |
| Dividend | 1.55% | Sales Q/Q | -11.12% |
| Insider Own | 2.18% | Inst Own | 92.63% |
| Insider Trans | 0.61% | Inst Trans | -1.64% |
| Short Float | 2.02% | Earnings | May 01/b |
| Analyst Recom | 2.33 | Target Price | 40.67 |
| Avg Volume | 164.12K | 52W Range | 28.97 - 56.33 |
|
|
|
|
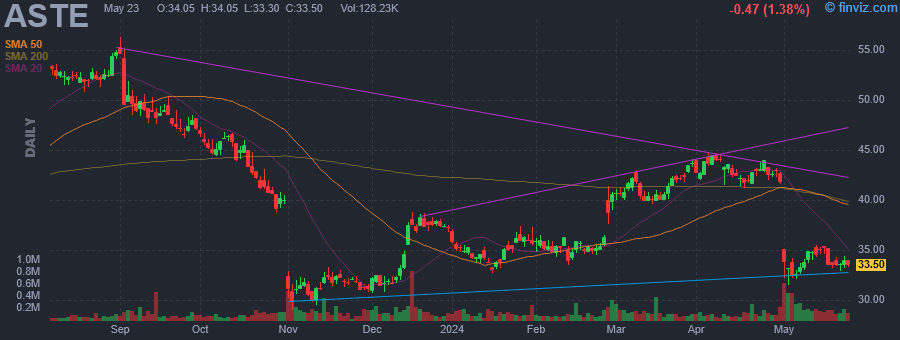
Astec Industries, Inc. engages in the design, engineer, manufacture, and market of equipment and components used in road building and construction activities. It operates through the following segments: Infrastructure Solutions, Material Solutions, and Corporate and Other. The Infrastructure Solutions segment designs, engineers, manufactures, and markets a complete line of asphalt plants, concrete plants, and ancillary equipment, as well as supplying asphalt road construction equipment, industrial thermal systems, and heavy equipment. The Material Solutions segment designs and manufactures heavy processing equipment, in addition to servicing and supplying parts for the aggregate, metallic mining, recycling, ports, and bulk handling industries. The Corporate and Other segment is involved in the controls and automation business, through the firm's parent company, Astec Insurance. The company was founded by J. Don Brock in 1972 and is headquartered in Chattanooga, TN. |
| Insider Trading |
Relationship |
Date |
Transaction |
Cost |
#Shares |
Value ($) |
#Shares Total |
SEC Form 4 |
| Merwe Jaco van der | Chief Executive Officer | May 16 '24 | Buy | 33.70 | 2,000 | 67,400 | 73,878 | May 17 04:05 PM | | NORRIS MICHAEL PAUL | GROUP PRESIDENT | May 08 '24 | Buy | 33.46 | 1,000 | 33,460 | 15,886 | May 08 04:57 PM |
|
|
|
 |
| Market Cap | 416.57M | EPS (ttm) | 2.47 |
| P/E | 12.39 | EPS this Y | 28.83% |
| Forward P/E | 9.99 | EPS next Y | 21.47% |
| PEG | 1.24 | EPS past 5Y | - |
| P/S | 0.85 | EPS next 5Y | 10.00% |
| P/B | 0.64 | EPS Q/Q | 380.37% |
| Dividend | 4.57% | Sales Q/Q | -25.59% |
| Insider Own | 50.07% | Inst Own | 38.62% |
| Insider Trans | 0.15% | Inst Trans | -1.05% |
| Short Float | 0.11% | Earnings | May 08/b |
| Analyst Recom | 3.00 | Target Price | 55.00 |
| Avg Volume | 5.29K | 52W Range | 25.21 - 37.00 |
|
|
|
|
Global Indemnity Group LLC engages in providing diversified insurance and reinsurance services. It operates through the following segments: Commercial Specialty, Reinsurance Operations, and Exited Lines. The Commercial Specialty segment provides specialty and casualty products designed for product lines such as small business binding authority, property brokerage, vacant express and programs. The Specialty Property segment offers specialty personal lines property and casualty insurance products. The Reinsurance Operations segment provides reinsurance solutions through brokers and primary writers including insurance and reinsurance companies. The company was founded in 2003 and is headquartered in Bala Cynwyd, PA. |
| Insider Trading |
Relationship |
Date |
Transaction |
Cost |
#Shares |
Value ($) |
#Shares Total |
SEC Form 4 |
| BROWN JOSEPH W | Chief Executive | May 15 '24 | Buy | 32.00 | 2,000 | 64,000 | 157,404 | May 17 04:02 PM | | BROWN JOSEPH W | Chief Executive | May 13 '24 | Buy | 32.47 | 8,000 | 259,745 | 155,404 | May 15 04:02 PM |
|
|
| |
 |
| Market Cap | 144.40M | EPS (ttm) | 0.56 |
| P/E | 26.58 | EPS this Y | - |
| Forward P/E | - | EPS next Y | - |
| PEG | - | EPS past 5Y | - |
| P/S | 2.32 | EPS next 5Y | - |
| P/B | 2.99 | EPS Q/Q | 363.61% |
| Dividend | 0.57% | Sales Q/Q | 3.29% |
| Insider Own | 30.48% | Inst Own | 30.26% |
| Insider Trans | 1.04% | Inst Trans | 1.01% |
| Short Float | 7.18% | Earnings | Feb 14/b |
| Analyst Recom | - | Target Price | - |
| Avg Volume | 169.83K | 52W Range | 4.91 - 29.92 |
|
|
|
|
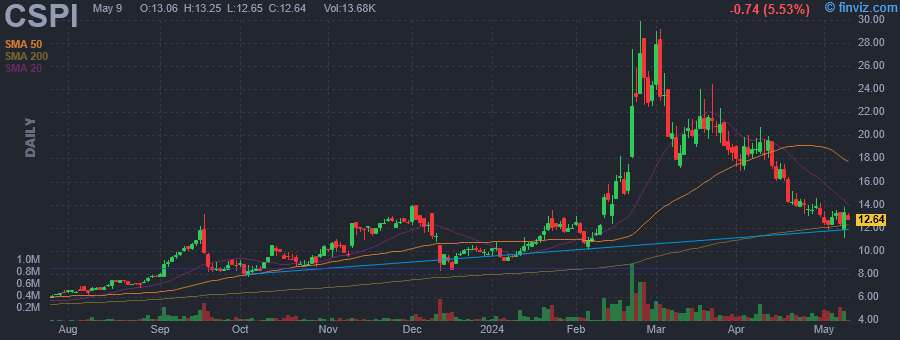
CSP, Inc. engages in the development and marketing of information technology integration solutions. It operates through the Technology Solutions (TS) and High-Performance Products (HPP) segments. The TS segment focuses on generating product revenues by reselling third-party computer hardware and software as a value-added reseller. The HPP segment involves the cybersecurity solution marketed as ARIA, Myricom network adapters and related software, and legacy Multicomputer product portfolio for digital signal processing. The company was founded in 1968 and is headquartered in Lowell, MA. |
| Insider Trading |
Relationship |
Date |
Transaction |
Cost |
#Shares |
Value ($) |
#Shares Total |
SEC Form 4 |
| NERGES JOSEPH R | 10% Owner | May 17 '24 | Buy | 14.32 | 1,905 | 27,284 | 1,342,721 | May 17 03:59 PM | | NERGES JOSEPH R | 10% Owner | May 15 '24 | Buy | 13.62 | 600 | 8,172 | 1,340,816 | May 17 03:59 PM | | NERGES JOSEPH R | Confidentiality agreement | May 14 '24 | Buy | 13.53 | 1,000 | 13,531 | 1,340,221 | May 14 03:57 PM | | NERGES JOSEPH R | Confidentiality agreement | May 13 '24 | Buy | 13.49 | 605 | 8,163 | 1,339,221 | May 14 03:57 PM | | NERGES JOSEPH R | Confidentiality agreement | May 10 '24 | Buy | 13.16 | 600 | 7,899 | 1,338,616 | May 14 03:57 PM |
|
|
|
 |
| Market Cap | 665.58M | EPS (ttm) | 2.44 |
| P/E | 5.09 | EPS this Y | 96.60% |
| Forward P/E | 7.89 | EPS next Y | -12.26% |
| PEG | - | EPS past 5Y | 26.00% |
| P/S | 2.56 | EPS next 5Y | - |
| P/B | 0.78 | EPS Q/Q | 121.20% |
| Dividend | 10.78% | Sales Q/Q | 13.20% |
| Insider Own | 0.30% | Inst Own | 29.00% |
| Insider Trans | 6.09% | Inst Trans | 52.78% |
| Short Float | 0.18% | Earnings | May 09/b |
| Analyst Recom | 3.00 | Target Price | 12.25 |
| Avg Volume | 305.15K | 52W Range | 9.09 - 12.69 |
|
|
|
|
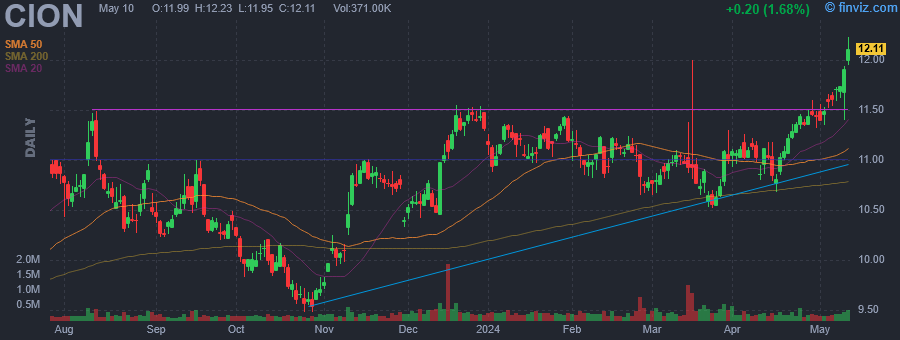
CION Investment Corporation is a business development company. It specializes in investments in senior secured loans, including unitranche loans, First Lien, second lien loans, long-term subordinated loans, and mezzanine loans; equity interests such as warrants or options; and corporate bonds; and other debt securities in middle-market companies. The firm invests in growth capital, acquisitions, leveraged buyouts, market/product expansion, refinancing and recapitalization. The fund also invests up to 30 percent of their assets opportunistically in other types of investments, including the securities of larger public companies and foreign securities. It also makes investments in the secondary loan market. The fund does not invest in start-up companies, turnaround situations, or companies with speculative business plans. The fund prefers to invest in high tech industries, healthcare, pharmaceuticals, business services, media, chemicals, plastic, rubber, telecommunication, consumer services, advertising, printing and publishing, consumer goods, durables, diversified financials, and other industries. It also invests in homebuilding, restaurants, beverage and tobacco bars, broadcasting, distributors, Non-durable good distribution, food beverage and tobacco, energy, oil gas and consumables fuels, insurance, aerospace and defense, industrial machinery, paper and forest product machinery, information technology, metals and mining, and real estate. It primarily seeks to invest in the United States. The fund seeks to invest between $5 million and $50 million in companies with an EBITDA between $25 million and $75 million with average targeted hold of $25 million. It also purchases minority interests in the form of common or preferred equity in the target companies, typically in conjunction with its debt investments or through a co-investment with a financial sponsor. The fund seeks to exit its investments through an initial public offering of common stock, a merger, a sale, or other recapitalization. |
| Insider Trading |
Relationship |
Date |
Transaction |
Cost |
#Shares |
Value ($) |
#Shares Total |
SEC Form 4 |
| BRESNER GREGG A. | President & CIO | May 17 '24 | Buy | 12.51 | 2,000 | 25,020 | 52,099 | May 17 03:19 PM | | Reisner Michael A | Co-Chairman & Co-CEO | May 13 '24 | Buy | 12.27 | 407 | 4,994 | 44,160 | May 14 02:30 PM | | Pinero Eric A. | Chief Legal Officer | Apr 05 '24 | Buy | 11.11 | 450 | 5,000 | 7,136 | Apr 05 04:01 PM | | ROMAN STEPHEN | CCO & Secretary | Apr 01 '24 | Buy | 11.05 | 450 | 4,972 | 9,146 | Apr 01 02:23 PM | | Gatto Mark | Co-Chairman & Co-CEO | Mar 27 '24 | Buy | 11.02 | 1,150 | 12,673 | 1,000 | Mar 29 10:55 AM |
|
|
| |
 |
| Market Cap | 757.18M | EPS (ttm) | 0.61 |
| P/E | 32.44 | EPS this Y | -117.14% |
| Forward P/E | 43.28 | EPS next Y | 355.56% |
| PEG | 16.22 | EPS past 5Y | 57.99% |
| P/S | 0.18 | EPS next 5Y | 2.00% |
| P/B | - | EPS Q/Q | -1051.20% |
| Dividend | 10.55% | Sales Q/Q | -7.34% |
| Insider Own | 52.52% | Inst Own | 24.00% |
| Insider Trans | 0.01% | Inst Trans | -0.13% |
| Short Float | 0.58% | Earnings | May 08/a |
| Analyst Recom | 3.00 | Target Price | 20.00 |
| Avg Volume | 38.31K | 52W Range | 17.91 - 24.19 |
|
|
|
|
CrossAmerica Partners LP engages in the business of wholesaling distribution of motor fuel, convenience store operation, and the ownership and leasing of real estate used in the retail distribution of motor fuel. It operates through the Wholesale and Retail segments. The Wholesale segment focuses on providing wholesale distribution services to lessee dealers and independent dealers. The Retail segment includes retail sale of motor fuel at retail sites operated by commission agents, convenience merchandise items, and motor fuel at company operated sites. The company was founded on December 2, 2011 and is headquartered in Allentown, PA. |
| Insider Trading |
Relationship |
Date |
Transaction |
Cost |
#Shares |
Value ($) |
#Shares Total |
SEC Form 4 |
| Kelso Thomas E | Director | May 16 '24 | Buy | 19.52 | 500 | 9,761 | 2,476 | May 17 03:16 PM | | Gannon Justin A. | Director | May 14 '24 | Buy | 19.39 | 500 | 9,695 | 29,860 | May 16 04:53 PM | | Kelso Thomas E | Director | Mar 04 '24 | Buy | 21.64 | 500 | 10,820 | 1,976 | Mar 05 06:12 PM | | Topper Joseph V. Jr. | Director | May 30 '23 | Buy | 18.32 | 3,000 | 54,946 | 233,335 | May 30 08:38 PM | | Topper Joseph V. Jr. | Director | May 26 '23 | Buy | 18.33 | 15,000 | 274,922 | 230,335 | May 30 08:38 PM |
|
|
|
 |
| Market Cap | 179.13M | EPS (ttm) | -0.04 |
| P/E | - | EPS this Y | - |
| Forward P/E | - | EPS next Y | - |
| PEG | - | EPS past 5Y | 27.70% |
| P/S | 6.90 | EPS next 5Y | - |
| P/B | 0.77 | EPS Q/Q | -43.08% |
| Dividend | - | Sales Q/Q | 14.23% |
| Insider Own | 1.63% | Inst Own | 8.58% |
| Insider Trans | 4.88% | Inst Trans | -2.90% |
| Short Float | 6.25% | Earnings | May 09/a |
| Analyst Recom | 3.00 | Target Price | 0.44 |
| Avg Volume | 6.07M | 52W Range | 0.12 - 0.25 |
|
|
|
|
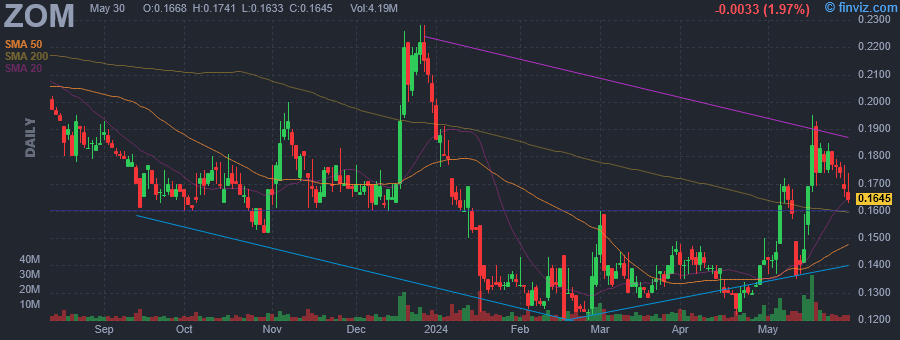
Zomedica Corp. operates as a veterinary health company, which engages in the discovery, development, and commercialization of pharmaceuticals for the companion pet. It offers products for dogs and cats by focusing on the unmet needs of clinical veterinarians. Its TRUFORMA biosensor platform is designed to assist practitioners in the diagnosis of complex conditions. The company was founded by Gerald L. Solensky. on January 7, 2013 and is headquartered in Ann Arbor, MI. |
| Insider Trading |
Relationship |
Date |
Transaction |
Cost |
#Shares |
Value ($) |
#Shares Total |
SEC Form 4 |
| POWERS JOHNNY D | Director | May 17 '24 | Buy | 0.17 | 100,000 | 17,450 | 2,225,000 | May 17 03:08 PM | | POWERS JOHNNY D | Director | May 16 '24 | Buy | 0.18 | 25,000 | 4,600 | 2,125,000 | May 17 10:08 AM | | POWERS JOHNNY D | Director | May 14 '24 | Buy | 0.14 | 50,000 | 6,981 | 2,100,000 | May 15 04:30 PM | | Blair Anthony K | COO | May 13 '24 | Buy | 0.14 | 150,000 | 21,000 | 150,000 | May 14 04:31 PM | | HEATON LARRY C II | CEO | May 13 '24 | Buy | 0.14 | 100,000 | 14,200 | 300,000 | May 13 05:07 PM |
|
|
|
 |
| Market Cap | 987.71M | EPS (ttm) | 2.84 |
| P/E | 11.71 | EPS this Y | -12.54% |
| Forward P/E | 12.72 | EPS next Y | 2.85% |
| PEG | 1.30 | EPS past 5Y | 7.87% |
| P/S | 3.04 | EPS next 5Y | 9.00% |
| P/B | 1.51 | EPS Q/Q | -8.85% |
| Dividend | 3.24% | Sales Q/Q | 11.06% |
| Insider Own | 4.97% | Inst Own | 49.32% |
| Insider Trans | 1.20% | Inst Trans | 0.65% |
| Short Float | 3.91% | Earnings | Apr 29/a |
| Analyst Recom | 2.75 | Target Price | 35.50 |
| Avg Volume | 115.84K | 52W Range | 24.85 - 34.96 |
|
|
|
|
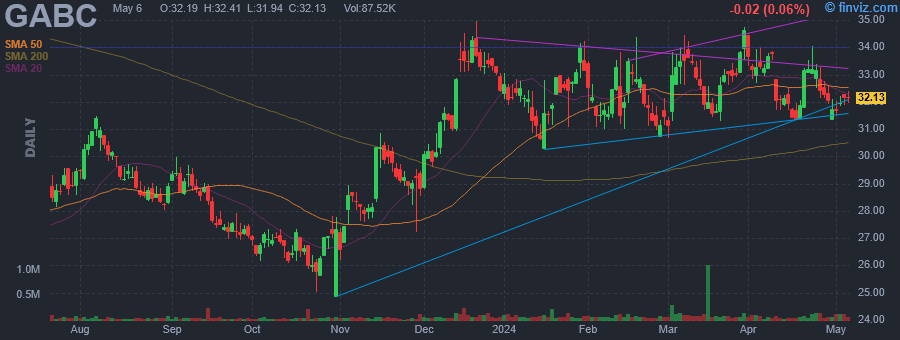
German American Bancorp, Inc. is a financial holding company, which engages in owning a trust, brokerage, and financial planning through German American Financial Advisors & Trust Co. and German American Insurance, Inc. It operates through the following segments: Core Banking, Wealth Management Services, Insurance Operations, and Other. The Core Banking segment is involved in attracting deposits from the public and using such funds to originate consumer, commercial and agricultural, commercial and agricultural real estate, and residential mortgage loans, primarily in the company's local markets. The Wealth Management Services segment offers trust, investment advisory, brokerage, and retirement planning services to customers. The Insurance Operations segment focuses on the full range of personal and corporate property and casualty insurance products, primarily in the company's banking subsidiary's local markets. The company was founded in 1982 and is headquartered in Jasper, IN. |
| Insider Trading |
Relationship |
Date |
Transaction |
Cost |
#Shares |
Value ($) |
#Shares Total |
SEC Form 4 |
| SHEIDLER JACK | Director | May 15 '24 | Buy | 33.00 | 80 | 2,650 | 61,375 | May 17 02:29 PM | | Bawel Zachary W | Director | May 15 '24 | Buy | 33.00 | 52 | 1,700 | 17,780 | May 17 12:04 PM | | Ellspermann Susan J | Director | May 15 '24 | Buy | 33.00 | 52 | 1,700 | 6,313 | May 17 12:24 PM | | SEGER THOMAS W | Director | May 15 '24 | Buy | 33.00 | 26 | 850 | 478,790 | May 17 12:43 PM | | SHEIDLER JACK | Director | Apr 15 '24 | Buy | 32.06 | 28 | 900 | 61,295 | Apr 18 11:58 AM |
|
|
|
