 |
| Market Cap | 74.89B | EPS (ttm) | 4.20 |
| P/E | 31.14 | EPS this Y | 6.21% |
| Forward P/E | 19.59 | EPS next Y | 11.85% |
| PEG | 3.20 | EPS past 5Y | 4.09% |
| P/S | 7.79 | EPS next 5Y | 9.72% |
| P/B | 2.91 | EPS Q/Q | -14.38% |
| Dividend | 1.38% | Sales Q/Q | 17.83% |
| Insider Own | 0.85% | Inst Own | 91.59% |
| Insider Trans | -9.18% | Inst Trans | -1.04% |
| Short Float | 0.85% | Earnings | May 02/b |
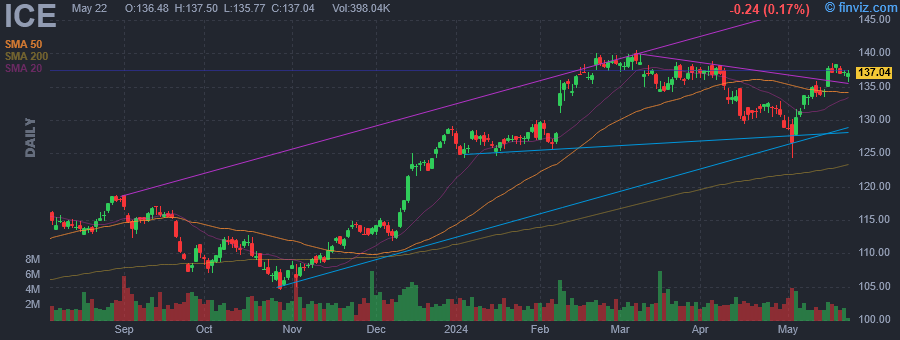
| Analyst Recom | 1.60 | Target Price | 154.31 |
| Avg Volume | 2.45M | 52W Range | 103.81 - 140.43 |
|
|
|
|
Intercontinental Exchange, Inc. engages in the provision of market infrastructure, data services and technology solutions. It operates through the following segments: Exchanges, Fixed Income and Data Services, and Mortgage Technology. The Exchanges segment includes trading and listing revenue from the global futures network, the New York Stock Exchange and other registered securities exchanges. The Fixed Income and Data Services segment is composed of fixed income data and analytics offerings, fixed income execution, credit default swap clearing and other multi-asset class data and network services. The Mortgage Technology segment provides an end-to-end network aimed at identifying and solving the inefficiencies that exist in the U.S. residential mortgage market. The company was founded by Jeffrey C. Sprecher in 2000 and is headquartered in Atlanta, GA. |
| Insider Trading |
Relationship |
Date |
Transaction |
Cost |
#Shares |
Value ($) |
#Shares Total |
SEC Form 4 |
| Intercontinental Exchange, Inc | 10% Owner | Apr 25 '24 | Buy | 0.87 | 350,880 | 304,213 | 649,934 | Apr 29 09:11 PM | | Sprecher Jeffrey C | Chief Executive Officer | Apr 03 '24 | Option Exercise | 50.01 | 58,388 | 2,919,984 | 1,238,283 | Apr 05 04:30 PM | | Sprecher Jeffrey C | Chief Executive Officer | Apr 03 '24 | Sale | 137.21 | 110,000 | 15,093,323 | 2,661,705 | Apr 05 04:30 PM | | Sprecher Jeffrey C | Chief Executive Officer | Apr 03 '24 | Sale | 137.21 | 58,388 | 8,011,519 | 1,179,895 | Apr 05 04:30 PM | | SPRIESER JUDITH A | Director | Mar 28 '24 | Sale | 137.36 | 2,238 | 307,422 | 29,347 | Apr 01 04:30 PM |
|
|
 |
 |
| Market Cap | 1.45B | EPS (ttm) | -16.48 |
| P/E | - | EPS this Y | 66.67% |
| Forward P/E | - | EPS next Y | 30.95% |
| PEG | - | EPS past 5Y | - |
| P/S | 1.86 | EPS next 5Y | - |
| P/B | 0.78 | EPS Q/Q | 76.12% |
| Dividend | - | Sales Q/Q | 1275.09% |
| Insider Own | 11.47% | Inst Own | 19.73% |
| Insider Trans | 0.10% | Inst Trans | 1.70% |
| Short Float | 0.63% | Earnings | Mar 25/a |
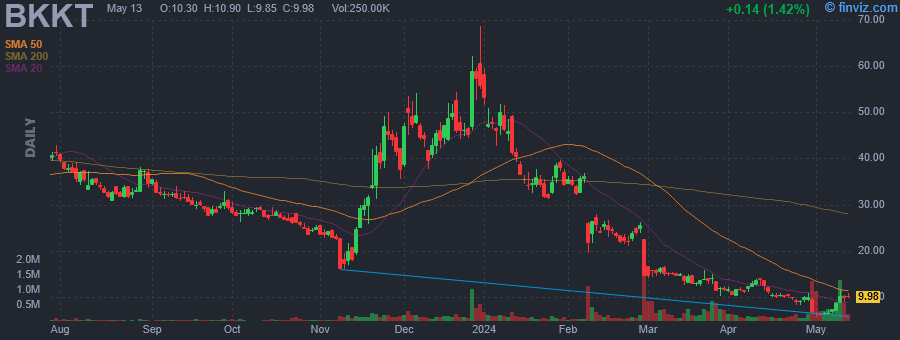
| Analyst Recom | 2.00 | Target Price | 31.25 |
| Avg Volume | 244.91K | 52W Range | 8.27 - 68.75 |
|
|
|
|
Bakkt Holdings, Inc. engages in the intersection of cryptoassets, loyalty and rewards, and payments. It also provides a platform to expand payment offerings, create new revenue streams, and increase customer loyalty. The company was founded in 2018 and is headquartered in Alpharetta, GA. |
| Insider Trading |
Relationship |
Date |
Transaction |
Cost |
#Shares |
Value ($) |
#Shares Total |
SEC Form 4 |
| Intercontinental Exchange, Inc | 10% Owner | Apr 25 '24 | Buy | 0.87 | 350,880 | 304,213 | 649,934 | Apr 29 09:11 PM | | Intercontinental Exchange, Inc | 10% Owner | Mar 04 '24 | Buy | 0.87 | 2,762,009 | 2,394,662 | 7,476,345 | Mar 04 05:34 PM | | D'Annunzio Marc | General Counsel & Secretary | Feb 23 '24 | Sale | 0.88 | 50,247 | 44,047 | 566,630 | Feb 26 09:28 PM | | D'Annunzio Marc | General Counsel & Secretary | Feb 08 '24 | Sale | 0.98 | 19,329 | 18,927 | 638,157 | Feb 09 09:13 PM | | D'Annunzio Marc | General Counsel & Secretary | Jan 25 '24 | Sale | 1.27 | 42,807 | 54,249 | 667,320 | Jan 29 07:19 PM |
|
|
|
 |
| Market Cap | 157.03M | EPS (ttm) | -0.49 |
| P/E | - | EPS this Y | 77.55% |
| Forward P/E | - | EPS next Y | 36.36% |
| PEG | - | EPS past 5Y | - |
| P/S | 365.19 | EPS next 5Y | - |
| P/B | 9.64 | EPS Q/Q | -141.87% |
| Dividend | - | Sales Q/Q | - |
| Insider Own | 53.59% | Inst Own | 3.33% |
| Insider Trans | 1.28% | Inst Trans | - |
| Short Float | 3.18% | Earnings | - |
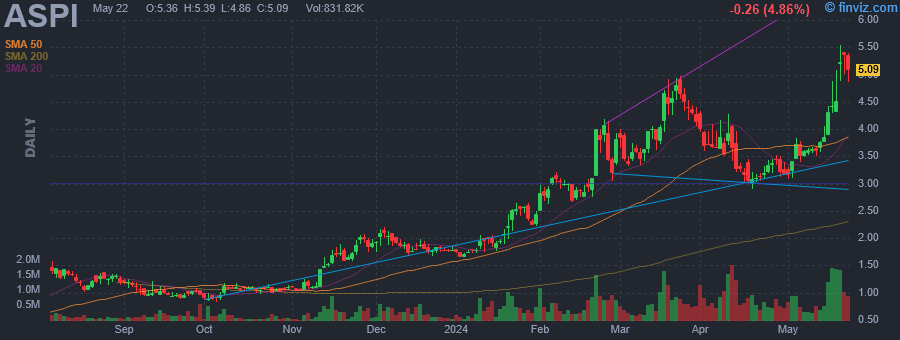
| Analyst Recom | 1.00 | Target Price | 5.50 |
| Avg Volume | 644.71K | 52W Range | 0.28 - 4.97 |
|
|
|
|
ASP Isotopes, Inc. is a pre-commercial stage advanced materials company, which engages in the development of technology and processes that will allow for the enrichment of natural isotopes into higher concentration products. Its products include medical, green energy, and Industrial isotopes. The company was founded by Paul E. Mann and Robert Ainscow on September 13, 2021 and is headquartered in Washington, DC. |
| Insider Trading |
Relationship |
Date |
Transaction |
Cost |
#Shares |
Value ($) |
#Shares Total |
SEC Form 4 |
| Ryan Robert John Andrew | Director | Apr 25 '24 | Buy | 3.42 | 9,500 | 32,450 | 546,555 | Apr 29 09:04 PM | | Ryan Robert John Andrew | Director | Jan 29 '24 | Buy | 2.35 | 15,596 | 36,651 | 537,055 | Feb 26 07:27 AM | | Ryan Robert John Andrew | Director | Jan 25 '24 | Buy | 2.54 | 100 | 254 | 521,459 | Feb 26 07:27 AM | | Ryan Robert John Andrew | Director | Jan 17 '24 | Buy | 1.91 | 100 | 191 | 521,359 | Feb 26 07:27 AM | | Ryan Robert John Andrew | Director | Jan 16 '24 | Buy | 1.92 | 2,550 | 4,896 | 521,259 | Feb 26 07:27 AM |
|
|
| |
 |
| Market Cap | 16.75B | EPS (ttm) | 6.31 |
| P/E | 25.71 | EPS this Y | -7.58% |
| Forward P/E | 19.22 | EPS next Y | 30.96% |
| PEG | 2.38 | EPS past 5Y | 9.50% |
| P/S | 1.34 | EPS next 5Y | 10.80% |
| P/B | 4.02 | EPS Q/Q | -35.15% |
| Dividend | 0.94% | Sales Q/Q | -8.84% |
| Insider Own | 19.95% | Inst Own | 75.83% |
| Insider Trans | -0.11% | Inst Trans | -3.43% |
| Short Float | 2.75% | Earnings | Apr 16/a |
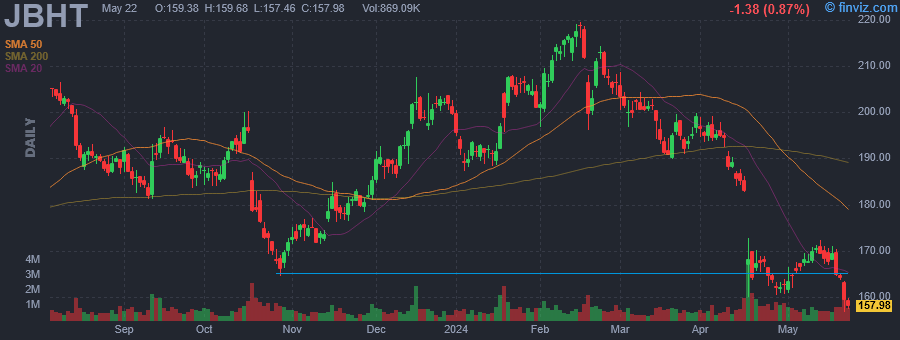
| Analyst Recom | 1.96 | Target Price | 192.67 |
| Avg Volume | 844.67K | 52W Range | 160.07 - 219.51 |
|
|
|
|
J.B. Hunt Transport Services, Inc. engages in the provision of logistics solutions. It operates through the following segments: Intermodal (JBI), Dedicated Contract Services (DCS), Integrated Capacity Solutions (ICS), Final Mile Services (FMS) and Truckload (JBT). The JBI segment offers intermodal freight operations for rail carriers. The DCS segment includes private fleet conversion and final-mile delivery services. The ICS segment provides single-source logistics management for clients who intend to outsource their transportation activities. It offers flatbed, refrigerated, expedited, less-than-truckload, dry-van, and intermodal freight services. The FMS segment provides final-mile delivery services to customers through a nationwide network of cross-dock and other delivery system network locations. The JBT segment is responsible for full-load, dry-van freight that is transported via roads and highways. The company was founded by Johnnie Bryan Hunt, Sr. and Johnelle D. Hunt on August 10, 1961, and is headquartered in Lowell, AR. |
| Insider Trading |
Relationship |
Date |
Transaction |
Cost |
#Shares |
Value ($) |
#Shares Total |
SEC Form 4 |
| ROBERTS JOHN N | CEO | Apr 26 '24 | Buy | 161.06 | 6,200 | 998,550 | 313,955 | Apr 29 08:51 PM | | Simpson Shelley | President | Mar 31 '24 | Option Exercise | 0.00 | 4,558 | 0 | 90,286 | Apr 02 03:24 PM | | Scott Stuart Lockard | EVP/CIO | Mar 31 '24 | Option Exercise | 0.00 | 3,472 | 0 | 37,371 | Apr 02 03:24 PM | | ROBERTS JOHN N | CEO | Mar 31 '24 | Option Exercise | 0.00 | 13,479 | 0 | 313,733 | Apr 02 03:23 PM | | McGee Eric | EVP Highway Services | Mar 31 '24 | Option Exercise | 0.00 | 868 | 0 | 1,332 | Apr 02 03:23 PM |
|
|
|
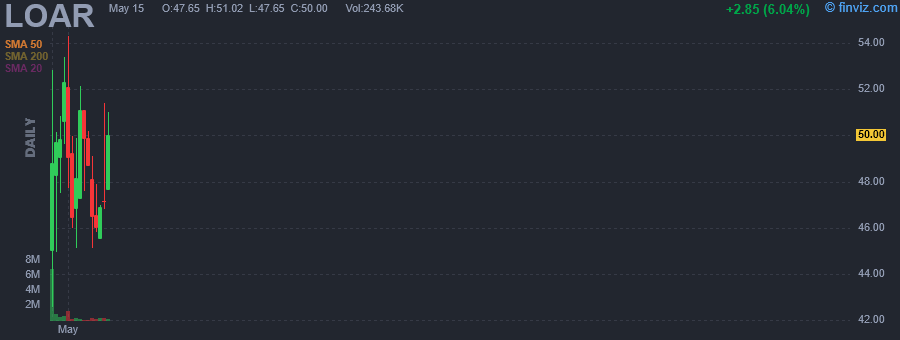 |
| Market Cap | 4.39B | EPS (ttm) | -0.05 |
| P/E | - | EPS this Y | - |
| Forward P/E | - | EPS next Y | - |
| PEG | - | EPS past 5Y | - |
| P/S | 13.82 | EPS next 5Y | - |
| P/B | 10.49 | EPS Q/Q | 81.10% |
| Dividend | - | Sales Q/Q | 24.79% |
| Insider Own | 17.02% | Inst Own | 43.68% |
| Insider Trans | 1.45% | Inst Trans | - |
| Short Float | - | Earnings | - |
| Analyst Recom | - | Target Price | - |
| Avg Volume | 3.92M | 52W Range | 42.57 - 52.85 |
|
|
|
|
Loar Holdings, Inc. engages in the designs, manufactures, and sale of niche aerospace and defense components for aircraft, aerospace and defense systems. The Company was founded on August 21, 2017 and is headquartered in White Plains, NY. |
| Insider Trading |
Relationship |
Date |
Transaction |
Cost |
#Shares |
Value ($) |
#Shares Total |
SEC Form 4 |
| McGetrick Margaret A | Director | Apr 29 '24 | Buy | 28.00 | 71,429 | 2,000,012 | 89,286 | Apr 29 04:54 PM | | CROW M CHAD | Director | Apr 29 '24 | Buy | 28.00 | 71,429 | 2,000,012 | 89,286 | Apr 29 04:55 PM | | Danmola Taiwo K. | Director | Apr 29 '24 | Buy | 28.00 | 71,429 | 2,000,012 | 89,286 | Apr 29 04:54 PM |
|
|
| |
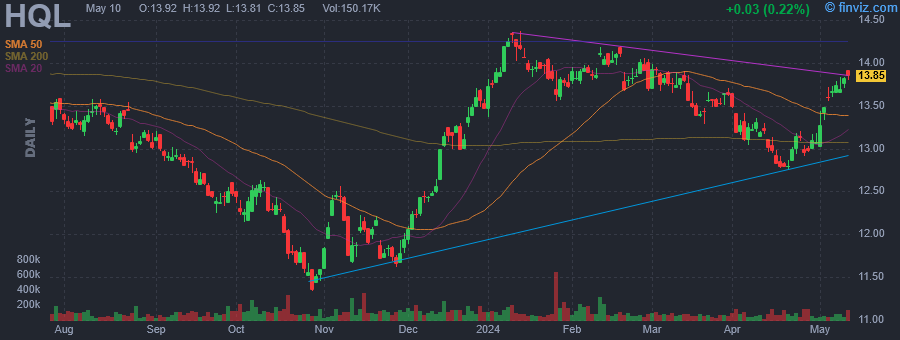 |
| Market Cap | 358.29M | EPS (ttm) | 0.79 |
| P/E | 16.58 | EPS this Y | - |
| Forward P/E | - | EPS next Y | - |
| PEG | - | EPS past 5Y | - |
| P/S | 101.99 | EPS next 5Y | - |
| P/B | 0.81 | EPS Q/Q | - |
| Dividend | 7.71% | Sales Q/Q | 34.40% |
| Insider Own | - | Inst Own | 36.04% |
| Insider Trans | - | Inst Trans | - |
| Short Float | 0.07% | Earnings | - |
| Analyst Recom | - | Target Price | - |
| Avg Volume | 105.42K | 52W Range | 11.34 - 14.37 |
|
|
|
|
Tekla Life Sciences Investors is a closed-ended equity mutual fund launched and managed by Tekla Capital Management LLC. The fund invests in public equity markets across the globe. It seeks to invest in stocks of companies operating in the life sciences sector, including the biotechnology, pharmaceutical, diagnostics, managed healthcare, medical equipment, hospitals, healthcare information technology and services, devices and supplies industries, and in agriculture and environmental management industries. The fund primarily invests in growth stocks of small cap companies. It employs fundamental analysis with a focus on factors such as market position for services or products, experience of business management, technological expertise, and the ability either to generate funds internally to finance growth or to secure outside sources of capital to create its portfolio. The fund benchmarks the performance of its portfolio against the NASDAQ Biotech Index and the S&P 500 Index. It was formerly known as H&Q Life Sciences Investors fund. Tekla Life Sciences Investors was formed on February 20, 1992 and is domiciled in the United States. |
| Insider Trading |
Relationship |
Date |
Transaction |
Cost |
#Shares |
Value ($) |
#Shares Total |
SEC Form 4 |
| Saba Capital Management, L.P. | 10% Owner | Apr 26 '24 | Buy | 13.00 | 120,304 | 1,563,952 | 3,025,602 | Apr 29 04:54 PM | | Saba Capital Management, L.P. | 10% Owner | Apr 25 '24 | Buy | 12.99 | 97,574 | 1,267,486 | 2,905,298 | Apr 26 11:40 AM | | Saba Capital Management, L.P. | 10% Owner | Apr 24 '24 | Buy | 13.12 | 20,529 | 269,340 | 2,807,724 | Apr 26 11:40 AM | | Saba Capital Management, L.P. | 10% Owner | Apr 23 '24 | Buy | 13.15 | 48,203 | 633,869 | 2,787,195 | Apr 23 08:00 PM | | Saba Capital Management, L.P. | 10% Owner | Apr 22 '24 | Buy | 12.88 | 2,022 | 26,043 | 2,738,992 | Apr 23 08:00 PM |
|
|
|
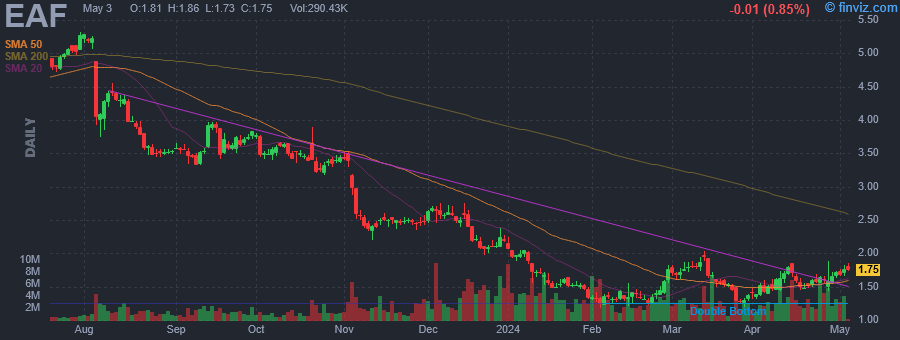 |
| Market Cap | 426.34M | EPS (ttm) | -1.08 |
| P/E | - | EPS this Y | 57.64% |
| Forward P/E | - | EPS next Y | 68.02% |
| PEG | - | EPS past 5Y | - |
| P/S | 0.69 | EPS next 5Y | -5.87% |
| P/B | 11.35 | EPS Q/Q | -317.77% |
| Dividend | 0.60% | Sales Q/Q | -1.60% |
| Insider Own | 26.54% | Inst Own | 74.44% |
| Insider Trans | -21.76% | Inst Trans | 1.19% |
| Short Float | 7.89% | Earnings | Apr 26/b |
| Analyst Recom | 3.00 | Target Price | 1.80 |
| Avg Volume | 3.33M | 52W Range | 1.18 - 5.32 |
|
|
|
|
GrafTech International Ltd. engages in the manufacture of graphite electrode products essential to the production of electric arc furnace steel and other ferrous and non-ferrous metals. The firm also produces a needle coke product which is a raw material in producing graphite electrodes. Its customers include steel producers and other ferrous and non-ferrous metal producers in Europe, the Middle East and Africa, the Americas and Asia-Pacific, which sell its products into the automotive, construction, appliance, machinery, equipment, and transportation industries. The company was founded in 1886 and is headquartered in Brooklyn Heights, OH. |
| Insider Trading |
Relationship |
Date |
Transaction |
Cost |
#Shares |
Value ($) |
#Shares Total |
SEC Form 4 |
| Colonial House Capital Ltd | 10% Owner | Apr 26 '24 | Buy | 1.48 | 179,279 | 266,211 | 29,714,854 | Apr 29 04:41 PM | | Colonial House Capital Ltd | 10% Owner | Apr 16 '24 | Buy | 1.78 | 2,303,599 | 4,100,867 | 29,535,575 | Apr 18 04:08 PM | | BCP GP Ltd | Former 10% Owner | Jan 02 '24 | Sale | 2.20 | 3,922,786 | 8,630,129 | 23,352,826 | Jan 04 08:32 PM | | BCP GP Ltd | Former 10% Owner | Jan 02 '24 | Sale | 2.20 | 3,922,786 | 8,630,129 | 23,352,826 | Jan 04 08:27 PM | | BCP GP Ltd | Former 10% Owner | Jan 02 '24 | Sale | 2.20 | 3,922,786 | 8,630,129 | 23,352,826 | Jan 04 08:23 PM |
|
|
| |
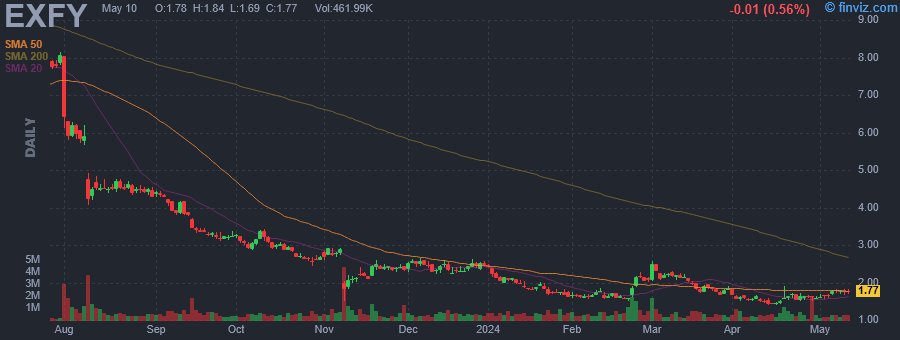 |
| Market Cap | 137.24M | EPS (ttm) | -0.51 |
| P/E | - | EPS this Y | 2941.09% |
| Forward P/E | 7.97 | EPS next Y | 11.06% |
| PEG | - | EPS past 5Y | - |
| P/S | 0.91 | EPS next 5Y | - |
| P/B | 1.36 | EPS Q/Q | -115.14% |
| Dividend | - | Sales Q/Q | -19.00% |
| Insider Own | 48.28% | Inst Own | 39.26% |
| Insider Trans | 0.75% | Inst Trans | -1.53% |
| Short Float | 4.97% | Earnings | May 09/a |
| Analyst Recom | 2.67 | Target Price | 2.75 |
| Avg Volume | 646.84K | 52W Range | 1.40 - 8.25 |
|
|
|
|
Expensify, Inc. engages in the provision of a cloud-based expense management software platform that helps the smallest to the largest businesses simplify the way they manage money. It operates under the United States and All Other Locations geographical segments. The company was founded by David Barrett and Witold Stankiewicz on May 1, 2008 and is headquartered in Portland, OR. |
| Insider Trading |
Relationship |
Date |
Transaction |
Cost |
#Shares |
Value ($) |
#Shares Total |
SEC Form 4 |
| McLaughlin Steven J. | 10% Owner | Apr 26 '24 | Buy | 1.60 | 200 | 320 | 9,015,836 | Apr 29 04:38 PM | | McLaughlin Steven J. | 10% Owner | Apr 25 '24 | Buy | 1.59 | 17,511 | 27,842 | 9,015,636 | Apr 29 04:38 PM | | Barrett David Michael | Chief Executive Officer | Apr 25 '24 | Sale | 1.59 | 15,600 | 24,804 | 1,039,848 | Apr 25 06:43 PM | | Barrett David Michael | Chief Executive Officer | Apr 24 '24 | Sale | 1.56 | 15,910 | 24,820 | 1,055,448 | Apr 25 06:43 PM | | Barrett David Michael | Chief Executive Officer | Apr 23 '24 | Sale | 1.61 | 15,247 | 24,548 | 1,071,358 | Apr 25 06:43 PM |
|
|
|
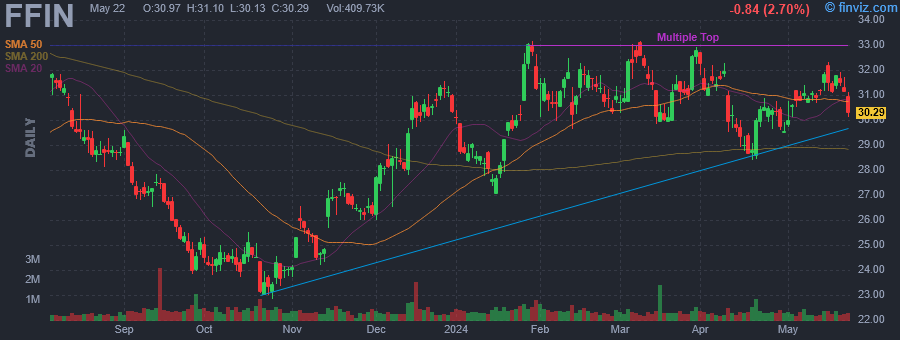 |
| Market Cap | 4.24B | EPS (ttm) | 1.40 |
| P/E | 21.27 | EPS this Y | 4.69% |
| Forward P/E | 19.17 | EPS next Y | 5.01% |
| PEG | 2.13 | EPS past 5Y | 4.67% |
| P/S | 6.38 | EPS next 5Y | 10.00% |
| P/B | 2.85 | EPS Q/Q | 1.61% |
| Dividend | 2.50% | Sales Q/Q | 20.39% |
| Insider Own | 4.11% | Inst Own | 70.10% |
| Insider Trans | 0.06% | Inst Trans | -0.56% |
| Short Float | 6.61% | Earnings | Apr 18/a |
| Analyst Recom | 3.00 | Target Price | 31.40 |
| Avg Volume | 497.24K | 52W Range | 22.84 - 33.15 |
|
|
|
|
First Financial Bankshares, Inc. is a holding company, which engages in the provision of financial and community banking services. It offers mortgage loans, savings and checking accounts, auto and equity loans, online and mobile banking, investment and trust management, and retirement plans. The company was founded in 1956 and is headquartered in Abilene, TX. |
| Insider Trading |
Relationship |
Date |
Transaction |
Cost |
#Shares |
Value ($) |
#Shares Total |
SEC Form 4 |
| TROTTER JOHNNY | Director | Apr 25 '24 | Buy | 30.22 | 1,500 | 45,330 | 940,371 | Apr 29 04:05 PM | | DUESER F SCOTT | Chairman, President and CEO | Feb 20 '24 | Option Exercise | 21.18 | 20,000 | 423,600 | 951,065 | Feb 20 04:25 PM | | Bailey David William | EVP, Commercial Banking | Feb 07 '24 | Option Exercise | 16.95 | 3,000 | 50,850 | 12,087 | Feb 09 10:41 AM | | Roewe Randall Allen | Chief Risk Officer | Feb 07 '24 | Option Exercise | 29.70 | 360 | 10,692 | 30,082 | Feb 08 03:25 PM | | Nickles Robert Clark Jr | Director | Feb 07 '24 | Buy | 30.47 | 584 | 17,794 | 92,970 | Feb 08 01:28 PM |
|
|
|
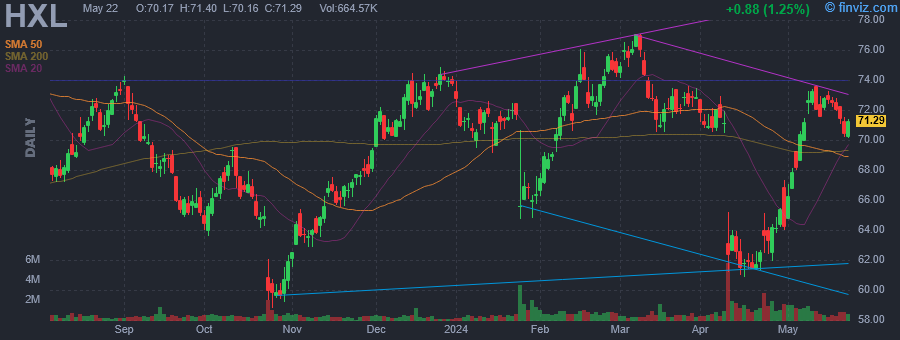 |
| Market Cap | 5.44B | EPS (ttm) | 1.16 |
| P/E | 56.24 | EPS this Y | 22.95% |
| Forward P/E | 22.36 | EPS next Y | 31.50% |
| PEG | 2.13 | EPS past 5Y | -16.84% |
| P/S | 3.03 | EPS next 5Y | 26.37% |
| P/B | 3.33 | EPS Q/Q | -13.82% |
| Dividend | 0.92% | Sales Q/Q | 1.72% |
| Insider Own | 0.65% | Inst Own | 99.82% |
| Insider Trans | 3.77% | Inst Trans | 1.69% |
| Short Float | 1.29% | Earnings | Apr 22/a |
| Analyst Recom | 2.55 | Target Price | 76.29 |
| Avg Volume | 982.92K | 52W Range | 58.81 - 79.08 |
|
|
|
|
Hexcel Corp. engages in the development, manufacture, and marketing of lightweight structural materials. It operates through the Composite Materials and Engineered Products segments. The Composite Materials segment includes carbon fiber, specialty reinforcements, resins, prepregs and other fiber-reinforced matrix materials, and honeycomb core product lines and pultruded profiles. The Engineered Products segment refers to the lightweight high strength composite structures, engineered core and honeycomb products with added functionality, and additive manufacturing. The company was founded by Roger C. Steele and Roscoe T. Hughes in 1946 and is headquartered in Stamford, CT. |
| Insider Trading |
Relationship |
Date |
Transaction |
Cost |
#Shares |
Value ($) |
#Shares Total |
SEC Form 4 |
| Stanage Nick L | Chairman, CEO and President | Apr 26 '24 | Buy | 64.29 | 15,000 | 964,350 | 392,446 | Apr 29 04:01 PM | | CAMPBELL JEFFREY C | Director | Apr 25 '24 | Buy | 64.13 | 10,000 | 641,300 | 17,803 | Apr 29 04:00 PM | | Suever Catherine A | Director | Apr 07 '24 | Option Exercise | 0.00 | 335 | 0 | 15,348 | Apr 08 04:00 PM | | Fitzsimons Gina | See Remarks | Feb 14 '24 | Sale | 72.10 | 864 | 62,294 | 3,375 | Feb 15 04:40 PM | | Merlot Thierry | See Remarks | Feb 09 '24 | Sale | 71.63 | 4,500 | 322,335 | 50,371 | Feb 13 10:18 AM |
|
|
|
