 |
| Market Cap | 2.86B | EPS (ttm) | 3.30 |
| P/E | 18.56 | EPS this Y | -1.16% |
| Forward P/E | 14.33 | EPS next Y | 22.10% |
| PEG | 2.32 | EPS past 5Y | -9.39% |
| P/S | 1.57 | EPS next 5Y | 8.00% |
| P/B | 1.00 | EPS Q/Q | -34.89% |
| Dividend | - | Sales Q/Q | 8.14% |
| Insider Own | 1.89% | Inst Own | 101.18% |
| Insider Trans | 10.81% | Inst Trans | -3.90% |
| Short Float | 4.50% | Earnings | Apr 18/b |
| Analyst Recom | 2.93 | Target Price | 63.04 |
| Avg Volume | 400.66K | 52W Range | 46.54 - 66.18 |
|
|
|
|
Texas Capital Bancshares, Inc. is a holding company, which engages in the provision of financial services and customized solutions to businesses, entrepreneurs, and individual customers. The company was founded by George F. Jones, Jr. and Joseph M. Grant in November 1996 and is headquartered in Dallas, TX. |
| Insider Trading |
Relationship |
Date |
Transaction |
Cost |
#Shares |
Value ($) |
#Shares Total |
SEC Form 4 |
| STALLINGS ROBERT W | Director | May 17 '24 | Buy | 19.53 | 996 | 19,452 | 157,706 | May 20 04:21 PM | | STALLINGS ROBERT W | Director | May 16 '24 | Buy | 19.40 | 4 | 78 | 156,710 | May 20 04:21 PM | | STALLINGS ROBERT W | Director | May 10 '24 | Buy | 19.50 | 3,000 | 58,500 | 156,706 | May 14 05:05 PM | | STALLINGS ROBERT W | Director | May 07 '24 | Buy | 19.70 | 3,000 | 59,100 | 153,706 | May 08 05:07 PM | | ROSENBERG STEVE | Director | Apr 24 '24 | Option Exercise | 0.00 | 1,631 | 0 | 6,265 | Apr 25 07:17 PM |
|
|
 |
 |
| Market Cap | 39.69M | EPS (ttm) | 0.07 |
| P/E | 4.22 | EPS this Y | -279.60% |
| Forward P/E | - | EPS next Y | - |
| PEG | - | EPS past 5Y | - |
| P/S | 23.77 | EPS next 5Y | - |
| P/B | 0.48 | EPS Q/Q | 1.51% |
| Dividend | - | Sales Q/Q | 1285.21% |
| Insider Own | 8.61% | Inst Own | 6.85% |
| Insider Trans | 12.69% | Inst Trans | -7.01% |
| Short Float | 0.81% | Earnings | Apr 30/b |
| Analyst Recom | 3.00 | Target Price | 4.00 |
| Avg Volume | 868.95K | 52W Range | 0.23 - 0.99 |
|
|
|
|
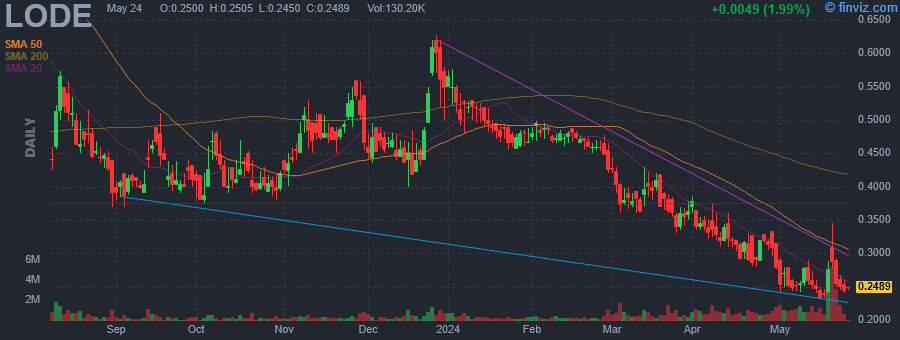
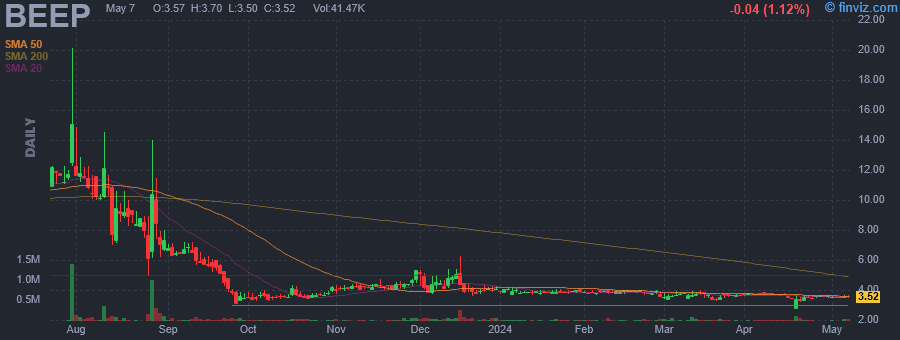
Comstock, Inc. engages in the innovation, commercialization, and development of technologies that enable systemic decarbonization by converting under-utilized natural resources into renewable energy products. It operates through the following segments: Fuels, Metals, Mining, Strategic Investments, and Corporate and Other. The Fuels segment develops and commercializes technologies that extract and convert wasted and unused lignocellulosic biomass into intermediates for refining into advanced renewable fuels. The Metals segment is involved in recycling metals from other electronic devices, such as end-of-life batteries and fuel cells at later stages of development and production. The Mining segment focuses on leases, licenses, and related fees. It is administered by Comstock Mining LLC, and various other subsidiaries that collectively own or control twelve square miles of properties of patented mining claims, unpatented mining claims, and surface parcels in Northern Nevada. The Strategic Investments segment represents investments and projects that are strategic to plans and the ability to produce and maximize throughput in fuels, metals, and mining segments. The Corporate and Other segment includes corporate functions and services, including research and development activities that are ongoing outside of the business activities related to fuels, metals, mining, and strategic investments segments. The company was founded in 1999 and is headquartered in Virginia City, NV. |
| Insider Trading |
Relationship |
Date |
Transaction |
Cost |
#Shares |
Value ($) |
#Shares Total |
SEC Form 4 |
| BOBBILI RAHUL | Chief Engineering Officer | May 20 '24 | Buy | 0.29 | 25,000 | 7,258 | 1,075,000 | May 20 04:19 PM | | DEGASPERIS CORRADO | Executive Chairman and CEO | May 17 '24 | Buy | 0.40 | 1,250,000 | 500,000 | 1,358,180 | May 20 07:28 AM | | BOBBILI RAHUL | Chief Engineering Officer | May 13 '24 | Buy | 0.26 | 25,000 | 6,403 | 1,050,000 | May 13 04:09 PM | | MCCARTHY WILLIAM JOSEPH | Chief Operating Officer | May 09 '24 | Buy | 0.26 | 15,000 | 3,854 | 1,542,000 | May 10 12:41 PM | | BOBBILI RAHUL | Chief Engineering Officer | May 08 '24 | Buy | 0.25 | 15,000 | 3,768 | 1,025,000 | May 08 04:08 PM |
|
|
|
 |
| Market Cap | 286.51M | EPS (ttm) | 1.82 |
| P/E | 11.53 | EPS this Y | 16.82% |
| Forward P/E | 8.60 | EPS next Y | 5.49% |
| PEG | 0.63 | EPS past 5Y | 75.63% |
| P/S | 0.97 | EPS next 5Y | 18.27% |
| P/B | 0.68 | EPS Q/Q | 13.03% |
| Dividend | - | Sales Q/Q | 37.01% |
| Insider Own | 15.27% | Inst Own | 35.58% |
| Insider Trans | 0.07% | Inst Trans | 4.79% |
| Short Float | 0.89% | Earnings | Apr 24/a |
| Analyst Recom | 1.75 | Target Price | 24.75 |
| Avg Volume | 31.71K | 52W Range | 14.09 - 21.88 |
|
|
|
|
Third Coast Bancshares, Inc. engages in operation of a bank holding company. It offers checking, loans, mortgage, and online banking. The company was founded in March 2008 and is headquartered in Humble, TX. |
| Insider Trading |
Relationship |
Date |
Transaction |
Cost |
#Shares |
Value ($) |
#Shares Total |
SEC Form 4 |
| Bobbora William | See Remarks | May 16 '24 | Buy | 21.32 | 1,500 | 31,980 | 2,600 | May 20 04:15 PM | | Basaldua Martin | Director | Mar 21 '24 | Option Exercise | 11.00 | 5,000 | 55,000 | 14,431 | Mar 25 04:01 PM | | Glander Troy Andrew | Director | Mar 21 '24 | Option Exercise | 11.00 | 5,000 | 55,000 | 31,927 | Mar 25 04:01 PM | | Stunja Joseph | Director | Mar 15 '24 | Option Exercise | 11.00 | 5,000 | 55,000 | 10,864 | Mar 18 04:01 PM | | Duncan Audrey | See Remarks | Nov 15 '23 | Buy | 17.63 | 1,500 | 26,445 | 1,500 | Nov 17 03:56 PM |
|
|
| |
 |
| Market Cap | 25.66M | EPS (ttm) | -0.32 |
| P/E | - | EPS this Y | 30.72% |
| Forward P/E | 10.26 | EPS next Y | 132.55% |
| PEG | - | EPS past 5Y | 18.04% |
| P/S | 0.21 | EPS next 5Y | - |
| P/B | 4.00 | EPS Q/Q | -7.59% |
| Dividend | - | Sales Q/Q | 10.26% |
| Insider Own | 42.66% | Inst Own | 19.10% |
| Insider Trans | 2.27% | Inst Trans | 5.86% |
| Short Float | 0.57% | Earnings | May 13/a |
| Analyst Recom | 1.00 | Target Price | 2.83 |
| Avg Volume | 59.78K | 52W Range | 0.75 - 2.47 |
|
|
|
|
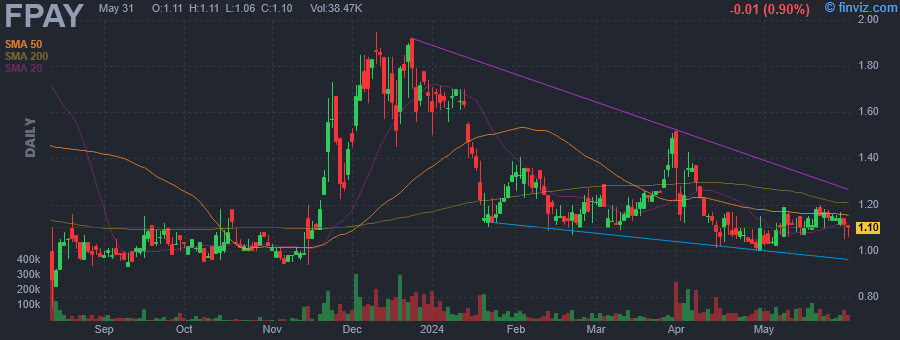
FlexShopper, Inc. is a financial technology company, which engages in the provision of electronics, home furnishings, and other durable goods to underserved consumers on a lease-to-own (LTO) basis through its patented e-commerce marketplace. The firm is also involved in providing LTO and loan technology platforms to a growing number of retailers and e-retailers to facilitate transactions with consumers without access to traditional financing. The company was founded by George F. Rubin, Morry F. Rubin, and Brad Mitchell Bernstein on August 16, 2006 and is headquartered in Boca Raton, FL. |
| Insider Trading |
Relationship |
Date |
Transaction |
Cost |
#Shares |
Value ($) |
#Shares Total |
SEC Form 4 |
| Dvorkin Howard | Director | May 17 '24 | Buy | 1.12 | 49,862 | 55,845 | 4,157,568 | May 20 04:09 PM | | Dvorkin Howard | Director | May 16 '24 | Buy | 1.12 | 44,868 | 50,252 | 4,107,706 | May 20 04:09 PM | | Dvorkin Howard | Director | Dec 29 '23 | Buy | 1.69 | 26,867 | 45,405 | 4,062,838 | Jan 02 04:01 PM | | Dvorkin Howard | Director | Dec 28 '23 | Buy | 1.74 | 50,879 | 88,529 | 4,035,971 | Jan 02 04:01 PM | | Dvorkin Howard | Director | Nov 20 '23 | Buy | 1.12 | 8,707 | 9,752 | 3,985,092 | Nov 21 04:35 PM |
|
|
|
 |
| Market Cap | 141.95M | EPS (ttm) | 0.74 |
| P/E | 6.78 | EPS this Y | -22.24% |
| Forward P/E | 3.37 | EPS next Y | 176.78% |
| PEG | - | EPS past 5Y | - |
| P/S | 0.51 | EPS next 5Y | - |
| P/B | - | EPS Q/Q | 79.90% |
| Dividend | - | Sales Q/Q | 55.70% |
| Insider Own | 38.50% | Inst Own | 51.61% |
| Insider Trans | 0.45% | Inst Trans | -11.00% |
| Short Float | 3.33% | Earnings | May 09/a |
| Analyst Recom | 1.40 | Target Price | 8.60 |
| Avg Volume | 63.88K | 52W Range | 4.43 - 8.46 |
|
|
|
|
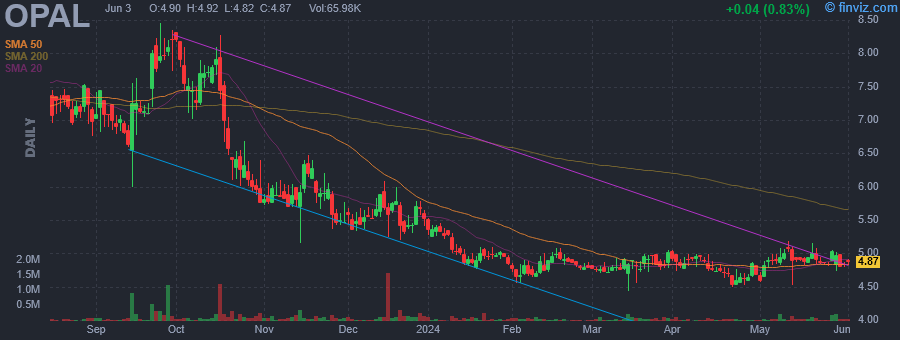
OPAL Fuels, Inc. engages in the production and distribution of low-carbon intensity renewable natural gas. It operates as a vertical waste-to-energy model that combines the upstream production and downstream marketing and distribution of RNG. The company operates under the following segments: RNG Fuel, Fuel Station Services, Renewable Power Portfolio, and Corporate. The RNG Fuel segment relates to all RNG supply and dispensing activities directly related to the generation and sale of brown gas. The Fuel Station Services provides construction and maintenance services to third-party owners of vehicle fueling stations. The Renewable Power Portfolio segment generates renewable power which is then sold to public utilities. The Corporate segment consists of activities managed and maintained at the company corporate level. The company is Founded in 1998 and is headquartered in White Plains, NY. |
| Insider Trading |
Relationship |
Date |
Transaction |
Cost |
#Shares |
Value ($) |
#Shares Total |
SEC Form 4 |
| Dols Scott V. | Director | May 17 '24 | Buy | 4.93 | 6,000 | 29,580 | 7,601 | May 20 04:09 PM | | Dols Scott V. | Director | May 16 '24 | Buy | 4.88 | 2,808 | 13,703 | 23,631 | May 20 04:09 PM | | Nisar Nadeem | Director | Dec 13 '23 | Buy | 5.63 | 5,000 | 28,175 | 40,125 | Dec 14 04:06 PM | | Nisar Nadeem | Director | Dec 12 '23 | Buy | 5.58 | 5,000 | 27,908 | 35,125 | Dec 13 04:03 PM | | Dols Scott V. | Director | Dec 01 '23 | Buy | 5.58 | 15,000 | 83,642 | 20,823 | Dec 04 04:08 PM |
|
|
| |
 |
| Market Cap | 259.91M | EPS (ttm) | 0.12 |
| P/E | 72.34 | EPS this Y | 42.78% |
| Forward P/E | 28.54 | EPS next Y | 42.49% |
| PEG | 18.09 | EPS past 5Y | - |
| P/S | 0.54 | EPS next 5Y | 4.00% |
| P/B | 18.03 | EPS Q/Q | -103.92% |
| Dividend | - | Sales Q/Q | -6.02% |
| Insider Own | 21.32% | Inst Own | 76.03% |
| Insider Trans | 0.08% | Inst Trans | -5.44% |
| Short Float | 4.93% | Earnings | May 08/a |
| Analyst Recom | 1.50 | Target Price | 17.00 |
| Avg Volume | 285.06K | 52W Range | 7.12 - 14.36 |
|
|
|
|
Potbelly Corp. engages in the owning and operating of sandwich restaurants. It offers toasty sandwiches, signature salads, and other fresh menu items. The company was founded in 1977 and is headquartered in Chicago, IL. |
| Insider Trading |
Relationship |
Date |
Transaction |
Cost |
#Shares |
Value ($) |
#Shares Total |
SEC Form 4 |
| Wright Robert D. | President and CEO | May 15 '24 | Buy | 8.94 | 1,450 | 12,963 | 726,413 | May 20 04:07 PM | | Cirulis Steven | SVP, Chief Financial Officer | May 15 '24 | Buy | 8.77 | 1,141 | 10,007 | 339,609 | May 20 04:06 PM | | Douglas Jeffrey | SVP, Chief Information Officer | Apr 30 '24 | Option Exercise | 0.00 | 42,016 | 0 | 167,930 | May 02 07:54 PM | | Dixon Adiya | SVP, CLO and Secretary | Apr 30 '24 | Option Exercise | 0.00 | 50,420 | 0 | 111,873 | May 02 07:55 PM | | Cirulis Steven | SVP, Chief Financial Officer | Apr 30 '24 | Option Exercise | 0.00 | 50,420 | 0 | 354,690 | May 02 07:55 PM |
|
|
|
 |
| Market Cap | 153.31M | EPS (ttm) | -0.02 |
| P/E | - | EPS this Y | -86.67% |
| Forward P/E | 13.82 | EPS next Y | 1325.00% |
| PEG | - | EPS past 5Y | -0.10% |
| P/S | 0.55 | EPS next 5Y | 10.00% |
| P/B | 1.59 | EPS Q/Q | -200.72% |
| Dividend | 5.71% | Sales Q/Q | -18.11% |
| Insider Own | 30.15% | Inst Own | 62.68% |
| Insider Trans | 0.11% | Inst Trans | -8.78% |
| Short Float | 0.47% | Earnings | May 09/a |
| Analyst Recom | 1.00 | Target Price | 6.08 |
| Avg Volume | 118.20K | 52W Range | 2.93 - 5.87 |
|
|
|
|
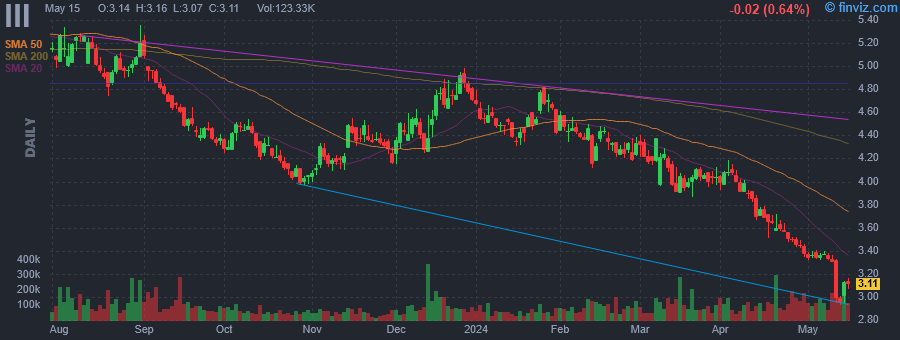
Information Services Group, Inc. engages in the provision of sourcing advisory services. It operates through the following geographical segments: Americas, Europe, and Asia Pacific. The firm offers business advisory, human resources technology and delivery services, organizational change management and software advisory services to the aerospace, defense, automotive, banking, energy, healthcare, and insurance industries. The company was founded by Michael P.Connors in 2006 and is headquartered in Stamford, CT. |
| Insider Trading |
Relationship |
Date |
Transaction |
Cost |
#Shares |
Value ($) |
#Shares Total |
SEC Form 4 |
| Lavieri Todd D. | VICE CHAIRMAN | May 16 '24 | Buy | 3.15 | 16,000 | 50,400 | 982,645 | May 20 04:05 PM | | CONNORS MICHAEL P | CHAIRMAN & CEO | Sep 05 '23 | Sale | 5.00 | 3,688 | 18,440 | 5,164,134 | Sep 06 05:05 PM | | Lavieri Todd D. | VICE CHAIRMAN | Aug 31 '23 | Sale | 5.25 | 15,000 | 78,750 | 886,721 | Aug 31 04:15 PM | | Lavieri Todd D. | VICE CHAIRMAN | Aug 30 '23 | Sale | 5.06 | 10,000 | 50,600 | 901,721 | Aug 31 04:15 PM | | CONNORS MICHAEL P | CHAIRMAN & CEO | Aug 29 '23 | Sale | 5.00 | 43,411 | 217,055 | 5,213,042 | Aug 30 05:11 PM |
|
|
| |
 |
| Market Cap | 108.77M | EPS (ttm) | 0.14 |
| P/E | 24.84 | EPS this Y | - |
| Forward P/E | - | EPS next Y | - |
| PEG | - | EPS past 5Y | - |
| P/S | - | EPS next 5Y | - |
| P/B | 0.93 | EPS Q/Q | -1078.95% |
| Dividend | - | Sales Q/Q | - |
| Insider Own | 28.60% | Inst Own | 79.92% |
| Insider Trans | 1.77% | Inst Trans | 1.03% |
| Short Float | 0.02% | Earnings | May 15/a |
| Analyst Recom | - | Target Price | - |
| Avg Volume | 26.78K | 52W Range | 2.75 - 20.12 |
|
|
|
|
Mobile Infrastructure Corp. engages in the acquisition, ownership, and lease of parking facilities and related infrastructure, including parking lots, parking garages, and other parking structures. The company was founded on May 4, 2015 and is headquartered in Cincinnati, OH. |
| Insider Trading |
Relationship |
Date |
Transaction |
Cost |
#Shares |
Value ($) |
#Shares Total |
SEC Form 4 |
| Chavez Manuel III | CEO | May 17 '24 | Buy | 3.49 | 1,183 | 4,129 | 118,071 | May 20 04:05 PM | | Chavez Manuel III | CEO | May 09 '24 | Buy | 3.50 | 473 | 1,656 | 116,888 | May 10 04:10 PM | | Chavez Manuel III | CEO | May 08 '24 | Buy | 3.50 | 814 | 2,849 | 116,415 | May 10 04:08 PM | | Chavez Manuel III | CEO | May 07 '24 | Buy | 3.50 | 24 | 84 | 115,601 | May 08 04:05 PM | | Chavez Manuel III | CEO | May 03 '24 | Buy | 3.50 | 559 | 1,956 | 115,577 | May 06 04:49 PM |
|
|
|
 |
| Market Cap | 444.41M | EPS (ttm) | 4.68 |
| P/E | 8.04 | EPS this Y | -12.01% |
| Forward P/E | 7.22 | EPS next Y | 16.63% |
| PEG | - | EPS past 5Y | 5.98% |
| P/S | 1.61 | EPS next 5Y | - |
| P/B | 0.85 | EPS Q/Q | -30.17% |
| Dividend | 4.48% | Sales Q/Q | 7.43% |
| Insider Own | 4.06% | Inst Own | 73.34% |
| Insider Trans | 0.93% | Inst Trans | -0.68% |
| Short Float | 0.62% | Earnings | Apr 30/b |
| Analyst Recom | 3.00 | Target Price | 42.50 |
| Avg Volume | 42.54K | 52W Range | 31.55 - 44.91 |
|
|
|
|
First Financial Corp. is a holding company, which engages in providing financial services. It offers commercial, mortgage and consumer lending, lease financing, trust account services, depositor services, and insurance services. The company was founded on October 28, 1982 and is headquartered in Terre Haute, IN. |
| Insider Trading |
Relationship |
Date |
Transaction |
Cost |
#Shares |
Value ($) |
#Shares Total |
SEC Form 4 |
| Franklin Mark Allen | CHIEF LENDING OFFICER | May 20 '24 | Buy | 38.83 | 900 | 34,945 | 6,783 | May 20 04:01 PM | | Blade Mark Jason Sr | Director | May 06 '24 | Buy | 38.06 | 531 | 20,210 | 1,608 | May 06 03:33 PM | | Jensen Susan M | Director | May 03 '24 | Buy | 37.19 | 92 | 3,421 | 1,620 | May 07 04:21 PM | | Jensen Susan M | Director | Mar 06 '24 | Buy | 37.82 | 46 | 1,740 | 1,507 | Mar 08 08:25 AM | | Pierson Paul Joseph II | Director | Feb 28 '24 | Buy | 36.81 | 500 | 18,405 | 10,000 | Mar 11 10:05 AM |
|
|
|
 |
| Market Cap | 20.62M | EPS (ttm) | -3.19 |
| P/E | - | EPS this Y | 64.73% |
| Forward P/E | - | EPS next Y | 73.97% |
| PEG | - | EPS past 5Y | -87.80% |
| P/S | 0.59 | EPS next 5Y | - |
| P/B | - | EPS Q/Q | 72.45% |
| Dividend | - | Sales Q/Q | -23.65% |
| Insider Own | 50.15% | Inst Own | 2.16% |
| Insider Trans | 102.65% | Inst Trans | -10.64% |
| Short Float | 1.46% | Earnings | May 09/a |
| Analyst Recom | 1.00 | Target Price | 6.00 |
| Avg Volume | 415.21K | 52W Range | 0.33 - 3.46 |
|
|
|
|
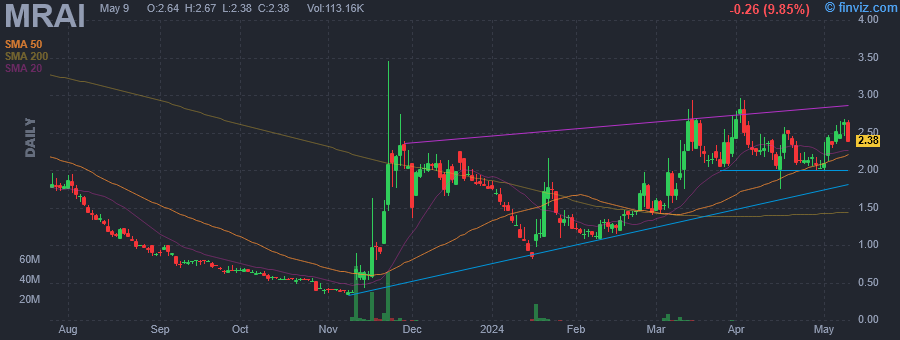
Marpai, Inc. offers a SMART health plan services system that transforms health plan into a health empowerment tool. It provides health plan services system addresses the problems of healthcare. The firm uses deep learning, artificial intelligence, to empower people to live better, stay strong and spend less on healthcare. Its SMART health plan services enables companies to provide better healthcare to employees and significantly reduce administration, reinsurance and care costs. The company was founded in January 2021 and is headquartered in Tampa, FL. |
| Insider Trading |
Relationship |
Date |
Transaction |
Cost |
#Shares |
Value ($) |
#Shares Total |
SEC Form 4 |
| PONS ROBERT M | Director | May 16 '24 | Buy | 2.10 | 5,000 | 10,500 | 79,200 | May 20 04:01 PM | | Lamendola Damien | Chief Executive Officer | May 10 '24 | Buy | 2.49 | 10,000 | 24,899 | 210,000 | May 14 04:01 PM | | EITAN YARON | Director | May 10 '24 | Buy | 2.66 | 5,000 | 13,300 | 606,454 | May 14 04:01 PM | | Dendy Michael Charles | Director | May 10 '24 | Sale | 2.32 | 42,752 | 99,065 | 61,098 | May 14 04:01 PM | | Dendy Michael Charles | Director | May 10 '24 | Sale | 2.40 | 2,371 | 5,701 | 17,629 | May 14 04:01 PM |
|
|
|
