 |
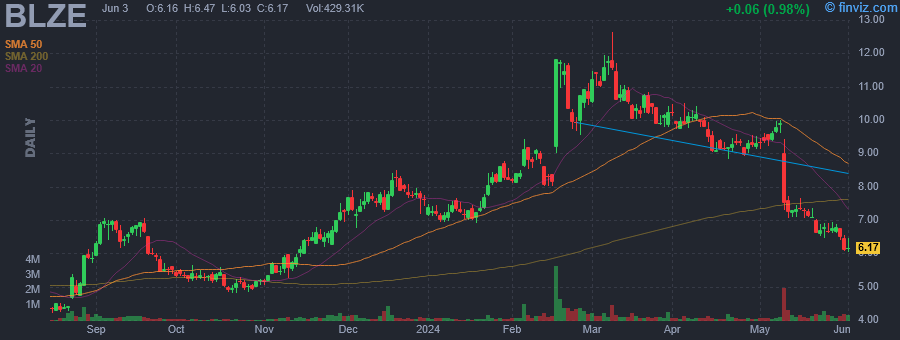
| Market Cap | 276.81M | EPS (ttm) | -1.42 |
| P/E | - | EPS this Y | 43.37% |
| Forward P/E | - | EPS next Y | 29.88% |
| PEG | - | EPS past 5Y | -166.45% |
| P/S | 2.55 | EPS next 5Y | - |
| P/B | 5.83 | EPS Q/Q | 45.53% |
| Dividend | - | Sales Q/Q | 28.10% |
| Insider Own | 33.04% | Inst Own | 35.26% |
| Insider Trans | -2.85% | Inst Trans | 7.68% |
| Short Float | 4.22% | Earnings | May 08/a |
| Analyst Recom | 1.20 | Target Price | 13.08 |
| Avg Volume | 350.95K | 52W Range | 3.50 - 12.65 |
|
|
|
|
Backblaze, Inc. operates as a cloud provider for businesses and consumers to store, use, and protect their data. The firm, through its storage cloud platform, provides a foundation for businesses, developers, IT professionals, and individuals to store, backup, and archive data, host content, manage media, and build their applications. It also offers B2 Cloud Storage and Computer Backup services. The company was founded by Timothy Nufire, Gleb Budman, Charles Jones, Kwok Hang Ng and Brian Wilson in 2007 and is headquartered in San Mateo, CA. |
| Insider Trading |
Relationship |
Date |
Transaction |
Cost |
#Shares |
Value ($) |
#Shares Total |
SEC Form 4 |
| Cessna Tina | Senior VP, Engineering | May 23 '24 | Sale | 6.64 | 2,715 | 18,028 | 113,895 | May 23 09:01 PM | | Patchel Francis P | Chief Financial Officer | May 23 '24 | Sale | 6.64 | 2,647 | 17,576 | 172,981 | May 23 09:02 PM | | Cessna Tina | Senior VP, Engineering | May 22 '24 | Sale | 6.72 | 2,261 | 15,194 | 116,610 | May 23 09:01 PM | | Patchel Francis P | Chief Financial Officer | May 22 '24 | Sale | 6.72 | 2,204 | 14,811 | 175,628 | May 23 09:02 PM | | Cessna Tina | Senior VP, Engineering | May 21 '24 | Sale | 6.75 | 2,212 | 14,931 | 118,871 | May 23 09:01 PM |
|
|
 |
 |
| Market Cap | 40.59M | EPS (ttm) | -2.82 |
| P/E | - | EPS this Y | 25.10% |
| Forward P/E | - | EPS next Y | 84.54% |
| PEG | - | EPS past 5Y | 52.11% |
| P/S | 2.27 | EPS next 5Y | - |
| P/B | 1.00 | EPS Q/Q | -43.76% |
| Dividend | - | Sales Q/Q | 329.51% |
| Insider Own | 21.03% | Inst Own | 3.23% |
| Insider Trans | -0.09% | Inst Trans | -31.33% |
| Short Float | 3.12% | Earnings | May 15/b |
| Analyst Recom | 1.00 | Target Price | 5.30 |
| Avg Volume | 57.04K | 52W Range | 3.90 - 9.10 |
|
|
|
|
ReWalk Robotics Ltd. Is a medical device company, which engages in the design, development and marketing of wearable robotic exoskeletons. The firm's exoskeletons provide hip and knee motion to enable individuals with spinal cord injury (SCI) to stand upright, walk, turn, and climb and descend stairs. Its products include ReWalk Exo-Suit and ReWalk Personal 6.0. The company was founded by Amit Goffer on June 20, 2001 and is headquartered in Yokneam Ilit, Israel. |
| Insider Trading |
Relationship |
Date |
Transaction |
Cost |
#Shares |
Value ($) |
#Shares Total |
SEC Form 4 |
| Jasinski Lawrence J | Chief Executive Officer | May 21 '24 | Sale | 4.91 | 1,620 | 7,954 | 109,440 | May 23 08:24 PM | | Lind Global Fund II LP | 10% Owner | Nov 20 '23 | Buy | 0.73 | 12,000 | 8,760 | 10,017,745 | Nov 21 04:37 PM | | Lind Global Fund II LP | 10% Owner | Nov 17 '23 | Buy | 0.73 | 42,917 | 31,329 | 10,005,745 | Nov 21 04:37 PM | | Lind Global Fund II LP | 10% Owner | Nov 14 '23 | Buy | 0.68 | 72,818 | 49,516 | 9,962,828 | Nov 16 04:37 PM | | Lind Global Fund II LP | 10% Owner | Sep 26 '23 | Buy | 0.70 | 5,031,200 | 3,521,840 | 9,890,010 | Sep 28 04:30 PM |
|
|
|
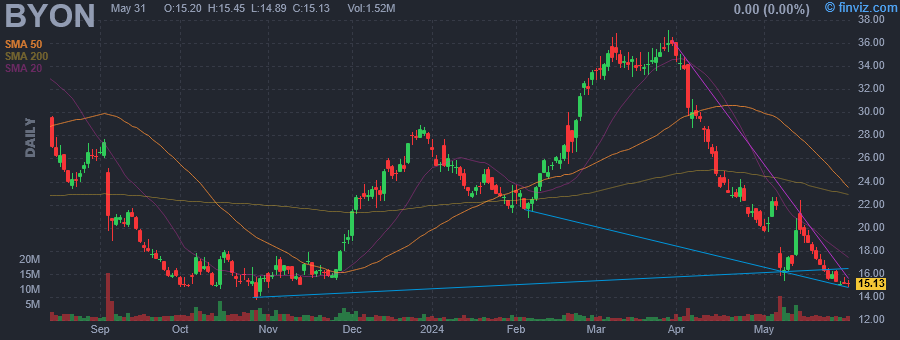 |
| Market Cap | 730.01M | EPS (ttm) | -8.19 |
| P/E | - | EPS this Y | -41.45% |
| Forward P/E | - | EPS next Y | 79.09% |
| PEG | - | EPS past 5Y | 0.08% |
| P/S | 0.47 | EPS next 5Y | - |
| P/B | 2.54 | EPS Q/Q | -609.09% |
| Dividend | - | Sales Q/Q | 0.30% |
| Insider Own | 1.37% | Inst Own | 68.41% |
| Insider Trans | 2.16% | Inst Trans | -11.63% |
| Short Float | 7.11% | Earnings | May 06/a |
| Analyst Recom | 2.50 | Target Price | 26.43 |
| Avg Volume | 1.87M | 52W Range | 13.71 - 39.27 |
|
|
|
|
Beyond, Inc. engages in the provision of an e-commerce platform. It offers furniture and home furnishing products and services. The company was founded on May 5, 1997 and is headquartered in Midvale, UT. |
| Insider Trading |
Relationship |
Date |
Transaction |
Cost |
#Shares |
Value ($) |
#Shares Total |
SEC Form 4 |
| Burkey Joanna Catherine | Director | May 22 '24 | Sale | 16.73 | 610 | 10,205 | 5,372 | May 23 08:09 PM | | Burkey Joanna Catherine | Director | May 21 '24 | Option Exercise | 0.00 | 1,650 | 0 | 5,982 | May 23 08:09 PM | | Nettles William Benjamin JR | Director | May 21 '24 | Option Exercise | 0.00 | 1,650 | 0 | 21,780 | May 23 08:11 PM | | Corbus Barclay F | Director | May 21 '24 | Option Exercise | 0.00 | 1,650 | 0 | 61,668 | May 23 08:13 PM | | Shapiro Robert Jacob | Director | May 21 '24 | Option Exercise | 0.00 | 1,650 | 0 | 26,728 | May 23 09:05 PM |
|
|
| |
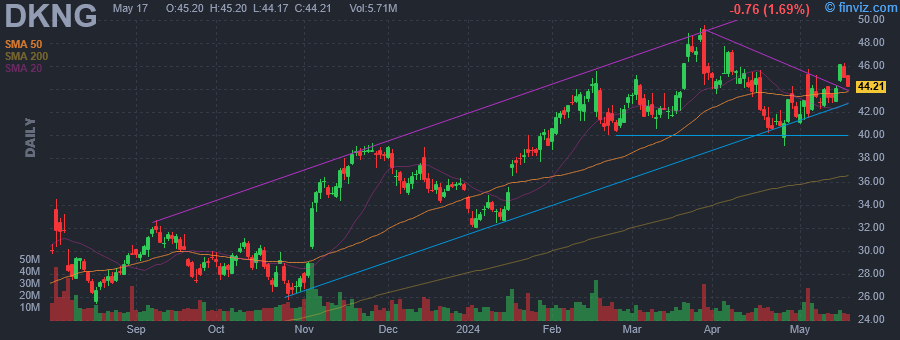 |
| Market Cap | 19.43B | EPS (ttm) | -1.17 |
| P/E | - | EPS this Y | 91.53% |
| Forward P/E | 48.77 | EPS next Y | 671.23% |
| PEG | - | EPS past 5Y | -22.37% |
| P/S | 4.77 | EPS next 5Y | - |
| P/B | 23.38 | EPS Q/Q | 65.56% |
| Dividend | - | Sales Q/Q | 52.67% |
| Insider Own | 4.10% | Inst Own | 71.99% |
| Insider Trans | -22.01% | Inst Trans | 1.98% |
| Short Float | 4.10% | Earnings | May 02/a |
| Analyst Recom | 1.55 | Target Price | 52.51 |
| Avg Volume | 9.97M | 52W Range | 22.92 - 49.57 |
|
|
|
|
DraftKings, Inc. is a digital sports entertainment and gaming company, which engages in the provision of online sports betting, online casino, daily fantasy sports product offerings, DraftKings Marketplace, retail sportsbook, media, and other consumer product offerings. It operates through the following segments: Business-to-Consumer (B2C) and Business-to-Business (B2B). The Business-to-Consumer segment includes sportsbook, iGaming and DFS product offerings, as well as media and other consumer product offerings. The Business-to-Business segment includes design and development of gaming software. The company was founded by Jason D. Robins, Matthew Kalish, and Paul Liberman on December 31, 2011 and is headquartered in Boston, MA. |
| Insider Trading |
Relationship |
Date |
Transaction |
Cost |
#Shares |
Value ($) |
#Shares Total |
SEC Form 4 |
| Robins Jason | See Remarks | May 21 '24 | Sale | 43.59 | 200,000 | 8,718,375 | 2,668,954 | May 23 08:03 PM | | Kalish Matthew | See Remarks | May 08 '24 | Option Exercise | 4.70 | 21,302 | 100,119 | 3,437,638 | May 10 08:03 PM | | Robins Jason | See Remarks | May 08 '24 | Sale | 42.67 | 200,000 | 8,534,000 | 2,849,215 | May 10 08:02 PM | | Robins Jason | See Remarks | Apr 22 '24 | Sale | 40.91 | 200,000 | 8,182,006 | 3,043,231 | Apr 24 08:01 PM | | Robins Jason | See Remarks | Feb 21 '24 | Sale | 40.89 | 200,000 | 8,178,308 | 3,195,812 | Feb 23 08:04 PM |
|
|
|
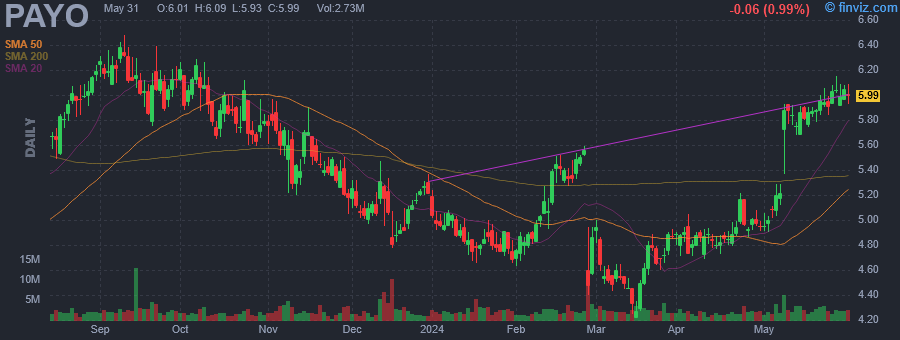 |
| Market Cap | 2.25B | EPS (ttm) | 0.30 |
| P/E | 20.19 | EPS this Y | -7.29% |
| Forward P/E | 19.68 | EPS next Y | 37.70% |
| PEG | - | EPS past 5Y | - |
| P/S | 2.60 | EPS next 5Y | - |
| P/B | 3.24 | EPS Q/Q | 275.00% |
| Dividend | - | Sales Q/Q | 18.84% |
| Insider Own | 22.98% | Inst Own | 63.04% |
| Insider Trans | -2.80% | Inst Trans | 1.61% |
| Short Float | 4.35% | Earnings | May 08/b |
| Analyst Recom | 1.00 | Target Price | 7.50 |
| Avg Volume | 2.67M | 52W Range | 4.02 - 6.48 |
|
|
|
|
Payoneer Global, Inc. is a financial technology company, which engages in providing a financial platform for small and medium-sized businesses to transact and do business. It operates through the Israel, United States, and All Other Countries geographical segments. The company was founded in 2005 and is headquartered in New York, NY. |
| Insider Trading |
Relationship |
Date |
Transaction |
Cost |
#Shares |
Value ($) |
#Shares Total |
SEC Form 4 |
| Perry Itai | Chief Accounting Officer | May 21 '24 | Option Exercise | 2.90 | 6,000 | 17,400 | 239,639 | May 23 08:01 PM | | Perry Itai | Chief Accounting Officer | May 21 '24 | Sale | 6.00 | 6,000 | 36,000 | 233,639 | May 23 08:01 PM | | Zeevi Avi | Director | May 15 '24 | Sale | 5.90 | 2,471 | 14,580 | 427,584 | May 16 08:29 PM | | Zeevi Avi | Director | May 14 '24 | Sale | 5.90 | 23,793 | 140,433 | 430,055 | May 16 08:29 PM | | Zeevi Avi | Director | May 10 '24 | Sale | 5.90 | 29,354 | 173,247 | 453,848 | May 13 05:00 PM |
|
|
| |
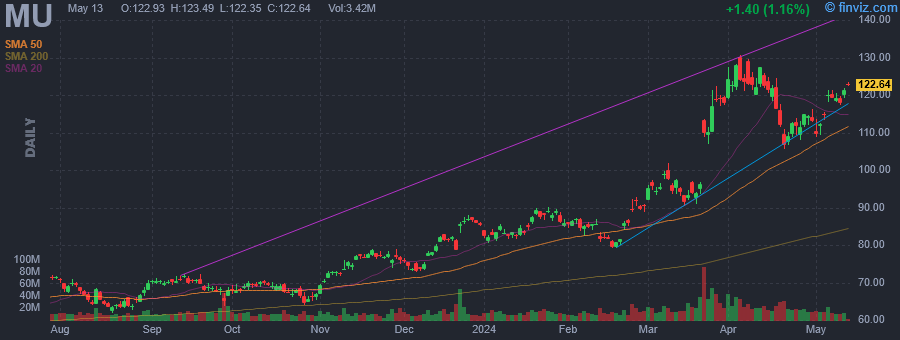 |
| Market Cap | 143.39B | EPS (ttm) | -3.45 |
| P/E | - | EPS this Y | 118.97% |
| Forward P/E | 16.24 | EPS next Y | 844.54% |
| PEG | - | EPS past 5Y | - |
| P/S | 7.83 | EPS next 5Y | -2.62% |
| P/B | 3.27 | EPS Q/Q | 133.59% |
| Dividend | 0.36% | Sales Q/Q | 57.70% |
| Insider Own | 0.49% | Inst Own | 82.01% |
| Insider Trans | -12.72% | Inst Trans | -1.27% |
| Short Float | 2.41% | Earnings | Mar 20/a |
| Analyst Recom | 1.44 | Target Price | 141.93 |
| Avg Volume | 23.07M | 52W Range | 60.50 - 131.95 |
|
|
|
|
Micron Technology, Inc. engages in the provision of innovative memory and storage solutions. It operates through the following segments: Compute and Networking Business Unit (CNBU), Mobile Business Unit (MBU), Embedded Business Unit (EBU), and Storage Business Unit (SBU). The CNBU segment includes memory products and solutions sold into client, cloud server, enterprise, graphics, and networking markets. The MBU segment is involved in memory and storage products sold into smartphone and other mobile-device markets. The EBU segment focuses on memory and storage products sold into automotive, industrial, and consumer Markets. The SBU segment consists of SSDs and component-level solutions sold into enterprise and cloud, client, and consumer storage markets. The company was founded by Ward D. Parkinson, Joseph Leon Parkinson, Dennis Wilson, and Doug Pitman on October 5, 1978 and is headquartered in Boise, ID. |
| Insider Trading |
Relationship |
Date |
Transaction |
Cost |
#Shares |
Value ($) |
#Shares Total |
SEC Form 4 |
| MEHROTRA SANJAY | CEO and President | May 21 '24 | Option Exercise | 28.20 | 7,000 | 197,400 | 726,049 | May 23 07:58 PM | | MEHROTRA SANJAY | CEO and President | May 21 '24 | Sale | 127.66 | 7,000 | 893,618 | 719,049 | May 23 07:58 PM | | MEHROTRA SANJAY | CEO and President | May 14 '24 | Option Exercise | 28.20 | 7,000 | 197,400 | 726,049 | May 16 07:03 PM | | Bokan Michael W | SVP, Worldwide Sales | May 14 '24 | Sale | 123.42 | 15,000 | 1,851,300 | 138,387 | May 16 07:03 PM | | MEHROTRA SANJAY | CEO and President | May 14 '24 | Sale | 122.89 | 7,000 | 860,209 | 719,049 | May 16 07:03 PM |
|
|
|
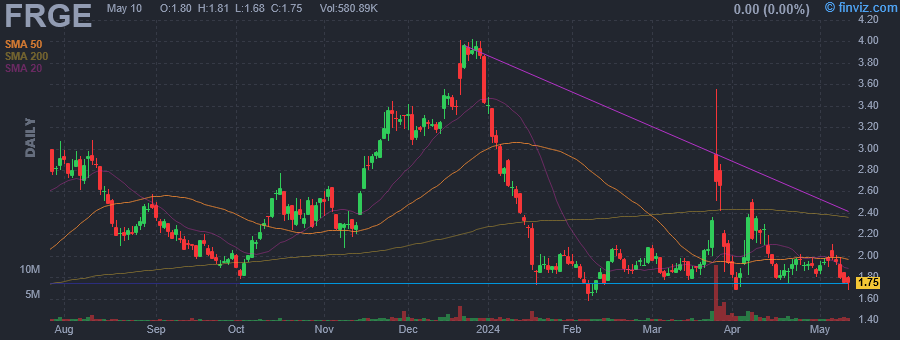 |
| Market Cap | 309.58M | EPS (ttm) | -0.50 |
| P/E | - | EPS this Y | 21.25% |
| Forward P/E | - | EPS next Y | 24.06% |
| PEG | - | EPS past 5Y | - |
| P/S | 4.21 | EPS next 5Y | - |
| P/B | 1.22 | EPS Q/Q | 16.06% |
| Dividend | - | Sales Q/Q | 24.31% |
| Insider Own | 41.89% | Inst Own | 26.84% |
| Insider Trans | -0.50% | Inst Trans | 14.43% |
| Short Float | 4.43% | Earnings | May 07/a |
| Analyst Recom | 2.33 | Target Price | 3.88 |
| Avg Volume | 846.66K | 52W Range | 1.23 - 4.02 |
|
|
|
|
Forge Global Holdings, Inc. engages in providing marketplace infrastructure, data services, and technology solutions for private market participants. It also offers a financial services platform, proprietary data, and insights to inform investment strategies. The company was founded in 2014 and is headquartered in San Francisco, CA. |
| Insider Trading |
Relationship |
Date |
Transaction |
Cost |
#Shares |
Value ($) |
#Shares Total |
SEC Form 4 |
| Rodriques Kelly | Chief Executive Officer | May 23 '24 | Sale | 1.73 | 26,238 | 45,352 | 10,284,336 | May 23 07:57 PM | | Rodriques Kelly | Chief Executive Officer | May 22 '24 | Sale | 1.81 | 33,762 | 61,116 | 10,310,574 | May 23 07:57 PM | | Rodriques Kelly | Chief Executive Officer | May 02 '24 | Sale | 1.93 | 14,254 | 27,539 | 10,387,708 | May 02 08:59 PM | | Rodriques Kelly | Chief Executive Officer | May 01 '24 | Sale | 1.88 | 35,746 | 67,328 | 10,401,962 | May 02 08:59 PM | | Rodriques Kelly | Chief Executive Officer | Apr 16 '24 | Sale | 1.84 | 20,803 | 38,194 | 10,437,708 | Apr 18 05:57 PM |
|
|
| |
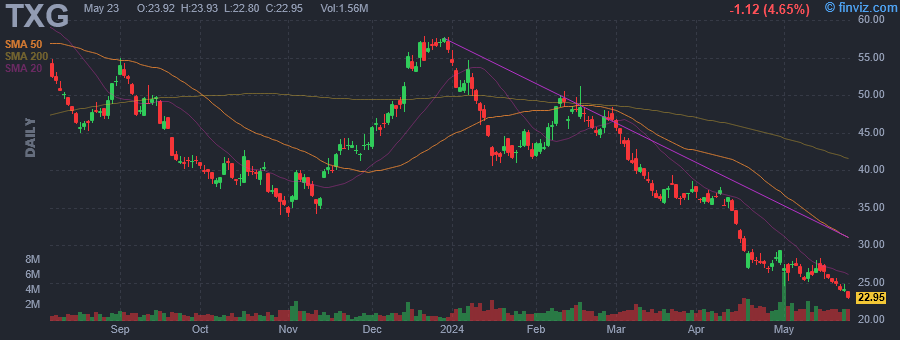 |
| Market Cap | 2.70B | EPS (ttm) | -2.24 |
| P/E | - | EPS this Y | 26.26% |
| Forward P/E | - | EPS next Y | 37.44% |
| PEG | - | EPS past 5Y | -13.04% |
| P/S | 4.32 | EPS next 5Y | - |
| P/B | 3.76 | EPS Q/Q | -14.40% |
| Dividend | - | Sales Q/Q | 5.01% |
| Insider Own | 17.68% | Inst Own | 83.49% |
| Insider Trans | -0.24% | Inst Trans | -0.99% |
| Short Float | 10.41% | Earnings | Apr 30/a |
| Analyst Recom | 1.88 | Target Price | 40.69 |
| Avg Volume | 1.61M | 52W Range | 22.80 - 63.57 |
|
|
|
|
10X Genomics, Inc. is a life science technology company, which engages in building products to interrogate, understand and master biology. Its integrated solutions include single cell transcriptomics, single cell genomics, single cell epigenomes, linked-reads genomics and spatial transcriptomics. The company's products include Single Cell Gene Expression, Immune Profiling, ATAC, and Genome. The company was founded by Serge Saxonov, Ben Hindson and Kevin D. Ness on July 2, 2012 and is headquartered in Pleasanton, CA. |
| Insider Trading |
Relationship |
Date |
Transaction |
Cost |
#Shares |
Value ($) |
#Shares Total |
SEC Form 4 |
| Saxonov Serge | Chief Executive Officer | May 22 '24 | Sale | 24.30 | 4,877 | 118,529 | 889,641 | May 23 07:53 PM | | Hindson Benjamin J. | See Remarks | May 22 '24 | Sale | 24.30 | 4,087 | 99,329 | 350,055 | May 23 07:52 PM | | McAnear Justin J. | Chief Financial Officer | May 22 '24 | Sale | 24.30 | 2,936 | 71,355 | 146,203 | May 23 07:54 PM | | Saxonov Serge | Chief Executive Officer | Mar 04 '24 | Sale | 44.00 | 4,660 | 205,021 | 842,900 | Mar 06 04:12 PM | | Saxonov Serge | Chief Executive Officer | Feb 22 '24 | Sale | 46.34 | 2,821 | 130,737 | 847,560 | Feb 26 04:13 PM |
|
|
|
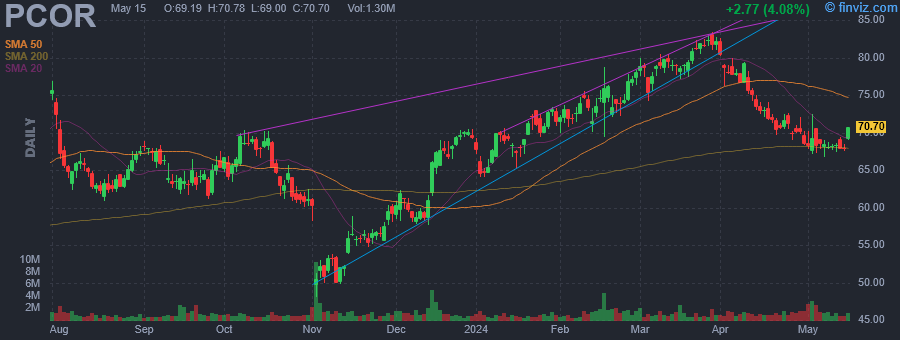 |
| Market Cap | 10.06B | EPS (ttm) | -0.96 |
| P/E | - | EPS this Y | 194.31% |
| Forward P/E | 60.65 | EPS next Y | 28.38% |
| PEG | - | EPS past 5Y | -19.72% |
| P/S | 10.00 | EPS next 5Y | 75.90% |
| P/B | 8.42 | EPS Q/Q | 83.40% |
| Dividend | - | Sales Q/Q | 26.18% |
| Insider Own | 8.47% | Inst Own | 80.23% |
| Insider Trans | -8.42% | Inst Trans | 3.09% |
| Short Float | 3.80% | Earnings | May 01/a |
| Analyst Recom | 1.56 | Target Price | 82.81 |
| Avg Volume | 1.31M | 52W Range | 48.11 - 83.35 |
|
|
|
|
Procore Technologies, Inc. engages in the development of cloud-based construction management software. The company was founded by Craig F. Courtemanche, Jr. and Steven C. Zahm in 2002 and is headquartered in Carpinteria, CA. |
| Insider Trading |
Relationship |
Date |
Transaction |
Cost |
#Shares |
Value ($) |
#Shares Total |
SEC Form 4 |
| O CONNOR KEVIN J | Director | May 23 '24 | Sale | 69.43 | 5,128 | 356,037 | 1,478,927 | May 23 07:45 PM | | O CONNOR KEVIN J | Director | May 22 '24 | Sale | 70.21 | 5,128 | 360,037 | 1,484,055 | May 23 07:45 PM | | O CONNOR KEVIN J | Director | May 21 '24 | Sale | 70.29 | 5,128 | 360,447 | 1,489,183 | May 23 07:45 PM | | Courtemanche Craig F. Jr. | CEO & President | May 01 '24 | Sale | 68.97 | 68,000 | 4,690,024 | 530,049 | May 03 04:35 PM | | Singer Benjamin C | Chief Legal Officer; Secretary | May 01 '24 | Sale | 69.05 | 3,000 | 207,160 | 122,321 | May 03 04:36 PM |
|
|
|
 |
| Market Cap | 2.93B | EPS (ttm) | 2.64 |
| P/E | 20.67 | EPS this Y | 9.03% |
| Forward P/E | 15.08 | EPS next Y | 16.68% |
| PEG | 2.07 | EPS past 5Y | 9.19% |
| P/S | 0.50 | EPS next 5Y | 10.00% |
| P/B | 2.35 | EPS Q/Q | 1332.51% |
| Dividend | 0.44% | Sales Q/Q | 12.40% |
| Insider Own | 1.22% | Inst Own | 93.87% |
| Insider Trans | -19.96% | Inst Trans | -3.71% |
| Short Float | 1.93% | Earnings | May 08/a |
| Analyst Recom | 1.33 | Target Price | 58.83 |
| Avg Volume | 567.63K | 52W Range | 26.29 - 53.68 |
|
|
|
|
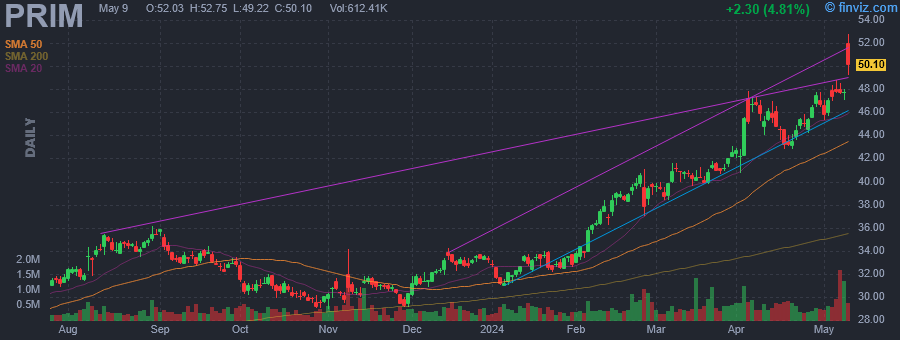
Primoris Services Corp. is a holding company, which engages in the provision of construction, fabrication, maintenance, replacement, and engineering services. It operates through the following segments: Utilities, Energy and Renewables, and Pipeline. The Utilities segment specializes in a range of services, including telecommunications and installation and maintenance of new and existing natural gas and electric utility distribution and transmission systems. The Energy and Renewables segment focuses on the engineering, procurement, and construction, retrofits, highway and bridge construction, demolition, site work, soil stabilization, mass excavation, flood control, upgrades, repairs, outages, and maintenance services for entities in the renewable energy and energy storage, renewable fuels, and petroleum and petrochemical industries, as well as state departments of transportation. The Pipeline segment offers pipeline construction and maintenance, pipeline facility and integrity services, installation of compressor and pump stations, and metering facilities for entities in the petroleum and petrochemical industries, as well as gas, water, and sewer utilities. The company was founded by Brian Patt in 1960 and is headquartered in Dallas, TX. |
| Insider Trading |
Relationship |
Date |
Transaction |
Cost |
#Shares |
Value ($) |
#Shares Total |
SEC Form 4 |
| Schauerman John P. | Director | May 23 '24 | Sale | 53.20 | 5,000 | 266,023 | 187,281 | May 23 07:32 PM | | Schauerman John P. | Director | May 22 '24 | Sale | 52.91 | 10,000 | 529,083 | 192,281 | May 23 07:32 PM | | Schauerman John P. | Director | May 20 '24 | Sale | 51.92 | 15,000 | 778,857 | 202,281 | May 21 08:00 PM | | Perisich John M. | CHIEF LEGAL AND ADMIN OFFICER | May 13 '24 | Sale | 49.34 | 13,448 | 663,461 | 0 | May 14 06:50 PM | | McCormick Thomas Edward | CEO & PRESIDENT | May 10 '24 | Sale | 49.47 | 10,000 | 494,669 | 60,961 | May 13 06:40 PM |
|
|
|
