 |
| Market Cap | 34.08B | EPS (ttm) | 10.05 |
| P/E | 43.68 | EPS this Y | 2.32% |
| Forward P/E | 33.98 | EPS next Y | 11.44% |
| PEG | 4.16 | EPS past 5Y | 52.81% |
| P/S | 5.71 | EPS next 5Y | 10.50% |
| P/B | 47.81 | EPS Q/Q | -27.63% |
| Dividend | - | Sales Q/Q | 4.55% |
| Insider Own | 3.11% | Inst Own | 92.96% |
| Insider Trans | -2.78% | Inst Trans | 0.26% |
| Short Float | 1.48% | Earnings | Apr 30/b |
| Analyst Recom | 2.38 | Target Price | 476.64 |
| Avg Volume | 375.51K | 52W Range | 323.61 - 486.54 |
|
|
|
|
Gartner, Inc. is a research and advisory company, which equips business leaders with insights, advice, and tools that help build organizations. It operates through the following segments: Research, Consulting, and Conferences. The Research segment equips executives and teams from every function and across all industries with actionable, objective insight, guidance, and tools. The Consulting segment serves senior executives technology-driven strategic initiatives leveraging the power of Gartner's actionable, objective insight. The Conferences segment offers executives and teams across an organization the opportunity to learn, share, and network. The company was founded by Gideon I. Gartner and Dave L. R. Stein in 1979 and is headquartered in Stamford, CT. |
| Insider Trading |
Relationship |
Date |
Transaction |
Cost |
#Shares |
Value ($) |
#Shares Total |
SEC Form 4 |
| Dawkins Alwyn | EVP, Global Business Sales | May 22 '24 | Sale | 454.57 | 800 | 363,656 | 50,783 | May 24 04:11 PM | | SMITH JAMES C | Director | May 20 '24 | Sale | 455.20 | 10,000 | 4,551,984 | 608,369 | May 22 05:02 PM | | Genovese Yvonne | EVP, Global Product Management | May 20 '24 | Sale | 456.13 | 439 | 200,241 | 1,959 | May 22 04:59 PM | | Dawkins Alwyn | EVP, Global Business Sales | May 16 '24 | Sale | 447.63 | 600 | 268,578 | 51,583 | May 23 05:14 PM | | Kim Thomas Sang | EVP, GC | May 04 '24 | Option Exercise | 0.00 | 1,130 | 0 | 1,130 | May 07 05:33 PM |
|
|
 |
 |
| Market Cap | 12.10B | EPS (ttm) | 9.82 |
| P/E | 39.79 | EPS this Y | 26.31% |
| Forward P/E | 29.63 | EPS next Y | 17.52% |
| PEG | 2.22 | EPS past 5Y | 35.06% |
| P/S | 6.16 | EPS next 5Y | 17.91% |
| P/B | 17.98 | EPS Q/Q | 41.45% |
| Dividend | - | Sales Q/Q | 17.73% |
| Insider Own | 17.72% | Inst Own | 83.68% |
| Insider Trans | -28.11% | Inst Trans | -1.64% |
| Short Float | 3.70% | Earnings | Apr 22/a |
| Analyst Recom | 2.12 | Target Price | 447.05 |
| Avg Volume | 237.22K | 52W Range | 197.39 - 421.00 |
|
|
|
May-17-24 04:17PM
|
Medpace Holdings Insider Sold Shares Worth $15,924,222, According to a Recent SEC Filing
(MT Newswires) |
|
May-14-24 04:25PM
|
Medpace Holdings Insider Sold Shares Worth $1,996,723, According to a Recent SEC Filing
(MT Newswires) |
|
May-13-24 12:45PM
|
3 Reasons Why Growth Investors Shouldn't Overlook Medpace (MEDP)
(Zacks) |
|
May-10-24 09:40AM
|
Are Medical Stocks Lagging Medpace (MEDP) This Year?
(Zacks) |
|
08:58AM
|
Medpace Holdings (MEDP) Rose as it Reported Strong Matrices
(Insider Monkey) |
|
May-09-24 09:00AM
|
Medpace Holdings, Inc. (MEDP) Is a Trending Stock: Facts to Know Before Betting on It
(Zacks) |
|
May-08-24 04:54PM
|
Medpace Holdings Insider Sold Shares Worth $21,129,347, According to a Recent SEC Filing
(MT Newswires) |
|
May-03-24 04:13PM
|
Medpace Holdings Insider Sold Shares Worth $6,553,671, According to a Recent SEC Filing
(MT Newswires) |
|
09:30AM
|
Brokers Suggest Investing in Medpace (MEDP): Read This Before Placing a Bet
(Zacks) |
|
May-01-24 04:59PM
|
Medpace Holdings Insider Sold Shares Worth $6,782,987, According to a Recent SEC Filing
(MT Newswires) |
|
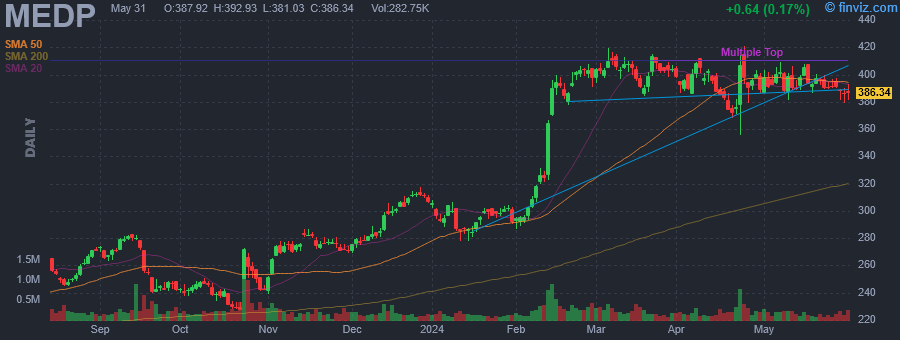
Medpace Holdings, Inc. engages in the provision of outsourced clinical development services to the biotechnology, pharmaceutical and medical device industries. Its services include medical department, clinical trial management, data-driven feasibility, study-start-up, clinical monitoring, regulatory affairs, patient recruitment and retention, medical writing, biometrics and data sciences, pharmacovigilance, core laboratory, laboratories, clinics, and quality assurance. The company was founded by August James Troendle in 1992 and is headquartered in Cincinnati, OH. |
| Insider Trading |
Relationship |
Date |
Transaction |
Cost |
#Shares |
Value ($) |
#Shares Total |
SEC Form 4 |
| Troendle August J. | CEO | May 22 '24 | Sale | 400.00 | 55 | 22,000 | 664,338 | May 24 04:10 PM | | Troendle August J. | CEO | May 20 '24 | Sale | 400.19 | 4,020 | 1,608,764 | 664,393 | May 22 04:20 PM | | Troendle August J. | CEO | May 16 '24 | Sale | 403.09 | 7,060 | 2,845,815 | 668,413 | May 17 04:12 PM | | Troendle August J. | CEO | May 15 '24 | Sale | 405.13 | 32,282 | 13,078,407 | 675,473 | May 17 04:12 PM | | Troendle August J. | CEO | May 10 '24 | Sale | 402.89 | 4,956 | 1,996,723 | 707,755 | May 14 04:11 PM |
|
|
|
 |
| Market Cap | 3.44B | EPS (ttm) | 4.80 |
| P/E | 23.58 | EPS this Y | -0.69% |
| Forward P/E | 19.50 | EPS next Y | 21.76% |
| PEG | 8.73 | EPS past 5Y | 28.81% |
| P/S | 2.07 | EPS next 5Y | 2.70% |
| P/B | 3.64 | EPS Q/Q | -37.36% |
| Dividend | - | Sales Q/Q | -8.74% |
| Insider Own | 1.27% | Inst Own | 128.38% |
| Insider Trans | -11.29% | Inst Trans | 2.49% |
| Short Float | 12.71% | Earnings | May 14/a |
| Analyst Recom | 1.29 | Target Price | 118.67 |
| Avg Volume | 753.79K | 52W Range | 64.56 - 115.97 |
|
|
|
|
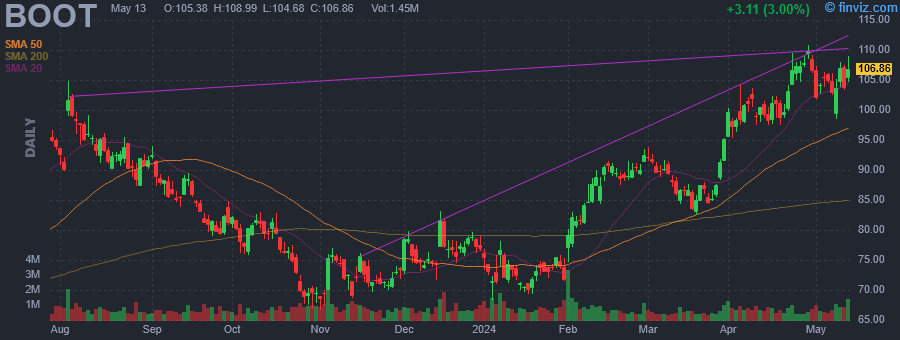
Boot Barn Holdings, Inc. engages in the operation of retail stores of western and work-related footwear, apparel, and accessories. The firm's products include boots, jeans, accessories, hats, gifts and home products, and work wear. Its brands include Ariat, Wrangler, Lucchese Boots, Idyllwind, and Cinch. The company was founded by Kenneth Meany in 1978 and is headquartered in Irvine, CA. |
| Insider Trading |
Relationship |
Date |
Transaction |
Cost |
#Shares |
Value ($) |
#Shares Total |
SEC Form 4 |
| MACDONALD ANNE | Director | May 23 '24 | Sale | 111.81 | 1,956 | 218,700 | 1,698 | May 24 04:10 PM | | Morris Brenda I | Director | May 23 '24 | Sale | 110.11 | 1,500 | 165,165 | 4,546 | May 24 04:10 PM | | Love Michael A | CHIEF RETAIL OFFICER | May 23 '24 | Sale | 110.21 | 1,079 | 118,917 | 2,112 | May 24 04:10 PM | | Love Michael A | CHIEF RETAIL OFFICER | May 21 '24 | Sale | 113.61 | 5,653 | 642,237 | 2,327 | May 22 07:00 PM | | Hazen John | CHIEF DIGITAL OFFICER | May 17 '24 | Sale | 113.21 | 3,563 | 403,367 | 1,309 | May 20 09:00 PM |
|
|
| |
 |
| Market Cap | 82.43M | EPS (ttm) | -10.83 |
| P/E | - | EPS this Y | 19.81% |
| Forward P/E | - | EPS next Y | 4.38% |
| PEG | - | EPS past 5Y | 22.47% |
| P/S | 6.37 | EPS next 5Y | 17.00% |
| P/B | 2.52 | EPS Q/Q | 62.87% |
| Dividend | - | Sales Q/Q | - |
| Insider Own | 33.66% | Inst Own | 11.75% |
| Insider Trans | 52.33% | Inst Trans | -26.62% |
| Short Float | 0.68% | Earnings | May 08/a |
| Analyst Recom | 2.00 | Target Price | 36.00 |
| Avg Volume | 19.60K | 52W Range | 7.69 - 20.04 |
|
|
|
|
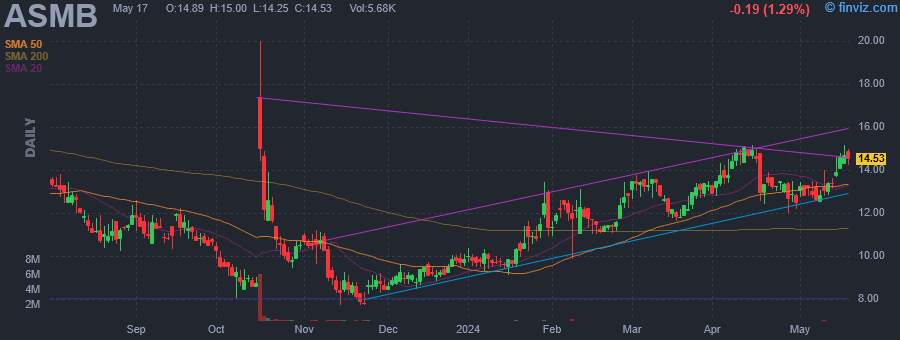
Assembly Biosciences, Inc. is a biotechnology company, which engages in the development of products for infectious diseases, such as chronic hepatitis B virus and illnesses associated with a dysbiotic microbiome. It focuses on two innovative platform programs: oral therapeutics for the treatment of hepatitis B virus, and the oral synthetic live biotherapeutics candidate. The company was founded by Uri Lopatin and Derek A. Small on October 7, 2005 and is headquartered in South San Francisco, CA. |
| Insider Trading |
Relationship |
Date |
Transaction |
Cost |
#Shares |
Value ($) |
#Shares Total |
SEC Form 4 |
| McHutchison John G | Director | May 23 '24 | Sale | 14.93 | 2,117 | 31,615 | 19,104 | May 24 04:10 PM | | Okazaki Jason A | CEO and President | May 23 '24 | Sale | 14.93 | 549 | 8,199 | 16,082 | May 24 04:05 PM | | White Nicole S | Chief Manufacturing Officer | May 23 '24 | Sale | 14.93 | 172 | 2,569 | 12,853 | May 24 04:05 PM | | Bjorkquist Jeanette M | Principal Accounting Officer | May 23 '24 | Sale | 14.93 | 24 | 358 | 3,142 | May 24 04:10 PM | | Okazaki Jason A | CEO and President | Apr 30 '24 | Sale | 12.71 | 1,569 | 19,937 | 16,423 | May 01 04:05 PM |
|
|
|
 |
| Market Cap | 183.16B | EPS (ttm) | 3.05 |
| P/E | 54.93 | EPS this Y | 82.21% |
| Forward P/E | 32.81 | EPS next Y | 24.91% |
| PEG | 1.99 | EPS past 5Y | - |
| P/S | 2.63 | EPS next 5Y | 27.63% |
| P/B | 6.14 | EPS Q/Q | -79.24% |
| Dividend | 0.53% | Sales Q/Q | 10.83% |
| Insider Own | 0.41% | Inst Own | 76.71% |
| Insider Trans | -2.00% | Inst Trans | -3.25% |
| Short Float | 0.96% | Earnings | Apr 23/b |
| Analyst Recom | 1.37 | Target Price | 185.20 |
| Avg Volume | 8.25M | 52W Range | 79.52 - 170.80 |
|
|
|
|
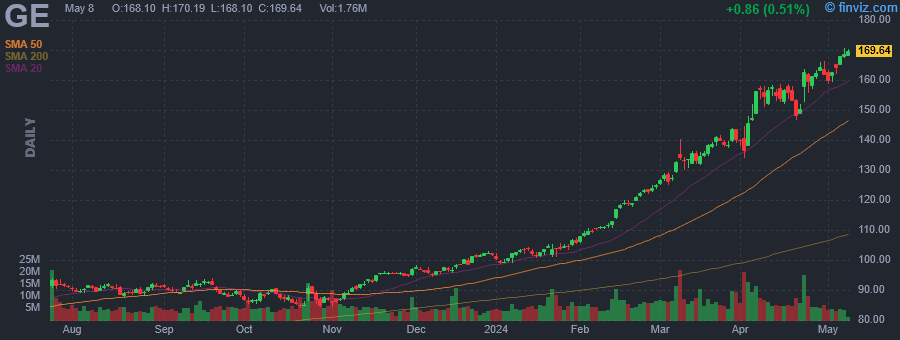
GE Aerospace is an American aircraft company, which provides jet and turboprop engines, as well as integrated systems for commercial, military, business, and general aviation aircraft. Its portfolio of brands includes Avio Aero, Unison, GE Additive and Dowty Propellers. The company was founded by Thomas Alva Edison in 1878 and is headquartered in Cincinnati, OH. |
| Insider Trading |
Relationship |
Date |
Transaction |
Cost |
#Shares |
Value ($) |
#Shares Total |
SEC Form 4 |
| Stokes Russell | Senior Vice President | May 23 '24 | Option Exercise | 128.97 | 50,604 | 6,526,398 | 158,267 | May 24 04:08 PM | | Stokes Russell | Senior Vice President | May 23 '24 | Sale | 162.82 | 45,309 | 7,377,211 | 112,958 | May 24 04:08 PM | | Giglietti Robert M. | Vice President | May 22 '24 | Option Exercise | 128.97 | 5,667 | 730,873 | 11,575 | May 23 04:21 PM | | Giglietti Robert M. | Vice President | May 22 '24 | Sale | 160.19 | 5,127 | 821,294 | 6,448 | May 23 04:21 PM | | Procacci Riccardo | Senior Vice President | May 21 '24 | Option Exercise | 128.97 | 6,073 | 783,235 | 19,609 | May 23 04:21 PM |
|
|
| |
 |
| Market Cap | 39.84B | EPS (ttm) | 10.10 |
| P/E | 19.51 | EPS this Y | -0.03% |
| Forward P/E | 20.12 | EPS next Y | 2.13% |
| PEG | 9.88 | EPS past 5Y | 10.17% |
| P/S | 3.49 | EPS next 5Y | 1.98% |
| P/B | 9.70 | EPS Q/Q | 36.45% |
| Dividend | 2.73% | Sales Q/Q | 8.87% |
| Insider Own | 27.25% | Inst Own | 59.65% |
| Insider Trans | -0.04% | Inst Trans | 0.34% |
| Short Float | 2.49% | Earnings | May 03/b |
| Analyst Recom | 2.81 | Target Price | 207.67 |
| Avg Volume | 2.01M | 52W Range | 178.82 - 263.90 |
|
|
|
|
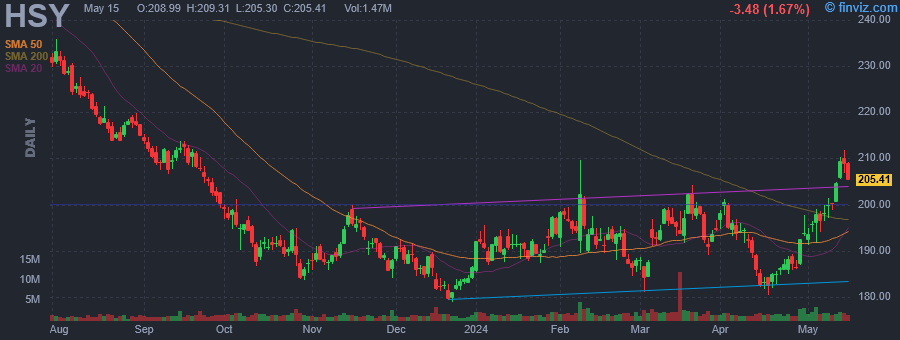
The Hershey Co. engages in the manufacture and marketing of chocolate, sweets, mints and confectionery products. The firm operates through the following geographical segments: North America and International and Other. The North America is responsible for the traditional chocolate and non-chocolate confectionery market position of the company, as well as its grocery and snacks market positions, in the United States and Canada. The International and Other segment includes the combination of all other operating segments, including those geographic regions where the company operates outside of North America. Its brands include Hershey's, Reese's, and Kisses. The company was founded by Milton S. Hershey in 1894 and is headquartered in Hershey, PA. |
| Insider Trading |
Relationship |
Date |
Transaction |
Cost |
#Shares |
Value ($) |
#Shares Total |
SEC Form 4 |
| Voskuil Steven E | SVP, Chief Financial Officer | May 23 '24 | Sale | 204.54 | 1,500 | 306,810 | 37,228 | May 24 04:08 PM | | Raup Charles R | President, U.S. Confection | May 20 '24 | Sale | 207.00 | 2,065 | 427,455 | 24,310 | May 21 04:23 PM | | Voskuil Steven E | SVP, Chief Financial Officer | Apr 23 '24 | Sale | 185.83 | 1,500 | 278,745 | 38,728 | Apr 24 04:21 PM | | Voskuil Steven E | SVP, Chief Financial Officer | Mar 25 '24 | Sale | 197.90 | 1,500 | 296,850 | 40,228 | Mar 26 04:40 PM | | Grover Rohit | President, International | Mar 04 '24 | Sale | 182.99 | 4,200 | 768,578 | 27,161 | Mar 05 04:13 PM |
|
|
|
 |
| Market Cap | 1.71B | EPS (ttm) | -0.21 |
| P/E | - | EPS this Y | 707.02% |
| Forward P/E | 13.29 | EPS next Y | 98.33% |
| PEG | - | EPS past 5Y | - |
| P/S | 1.28 | EPS next 5Y | - |
| P/B | 1.16 | EPS Q/Q | -407.35% |
| Dividend | - | Sales Q/Q | 18.44% |
| Insider Own | 6.39% | Inst Own | 88.71% |
| Insider Trans | -3.25% | Inst Trans | -3.50% |
| Short Float | 2.40% | Earnings | Apr 24/a |
| Analyst Recom | 1.33 | Target Price | 15.40 |
| Avg Volume | 1.66M | 52W Range | 6.18 - 12.14 |
|
|
|
|
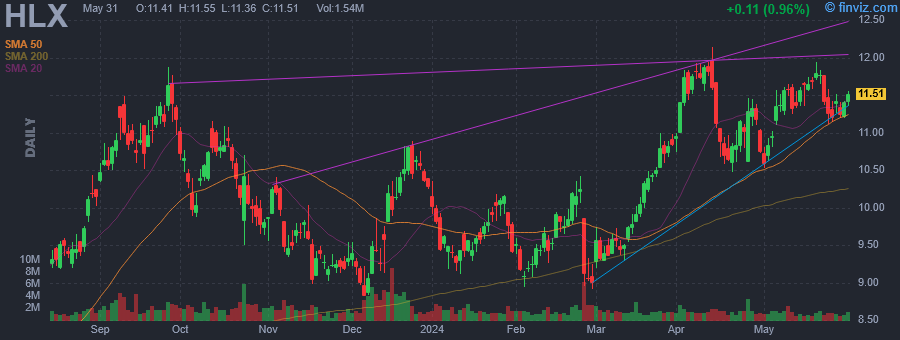
Helix Energy Solutions Group, Inc. is an international offshore energy company. It focuses on subsea construction, maintenance and salvage services to the offshore natural gas and oil industry. The firm also provides specialty services to the offshore energy industry, with a focus on well intervention and robotics operations. The company operates through the following business segments: Well Intervention, Robotics and Production Facilities. The Well Intervention segment offers vessels and related equipment that are used to perform well intervention services primarily in the Gulf of Mexico and North Sea regions. The Robotics segment involves four chartered vessels and also includes ROVs, trenchers and ROVDrills designed to complement offshore construction and well intervention services. The Production Facilities segment includes its investment in the Helix Producer I and Kommandor LLC. The company was founded in 1979 and is headquartered in Houston, TX. |
| Insider Trading |
Relationship |
Date |
Transaction |
Cost |
#Shares |
Value ($) |
#Shares Total |
SEC Form 4 |
| KRATZ OWEN E | PRESIDENT & CEO | May 23 '24 | Sale | 11.50 | 1,050 | 12,075 | 7,470,279 | May 24 04:07 PM | | KRATZ OWEN E | PRESIDENT & CEO | May 22 '24 | Sale | 11.54 | 7,521 | 86,795 | 7,471,329 | May 22 05:43 PM | | KRATZ OWEN E | PRESIDENT & CEO | May 21 '24 | Sale | 11.77 | 164,796 | 1,940,423 | 7,478,850 | May 22 05:43 PM | | KRATZ OWEN E | PRESIDENT & CEO | May 20 '24 | Sale | 11.83 | 141,879 | 1,678,443 | 7,643,646 | May 22 05:43 PM | | Sparks Scott Andrew | EVP & COO | May 07 '24 | Sale | 11.44 | 12,000 | 137,239 | 282,634 | May 08 04:09 PM |
|
|
| |
 |
| Market Cap | 9.92B | EPS (ttm) | 8.21 |
| P/E | 20.79 | EPS this Y | 0.96% |
| Forward P/E | 19.34 | EPS next Y | 12.82% |
| PEG | 1.96 | EPS past 5Y | 20.26% |
| P/S | 5.69 | EPS next 5Y | 10.63% |
| P/B | 6.71 | EPS Q/Q | 112.47% |
| Dividend | 0.22% | Sales Q/Q | 10.68% |
| Insider Own | 12.84% | Inst Own | 77.80% |
| Insider Trans | -0.44% | Inst Trans | 1.91% |
| Short Float | 3.94% | Earnings | May 01/a |
| Analyst Recom | 2.74 | Target Price | 190.01 |
| Avg Volume | 761.51K | 52W Range | 146.15 - 374.04 |
|
|
|
|
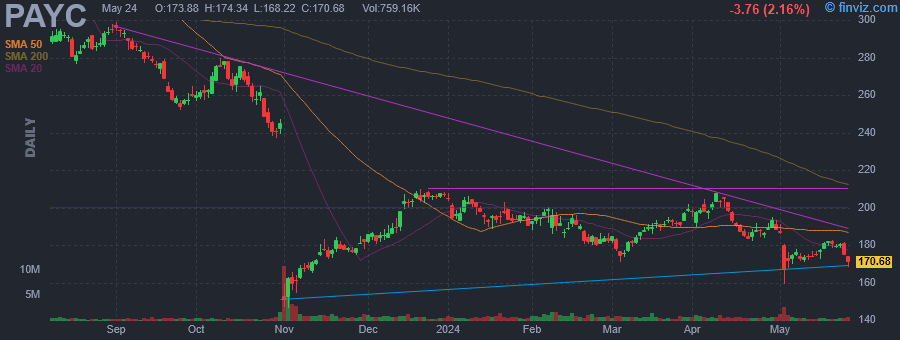
Paycom Software, Inc. engages in the provision of cloud-based human capital management software solutions delivered as software-as-a-service. It offers functionality and data analytics that businesses need to manage the complete employment life cycle from recruitment to retirement. The company was founded by Chad R. Richison in 1998 and is headquartered in Oklahoma City, OK. |
| Insider Trading |
Relationship |
Date |
Transaction |
Cost |
#Shares |
Value ($) |
#Shares Total |
SEC Form 4 |
| Richison Chad R. | Co-CEO, President and Chairman | May 23 '24 | Sale | 176.95 | 1,950 | 345,051 | 3,084,158 | May 24 04:05 PM | | Richison Chad R. | Co-CEO, President and Chairman | May 23 '24 | Sale | 176.95 | 1,950 | 345,051 | 3,661,249 | May 24 04:05 PM | | Richison Chad R. | Co-CEO, President and Chairman | May 22 '24 | Sale | 179.75 | 1,950 | 350,514 | 3,086,108 | May 23 04:05 PM | | Richison Chad R. | Co-CEO, President and Chairman | May 22 '24 | Sale | 179.75 | 1,950 | 350,514 | 3,663,199 | May 23 04:05 PM | | Richison Chad R. | Co-CEO, President and Chairman | May 21 '24 | Sale | 179.27 | 1,950 | 349,576 | 3,088,058 | May 22 04:56 PM |
|
|
|
 |
| Market Cap | 15.29B | EPS (ttm) | 2.52 |
| P/E | 24.53 | EPS this Y | 10.79% |
| Forward P/E | 10.96 | EPS next Y | 10.44% |
| PEG | 3.12 | EPS past 5Y | 41.30% |
| P/S | 2.74 | EPS next 5Y | 7.87% |
| P/B | 2.38 | EPS Q/Q | 26.90% |
| Dividend | 1.50% | Sales Q/Q | 5.31% |
| Insider Own | 13.24% | Inst Own | 85.70% |
| Insider Trans | -0.09% | Inst Trans | -2.32% |
| Short Float | 0.67% | Earnings | Apr 25/a |
| Analyst Recom | 1.50 | Target Price | 71.63 |
| Avg Volume | 984.99K | 52W Range | 46.61 - 65.86 |
|
|
|
|
SS&C Technologies Holdings, Inc. engages in the development and provision of software solutions to the financial services and healthcare industries. It operates through the following geographical segments: United States, Europe, Middle East and Africa, Asia Pacific and Japan, Canada, and the Americas, excluding the United States and Canada. Its products include advent genesis, antares, asset allocators, AWD, axys, BANC mall, BRIX, DST vision, evare, lightning, and moxy. The company was founded by William Charles Stone in March 1986 and is headquartered in Windsor, CT. |
| Insider Trading |
Relationship |
Date |
Transaction |
Cost |
#Shares |
Value ($) |
#Shares Total |
SEC Form 4 |
| ZAMKOW MICHAEL JAY | Director | May 23 '24 | Option Exercise | 22.38 | 10,000 | 223,750 | 48,000 | May 24 04:05 PM | | ZAMKOW MICHAEL JAY | Director | May 23 '24 | Sale | 61.92 | 10,000 | 619,206 | 38,000 | May 24 04:05 PM | | ZAMKOW MICHAEL JAY | Director | May 16 '24 | Option Exercise | 22.38 | 10,000 | 223,750 | 48,000 | May 17 07:26 PM | | ZAMKOW MICHAEL JAY | Director | May 16 '24 | Sale | 63.94 | 10,000 | 639,400 | 38,000 | May 17 07:26 PM | | ZAMKOW MICHAEL JAY | Director | May 09 '24 | Option Exercise | 22.38 | 5,000 | 111,875 | 43,000 | May 13 08:30 PM |
|
|
|
 |
| Market Cap | 104.89B | EPS (ttm) | 19.08 |
| P/E | 40.82 | EPS this Y | -7.95% |
| Forward P/E | 27.19 | EPS next Y | 22.72% |
| PEG | 6.78 | EPS past 5Y | 36.50% |
| P/S | 10.95 | EPS next 5Y | 6.02% |
| P/B | 33.91 | EPS Q/Q | -12.03% |
| Dividend | 0.72% | Sales Q/Q | -3.12% |
| Insider Own | 0.14% | Inst Own | 90.23% |
| Insider Trans | -16.29% | Inst Trans | -4.69% |
| Short Float | 1.70% | Earnings | Apr 25/a |
| Analyst Recom | 2.11 | Target Price | 765.76 |
| Avg Volume | 868.89K | 52W Range | 404.80 - 790.52 |
|
|
|
|
KLA Corp. engages in the supply of process control and yield management solutions for the semiconductor and related nano-electronics industries. The company operates through the following segments: Semiconductor Process Control, Specialty Semiconductor Process, and PCB, Display and Component Inspection. The Semiconductor Process Control segment provides a comprehensive portfolio of inspection, metrology and data analytics products and related services. The Specialty Semiconductor Process segment develops and sells advanced vacuum deposition and etching process tools. The PCB, Display and Component Inspection segment enables electronic device manufacturers to inspect, test and measure PCBs, flat panel displays and ICs to verify their quality. Its products include manufactured chips, reticle, packaging, surface profilers, nanochemical testers, KT pro equipment, and compound semiconductors. The company was founded in April 1997 and is headquartered in Milpitas, CA. |
| Insider Trading |
Relationship |
Date |
Transaction |
Cost |
#Shares |
Value ($) |
#Shares Total |
SEC Form 4 |
| Higgins Bren D. | EVP & Chief Financial Officer | May 23 '24 | Sale | 788.58 | 1,019 | 803,563 | 31,356 | May 24 04:05 PM | | Khan Ahmad A. | President, Semi Proc. Control | May 21 '24 | Sale | 760.00 | 7,833 | 5,953,080 | 32,105 | May 23 05:38 PM | | WALLACE RICHARD P | President and CEO | May 07 '24 | Sale | 716.63 | 14,009 | 10,039,270 | 93,142 | May 09 04:05 PM | | Lorig Brian | Executive Vice President | May 06 '24 | Sale | 699.16 | 3,537 | 2,472,929 | 14,210 | May 08 04:05 PM | | Higgins Bren D. | EVP & Chief Financial Officer | Mar 26 '24 | Sale | 705.04 | 7,018 | 4,947,971 | 32,375 | Mar 28 04:05 PM |
|
|
|
