 |
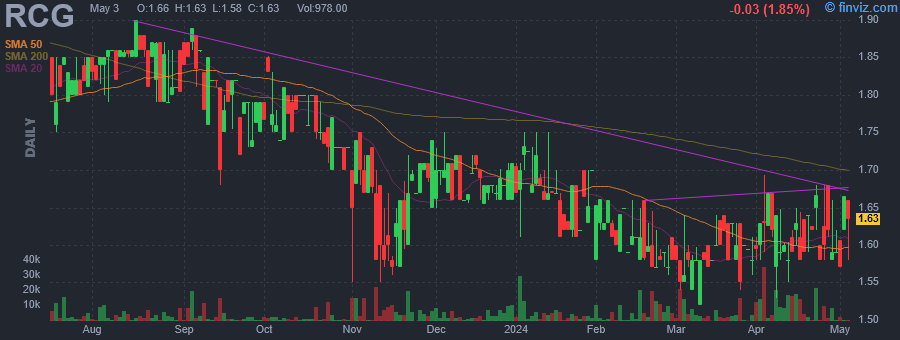
| Market Cap | 192.32M | EPS (ttm) | -1.42 |
| P/E | - | EPS this Y | - |
| Forward P/E | - | EPS next Y | - |
| PEG | - | EPS past 5Y | - |
| P/S | - | EPS next 5Y | - |
| P/B | - | EPS Q/Q | - |
| Dividend | 4.66% | Sales Q/Q | - |
| Insider Own | - | Inst Own | 35.37% |
| Insider Trans | - | Inst Trans | - |
| Short Float | 0.08% | Earnings | - |
| Analyst Recom | - | Target Price | - |
| Avg Volume | 39.26K | 52W Range | 9.18 - 11.48 |
|
|
|
|
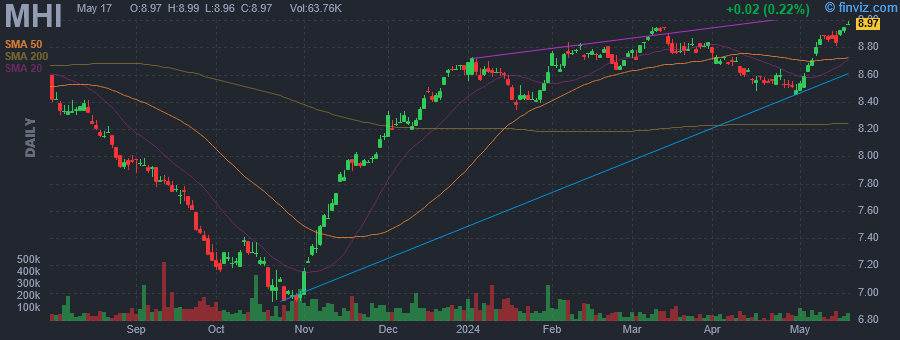
Pioneer Municipal High Income Opportunities Fund, Inc. (the Fund) is a diversified, closed-end management investment company. The Fund's primary investment objective is to provide holders of the Fund's common stock with a high level of current income exempt from regular federal income tax. As a secondary investment objective, the Fund may seek capital appreciation to the extent consistent with its primary investment objective. The Fund invests at least 80% of its net assets (plus the amount of borrowings, if any, for investment purposes) in securities issued by or on behalf of states, counties, municipalities, territories and possessions of the United States and the District of Columbia and their authorities, political subdivisions, agencies and instrumentalities, the interest, on which is exempt from regular federal income tax (municipal securities). It may invest without limit in debt securities of any credit quality. The Fund's investment advisor is Amundi Asset Management US, Inc. |
| Insider Trading |
Relationship |
Date |
Transaction |
Cost |
#Shares |
Value ($) |
#Shares Total |
SEC Form 4 |
| Saba Capital Management, L.P. | 10% Owner | May 16 '24 | Buy | 11.40 | 2,329 | 26,551 | 1,734,715 | May 17 01:05 PM | | Saba Capital Management, L.P. | 10% Owner | May 15 '24 | Buy | 11.46 | 6,399 | 73,333 | 1,732,386 | May 17 01:05 PM | | Saba Capital Management, L.P. | 10% Owner | Mar 19 '24 | Buy | 11.21 | 5,909 | 66,240 | 1,725,979 | Mar 20 11:57 AM | | Saba Capital Management, L.P. | 10% Owner | Mar 07 '24 | Buy | 11.10 | 24,761 | 274,847 | 1,720,070 | Mar 11 02:30 PM | | Saba Capital Management, L.P. | 10% Owner | Mar 06 '24 | Buy | 11.06 | 6,438 | 71,204 | 1,695,309 | Mar 06 04:52 PM |
|
|
 |
 |
| Market Cap | 204.26M | EPS (ttm) | 0.04 |
| P/E | 224.25 | EPS this Y | - |
| Forward P/E | - | EPS next Y | - |
| PEG | - | EPS past 5Y | - |
| P/S | 12.16 | EPS next 5Y | - |
| P/B | 1.07 | EPS Q/Q | - |
| Dividend | 3.93% | Sales Q/Q | 3.50% |
| Insider Own | - | Inst Own | 55.20% |
| Insider Trans | - | Inst Trans | - |
| Short Float | 0.20% | Earnings | - |
| Analyst Recom | - | Target Price | - |
| Avg Volume | 52.56K | 52W Range | 6.93 - 8.95 |
|
|
|
|
Pioneer Municipal High Income Fund, Inc. is a closed-ended fixed income mutual fund launched and managed by Pioneer Investment Management, Inc. It invests in the fixed income markets of the United States. The fund primarily invests in municipal securities. It seeks to invest in securities across the credit rating and maturity spectrum. The fund benchmarks the performance of its portfolio against the Barclays Municipal Bond Index and Barclays High Yield Municipal Bond Index. Pioneer Municipal High Income Fund, Inc. was formed on March 13, 2003 and is domiciled in the United States. |
| Insider Trading |
Relationship |
Date |
Transaction |
Cost |
#Shares |
Value ($) |
#Shares Total |
SEC Form 4 |
| Saba Capital Management, L.P. | 10% Owner | May 15 '24 | Buy | 8.91 | 11,105 | 98,946 | 3,449,685 | May 17 01:03 PM | | Saba Capital Management, L.P. | 10% Owner | May 03 '24 | Buy | 8.64 | 4,765 | 41,170 | 3,438,580 | May 07 05:12 PM | | Saba Capital Management, L.P. | 10% Owner | May 02 '24 | Buy | 8.56 | 32,971 | 282,232 | 3,433,815 | May 03 01:12 PM | | Saba Capital Management, L.P. | 10% Owner | Mar 11 '24 | Buy | 8.93 | 30,534 | 272,669 | 3,400,844 | Mar 12 05:54 PM | | Saba Capital Management, L.P. | 10% Owner | Mar 01 '24 | Buy | 8.76 | 5,666 | 49,634 | 3,370,310 | Mar 04 06:09 PM |
|
|
|
 |
| Market Cap | 700.56M | EPS (ttm) | -3.26 |
| P/E | - | EPS this Y | - |
| Forward P/E | - | EPS next Y | - |
| PEG | - | EPS past 5Y | - |
| P/S | - | EPS next 5Y | - |
| P/B | - | EPS Q/Q | - |
| Dividend | 10.77% | Sales Q/Q | - |
| Insider Own | 7.50% | Inst Own | 58.77% |
| Insider Trans | 8.95% | Inst Trans | - |
| Short Float | 0.15% | Earnings | - |
| Analyst Recom | - | Target Price | - |
| Avg Volume | 137.88K | 52W Range | 10.63 - 14.35 |
|
|
|
|
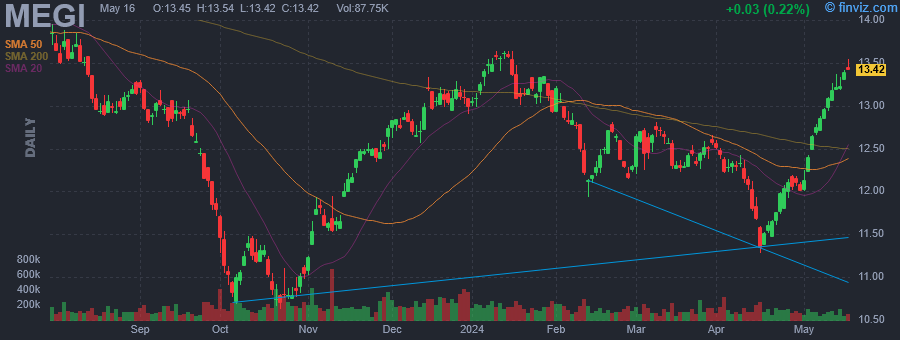
The investment objective of MainStay CBRE Global Infrastructure Megatrends Fund (MEGI) is to seek a high level of total return with an emphasis on current income. |
| Insider Trading |
Relationship |
Date |
Transaction |
Cost |
#Shares |
Value ($) |
#Shares Total |
SEC Form 4 |
| Saba Capital Management, L.P. | 10% Owner | May 15 '24 | Buy | 13.38 | 1,508 | 20,177 | 5,628,222 | May 17 12:58 PM | | Saba Capital Management, L.P. | 10% Owner | May 03 '24 | Buy | 12.53 | 9,828 | 123,145 | 5,626,714 | May 07 05:10 PM | | Saba Capital Management, L.P. | 10% Owner | May 02 '24 | Buy | 12.33 | 12,874 | 158,736 | 5,616,886 | May 03 01:10 PM | | Saba Capital Management, L.P. | 10% Owner | Apr 25 '24 | Buy | 12.03 | 45,097 | 542,517 | 5,603,993 | Apr 26 11:47 AM | | Saba Capital Management, L.P. | 10% Owner | Apr 24 '24 | Buy | 11.95 | 26,481 | 316,448 | 5,558,896 | Apr 26 11:47 AM |
|
|
| |
 |
| Market Cap | 745.32M | EPS (ttm) | 2.71 |
| P/E | 18.55 | EPS this Y | - |
| Forward P/E | - | EPS next Y | - |
| PEG | - | EPS past 5Y | -7.81% |
| P/S | 4.37 | EPS next 5Y | - |
| P/B | 1.17 | EPS Q/Q | -30.94% |
| Dividend | 4.22% | Sales Q/Q | 9.92% |
| Insider Own | 24.20% | Inst Own | 12.63% |
| Insider Trans | 0.79% | Inst Trans | - |
| Short Float | 1.56% | Earnings | Apr 26/b |
| Analyst Recom | - | Target Price | - |
| Avg Volume | 18.85K | 52W Range | 42.91 - 85.00 |
|
|
|
May-15-24 10:11AM
|
Is Burke & Herbert Bank & Trust Co (NASDAQ:BHRB) the Best Financial Dividend Stock Insiders are Buying in 2024?
(Insider Monkey) |
|
08:50AM
|
10 Best Financial Dividend Stocks Insiders are Buying in 2024
(Insider Monkey) |
|
May-13-24 09:54AM
|
BHRB Stock Earnings: Burke & Herbert Financial Reported Results for Q4 2023
(InvestorPlace) |
|
May-03-24 07:30AM
|
Burke & Herbert Financial Services Corp. Completes Merger of Equals with Summit Financial Group, Inc.
(PR Newswire) +5.92% |
|
Apr-26-24 01:53PM
|
BHRB Stock Earnings: Burke & Herbert Financial Reported Results for Q1 2024
(InvestorPlace) |
|
08:30AM
|
Burke & Herbert Financial Services Corp. Announces First Quarter 2024 Results and Declares Common Stock Dividend
(PR Newswire) |
|
Apr-19-24 08:30AM
|
Burke & Herbert Financial Services Corp. and Summit Financial Group, Inc. Announce Receipt of Regulatory Approvals and Closing Date for Merger of Equals
(PR Newswire) |
|
Feb-01-24 12:02PM
|
Hedge Fund and Insider Trading News: David Einhorn, Crispin Odey, Bill Ackman, Stanley Druckenmiller, Ken Griffin, Burke Herbert Financial Services (BHRB), KalVista Pharmaceuticals, Inc. (KALV), and More
(Insider Monkey) |
|
Jan-26-24 08:00AM
|
Burke & Herbert Financial Services Corp. Announces Fourth Quarter and Full Year 2023 Results and Declares Common Stock Dividend
(PR Newswire) |
|
Dec-06-23 02:07PM
|
Burke & Herbert Financial Services Corp. and Summit Financial Group, Inc. Announce Receipt of Shareholder Approval for Merger
(PR Newswire) |
|
Burke Herbert Financial Services Corp. is a bank holding company, which engages in the provision of banking products and financial services to small to medium-sized businesses, their owners and employees, professional corporations, non-profits, and individuals. It operates through the following loan portfolio segments: Commercial Real Estate, Owner-Occupied Commercial Real Estate, Acquisition, Construction, and Development, Commercial and Industrial, Single Family Residential (1-4 Units), and Consumer Non-Real Estate and Other. The Commercial Real Estate segment includes leasing of the real estate collateral or income generated from the sale of the collateral. The Owner-Occupied Commercial Real Estate segment focuses on the operations of the business that occupies the property and the value of the collateral. The Acquisition, Construction, and Development segment offers creditworthiness of the borrower, project completion within budget, sale after completion, and the value of the collateral. The Commercial and Industrial segment is involved in the operations of the business and the value of the collateral. The Single Family Residential (1-4 Units) segment provides loans for investment purpose carry risk associated with the continued creditworthiness of the borrower, the value of the collateral, and either the net operating income generated from the lease of the real estate collateral or income generated from the sale of the collateral. The Consumer Non-Real Estate and Other segment covers loans carry risk associated with the creditworthiness of the borrower and the value of the collateral. The company was founded on September 14, 2022 and is headquartered in Alexandria, VA. |
| Insider Trading |
Relationship |
Date |
Transaction |
Cost |
#Shares |
Value ($) |
#Shares Total |
SEC Form 4 |
| HINKLE GARY L | Director | May 16 '24 | Buy | 50.29 | 210 | 10,562 | 219,660 | May 17 12:55 PM | | HINKLE GARY L | Director | May 15 '24 | Buy | 50.23 | 600 | 30,135 | 219,450 | May 15 05:17 PM | | HINKLE GARY L | Director | May 14 '24 | Buy | 49.50 | 2,779 | 137,560 | 218,850 | May 14 03:15 PM | | HINKLE GARY L | Director | May 13 '24 | Buy | 49.65 | 613 | 30,435 | 216,071 | May 14 09:33 AM | | HINKLE GARY L | Director | May 10 '24 | Buy | 49.60 | 1,608 | 79,757 | 215,458 | May 10 04:33 PM |
|
|
|
 |
| Market Cap | 193.47M | EPS (ttm) | -0.06 |
| P/E | - | EPS this Y | - |
| Forward P/E | - | EPS next Y | - |
| PEG | - | EPS past 5Y | - |
| P/S | 10.76 | EPS next 5Y | - |
| P/B | 1.00 | EPS Q/Q | - |
| Dividend | 4.23% | Sales Q/Q | 5.00% |
| Insider Own | - | Inst Own | 46.63% |
| Insider Trans | - | Inst Trans | - |
| Short Float | 0.10% | Earnings | - |
| Analyst Recom | - | Target Price | - |
| Avg Volume | 48.81K | 52W Range | 6.37 - 8.19 |
|
|
|
|
Pioneer Municipal High Income Advantage Fund, Inc. is a closed ended fixed income mutual fund launched and managed by Pioneer Investment Management, Inc. The fund invests in the fixed income markets of the United States. It invests primarily in municipal bonds. The fund benchmarks the performance of its portfolio against the Barclays Capital High Yield Municipal Bond Index and the Barclays Capital Municipal Bond Index. It was formerly known as Pioneer Municipal Advantage Trust. Pioneer Municipal High Income Advantage Fund, Inc. was formed on August 6, 2003 and is domiciled in the United States. |
| Insider Trading |
Relationship |
Date |
Transaction |
Cost |
#Shares |
Value ($) |
#Shares Total |
SEC Form 4 |
| Saba Capital Management, L.P. | 10% Owner | May 15 '24 | Buy | 8.08 | 49,514 | 400,073 | 2,800,265 | May 17 12:47 PM | | Saba Capital Management, L.P. | 10% Owner | May 03 '24 | Buy | 7.96 | 13,162 | 104,770 | 2,750,751 | May 07 05:09 PM | | Saba Capital Management, L.P. | 10% Owner | May 02 '24 | Buy | 7.87 | 35,879 | 282,368 | 2,737,589 | May 02 04:52 PM | | Saba Capital Management, L.P. | 10% Owner | May 01 '24 | Buy | 7.82 | 24,037 | 187,969 | 2,701,710 | May 02 04:52 PM | | Saba Capital Management, L.P. | 10% Owner | Apr 25 '24 | Buy | 7.81 | 38,952 | 304,215 | 2,677,669 | Apr 26 11:43 AM |
|
|
| |
 |
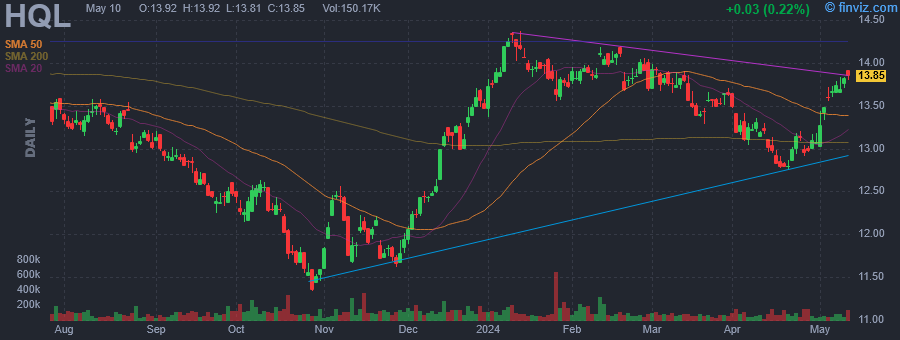
| Market Cap | 11.29M | EPS (ttm) | -0.12 |
| P/E | - | EPS this Y | - |
| Forward P/E | - | EPS next Y | - |
| PEG | - | EPS past 5Y | - |
| P/S | 39.52 | EPS next 5Y | - |
| P/B | 0.82 | EPS Q/Q | - |
| Dividend | 0.94% | Sales Q/Q | 26.30% |
| Insider Own | 14.94% | Inst Own | 16.29% |
| Insider Trans | 1.00% | Inst Trans | - |
| Short Float | 0.04% | Earnings | - |
| Analyst Recom | - | Target Price | - |
| Avg Volume | 7.25K | 52W Range | 1.52 - 1.90 |
|
|
|
|
RENN Fund, Inc. is a closed ended equity mutual fund launched by RENN Capital Group, Inc. The fund is co-managed by Horizon Kinetics Asset Management LLC. It invests in the public equity markets of the United States. The fund seeks to invest in stocks of companies operating across diversified sectors. It seeks to invest in stocks of small-cap and mid-cap companies. The fund employs a fundamental analysis with a bottom-up stock picking approach to create its portfolio. It was formerly known as RENN Global Entrepreneurs Fund, Inc. RENN Fund, Inc. was formed on January 20, 1994 and is domiciled in the United States. |
| Insider Trading |
Relationship |
Date |
Transaction |
Cost |
#Shares |
Value ($) |
#Shares Total |
SEC Form 4 |
| STAHL MURRAY | President and CEO | May 16 '24 | Buy | 1.63 | 55 | 90 | 247,882 | May 17 12:42 PM | | STAHL MURRAY | President and CEO | May 16 '24 | Buy | 1.63 | 2 | 3 | 5,075 | May 17 12:42 PM | | STAHL MURRAY | President and CEO | May 15 '24 | Buy | 1.60 | 55 | 88 | 247,858 | May 16 11:24 AM | | STAHL MURRAY | President and CEO | May 15 '24 | Buy | 1.60 | 4 | 6 | 5,073 | May 16 11:24 AM | | STAHL MURRAY | President and CEO | May 14 '24 | Buy | 1.60 | 55 | 88 | 247,834 | May 15 11:13 AM |
|
|
|
 |
| Market Cap | 385.64M | EPS (ttm) | 0.79 |
| P/E | 17.85 | EPS this Y | - |
| Forward P/E | - | EPS next Y | - |
| PEG | - | EPS past 5Y | - |
| P/S | 109.78 | EPS next 5Y | - |
| P/B | 0.87 | EPS Q/Q | - |
| Dividend | 7.16% | Sales Q/Q | 34.40% |
| Insider Own | - | Inst Own | 34.38% |
| Insider Trans | - | Inst Trans | - |
| Short Float | 0.21% | Earnings | - |
| Analyst Recom | - | Target Price | - |
| Avg Volume | 85.83K | 52W Range | 11.34 - 14.37 |
|
|
|
|
Tekla Life Sciences Investors is a closed-ended equity mutual fund launched and managed by Tekla Capital Management LLC. The fund invests in public equity markets across the globe. It seeks to invest in stocks of companies operating in the life sciences sector, including the biotechnology, pharmaceutical, diagnostics, managed healthcare, medical equipment, hospitals, healthcare information technology and services, devices and supplies industries, and in agriculture and environmental management industries. The fund primarily invests in growth stocks of small cap companies. It employs fundamental analysis with a focus on factors such as market position for services or products, experience of business management, technological expertise, and the ability either to generate funds internally to finance growth or to secure outside sources of capital to create its portfolio. The fund benchmarks the performance of its portfolio against the NASDAQ Biotech Index and the S&P 500 Index. It was formerly known as H&Q Life Sciences Investors fund. Tekla Life Sciences Investors was formed on February 20, 1992 and is domiciled in the United States. |
| Insider Trading |
Relationship |
Date |
Transaction |
Cost |
#Shares |
Value ($) |
#Shares Total |
SEC Form 4 |
| Saba Capital Management, L.P. | 10% Owner | May 15 '24 | Buy | 14.19 | 34,755 | 493,173 | 3,250,580 | May 17 12:34 PM | | Saba Capital Management, L.P. | 10% Owner | May 10 '24 | Buy | 13.86 | 57,862 | 801,967 | 3,215,825 | May 14 01:50 PM | | Saba Capital Management, L.P. | 10% Owner | May 09 '24 | Buy | 13.80 | 17,373 | 239,747 | 3,157,963 | May 10 10:31 AM | | Saba Capital Management, L.P. | 10% Owner | May 08 '24 | Buy | 13.70 | 10,986 | 150,508 | 3,140,590 | May 10 10:31 AM | | Saba Capital Management, L.P. | 10% Owner | May 07 '24 | Buy | 13.76 | 50,161 | 690,215 | 3,129,604 | May 07 05:07 PM |
|
|
| |
 |
| Market Cap | 312.74M | EPS (ttm) | -0.05 |
| P/E | - | EPS this Y | - |
| Forward P/E | - | EPS next Y | - |
| PEG | - | EPS past 5Y | -1.84% |
| P/S | 12.67 | EPS next 5Y | - |
| P/B | 1.00 | EPS Q/Q | - |
| Dividend | 3.60% | Sales Q/Q | 3.10% |
| Insider Own | - | Inst Own | 61.97% |
| Insider Trans | - | Inst Trans | - |
| Short Float | 0.05% | Earnings | - |
| Analyst Recom | - | Target Price | - |
| Avg Volume | 61.43K | 52W Range | 8.95 - 11.05 |
|
|
|
|
AllianceBernstein National Municipal Income Fund, Inc. is a closed-ended fixed income mutual fund launched and managed by AllianceBernstein L.P. The fund invests in the fixed income markets of the United States. It primarily invests in investment-grade municipal securities which pay interest that is exempt from federal income tax. The fund seeks to invest in bonds rated Baa/BBB or higher. It employs both quantitative and fundamental analysis to create its portfolio. AllianceBernstein National Municipal Income Fund, Inc. was formed on November 9, 2001 and is domiciled in the United States. |
| Insider Trading |
Relationship |
Date |
Transaction |
Cost |
#Shares |
Value ($) |
#Shares Total |
SEC Form 4 |
| Saba Capital Management, L.P. | 10% Owner | May 16 '24 | Buy | 10.91 | 43,712 | 476,898 | 2,972,154 | May 17 12:32 PM | | Saba Capital Management, L.P. | 10% Owner | May 15 '24 | Buy | 10.92 | 11,181 | 122,097 | 2,928,442 | May 17 12:32 PM |
|
|
|
 |
| Market Cap | 1.79B | EPS (ttm) | -0.45 |
| P/E | - | EPS this Y | - |
| Forward P/E | - | EPS next Y | - |
| PEG | - | EPS past 5Y | - |
| P/S | 21.92 | EPS next 5Y | - |
| P/B | 1.11 | EPS Q/Q | - |
| Dividend | 6.13% | Sales Q/Q | 27.90% |
| Insider Own | - | Inst Own | 18.38% |
| Insider Trans | - | Inst Trans | - |
| Short Float | 0.04% | Earnings | - |
| Analyst Recom | - | Target Price | - |
| Avg Volume | 108.94K | 52W Range | 18.70 - 24.03 |
|
|
|
|
Eaton Vance Tax-Advantaged Dividend Income Fund is a closed-ended equity mutual fund launched and managed by Eaton Vance Management. The fund invests in public equity markets across the globe. It seeks to invest in stocks of companies operating across the diversified sectors. The fund primarily invests in dividend paying value stocks of companies that qualify for favorable federal income tax treatment. It benchmarks the performance of its portfolio against the Russell 1000 Value Index. Eaton Vance Tax-Advantaged Dividend Income Fund was formed on September 30, 2003 and is domiciled in the United States. |
| Insider Trading |
Relationship |
Date |
Transaction |
Cost |
#Shares |
Value ($) |
#Shares Total |
SEC Form 4 |
| Dunn Aaron | Director | May 17 '24 | Buy | 23.97 | 290 | 6,950 | 1,236 | May 17 12:23 PM | | Dunn Aaron | Director | Feb 16 '24 | Buy | 22.44 | 315 | 7,070 | 946 | Feb 16 03:08 PM | | Dunn Aaron | Director | Nov 16 '23 | Buy | 20.42 | 270 | 5,513 | 604 | Nov 17 10:11 AM | | DiGregorio Derek | Portfolio Manager | Aug 14 '23 | Buy | 23.00 | 2,859 | 65,757 | 2,859 | Aug 16 05:08 PM |
|
|
|
 |
| Market Cap | 2.70B | EPS (ttm) | 2.89 |
| P/E | 28.98 | EPS this Y | 19.34% |
| Forward P/E | 12.08 | EPS next Y | 11.58% |
| PEG | 5.18 | EPS past 5Y | -11.48% |
| P/S | 1.25 | EPS next 5Y | 5.60% |
| P/B | 1.63 | EPS Q/Q | 26.61% |
| Dividend | 0.48% | Sales Q/Q | -2.12% |
| Insider Own | 1.38% | Inst Own | 97.45% |
| Insider Trans | -11.60% | Inst Trans | -2.26% |
| Short Float | 0.79% | Earnings | Apr 25/a |
| Analyst Recom | 1.25 | Target Price | 96.50 |
| Avg Volume | 139.65K | 52W Range | 48.61 - 81.90 |
|
|
|
|
Minerals Technologies, Inc. is a resource and technology-based company. It develops, produces, and markets a range of mineral, mineral-based, and synthetic mineral products. It operates through the Consumer and Specialties and Engineered Solutions segments. The Consumer and Specialties segment serves consumer end markets directly and provides mineral-based solutions and technologies that are essential to customers' products. The Engineered Solutions segment combines all engineered systems, mineral blends, and technologies that are designed to aid in customer processes and projects. The company was founded on February 19, 1968 and is headquartered in New York, NY. |
| Insider Trading |
Relationship |
Date |
Transaction |
Cost |
#Shares |
Value ($) |
#Shares Total |
SEC Form 4 |
| JOHNSON KRISTINA M | Director | May 16 '24 | Buy | 80.92 | 400 | 32,368 | 400 | May 17 12:04 PM | | MONAGLE DJ III | Group President | Mar 22 '24 | Option Exercise | 65.16 | 1,180 | 76,889 | 82,211 | Mar 26 11:56 AM | | MONAGLE DJ III | Group President | Mar 22 '24 | Sale | 74.12 | 1,180 | 87,459 | 81,031 | Mar 26 11:56 AM | | Hastings Jonathan J | Senior Vice President | Feb 20 '24 | Option Exercise | 38.28 | 12,922 | 494,719 | 66,784 | Feb 21 02:08 PM | | Hastings Jonathan J | Senior Vice President | Feb 20 '24 | Sale | 71.48 | 12,922 | 923,644 | 53,862 | Feb 21 02:08 PM |
|
|
|
