 |
| Market Cap | 8.52B | EPS (ttm) | 2.57 |
| P/E | 11.94 | EPS this Y | 4.65% |
| Forward P/E | 10.43 | EPS next Y | 6.75% |
| PEG | 1.19 | EPS past 5Y | 11.06% |
| P/S | 1.13 | EPS next 5Y | 10.00% |
| P/B | 1.33 | EPS Q/Q | 69.22% |
| Dividend | 3.26% | Sales Q/Q | 14.63% |
| Insider Own | 7.30% | Inst Own | 72.15% |
| Insider Trans | 0.01% | Inst Trans | -2.14% |
| Short Float | 1.00% | Earnings | Apr 25/b |
| Analyst Recom | 2.25 | Target Price | 34.00 |
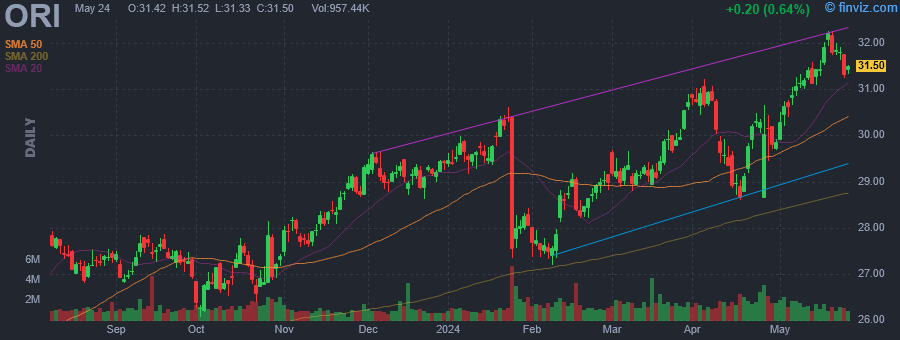
| Avg Volume | 1.81M | 52W Range | 24.17 - 31.22 |
|
|
|
|
Old Republic International Corp. is a holding company, which engages in the business of insurance underwriting. It operates through the following segments: General Insurance, Title Insurance, Republic Financial Indemnity Group (RFIG) Run-Off, and Corporate and Other. The General Insurance segment provides property and liability insurance primarily to commercial clients. The Title Insurance segment is involved in the issuance of policies to real estate purchasers and investors based upon searches of the public records which contain information concerning interests in real property. The RFIG Run-Off segment focuses on mortgage guaranty and consumer credit indemnity operations. The Corporate and Other segment includes a small life and accident insurance business. The company was founded in 1923 and is headquartered in Chicago, IL. |
| Insider Trading |
Relationship |
Date |
Transaction |
Cost |
#Shares |
Value ($) |
#Shares Total |
SEC Form 4 |
| ADACHI BARBARA | Director | May 01 '24 | Buy | 30.24 | 442 | 13,366 | 8,287 | May 02 11:06 AM | | Risch Therace | Director | Apr 30 '24 | Buy | 29.77 | 6,086 | 181,180 | 6,086 | May 02 11:07 AM | | Smiddy Craig R | President & CEO | Mar 06 '24 | Option Exercise | 16.06 | 14,500 | 232,870 | 166,502 | Mar 08 11:59 AM | | ADACHI BARBARA | Director | Feb 16 '24 | Buy | 28.60 | 1,925 | 55,055 | 7,845 | Feb 20 08:39 AM | | MONROE CAROLYN | SVP - Title Insurance | Feb 02 '24 | Option Exercise | 19.54 | 30,000 | 586,080 | 30,000 | Feb 06 05:06 PM |
|
|
 |
 |
| Market Cap | 234.23M | EPS (ttm) | 0.78 |
| P/E | 15.25 | EPS this Y | 19.28% |
| Forward P/E | 9.83 | EPS next Y | 22.47% |
| PEG | - | EPS past 5Y | - |
| P/S | 2.00 | EPS next 5Y | - |
| P/B | 1.22 | EPS Q/Q | -19.64% |
| Dividend | 1.68% | Sales Q/Q | 36.41% |
| Insider Own | 47.38% | Inst Own | 39.26% |
| Insider Trans | 0.77% | Inst Trans | 0.91% |
| Short Float | 0.40% | Earnings | Apr 25/a |
| Analyst Recom | 2.25 | Target Price | 13.62 |
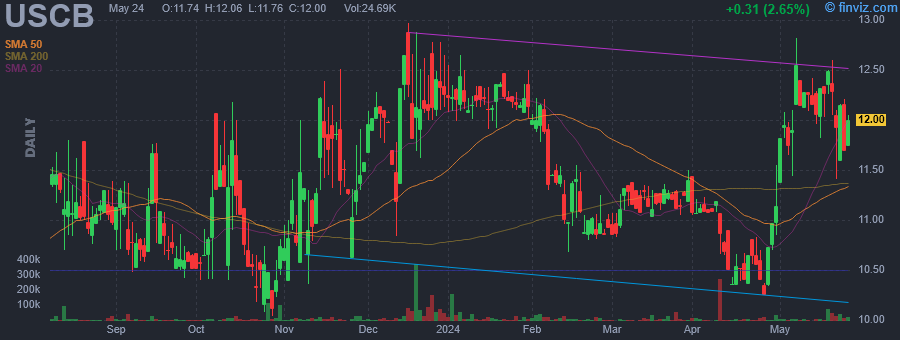
| Avg Volume | 19.09K | 52W Range | 8.56 - 12.97 |
|
|
|
|
USCB Financial Holdings, Inc. operates as a bank holding company. The company was founded on December 17, 2021 and is headquartered in Doral, FL. |
| Insider Trading |
Relationship |
Date |
Transaction |
Cost |
#Shares |
Value ($) |
#Shares Total |
SEC Form 4 |
| Anderson Robert B. | Executive VP and CFO | May 01 '24 | Buy | 11.48 | 987 | 11,331 | 68,408 | May 01 03:48 PM | | Anderson Robert B. | Executive VP and CFO | Apr 30 '24 | Buy | 11.14 | 19,289 | 214,879 | 67,421 | May 01 03:48 PM | | RODRIGUEZ RAMON A | Director | Apr 30 '24 | Buy | 11.18 | 900 | 10,062 | 4,400 | May 02 09:35 AM | | Anderson Robert B. | Executive VP and CFO | Mar 14 '24 | Buy | 11.21 | 4,000 | 44,840 | 48,132 | Mar 14 05:41 PM | | Anderson Robert B. | Executive VP and CFO | Mar 13 '24 | Buy | 11.33 | 3,400 | 38,507 | 44,132 | Mar 14 05:41 PM |
|
|
|
 |
| Market Cap | 798.06M | EPS (ttm) | 0.35 |
| P/E | 65.30 | EPS this Y | 20.89% |
| Forward P/E | 18.06 | EPS next Y | 39.89% |
| PEG | 4.35 | EPS past 5Y | - |
| P/S | 1.43 | EPS next 5Y | 15.00% |
| P/B | 3.45 | EPS Q/Q | -25.80% |
| Dividend | - | Sales Q/Q | 12.23% |
| Insider Own | 15.73% | Inst Own | 70.08% |
| Insider Trans | 0.79% | Inst Trans | 1.53% |
| Short Float | 3.66% | Earnings | Apr 30/b |
| Analyst Recom | 1.00 | Target Price | 26.50 |
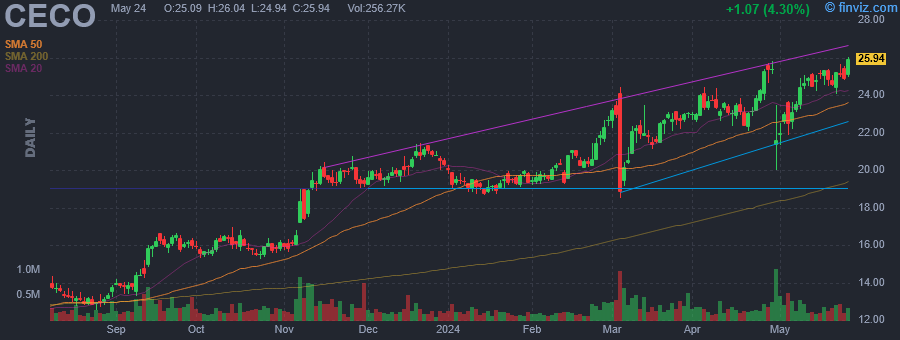
| Avg Volume | 286.46K | 52W Range | 10.68 - 25.82 |
|
|
|
|
CECO Environmental Corp. engages in the provision of engineering technology and solutions. It offers services in the field of environment, energy, fluid handling, and filtration. The firm operates through the following segments: Energy Solutions, Industrial Solutions and Fluid Handling Solutions. The Energy Solutions segment improves air quality and solves fluid handling needs with market engineered, and customized solutions for the power generation, oil and gas, and petrochemical industries. The Industrial Solutions segment serves the industrial pollution control market. The Fluid Handling Solutions segment provides pump and filtration solutions that maintain safe and clean operations in some of the most harsh and toxic environments. The company was founded by Phillip DeZwirek in 1966 and is headquartered in Dallas, TX. |
| Insider Trading |
Relationship |
Date |
Transaction |
Cost |
#Shares |
Value ($) |
#Shares Total |
SEC Form 4 |
| WALLMAN RICHARD F | Director | May 01 '24 | Buy | 21.95 | 5,000 | 109,749 | 191,853 | May 02 08:12 AM | | WALLMAN RICHARD F | Director | Mar 06 '24 | Buy | 19.78 | 50,000 | 989,195 | 185,853 | Mar 08 09:28 AM | | SIEGEL LAURIE | Director | Mar 06 '24 | Buy | 19.87 | 2,500 | 49,664 | 7,906 | Mar 08 09:29 AM | | Gleason Todd R | Chief Executive Officer | Dec 21 '23 | Sale | 21.11 | 14,500 | 306,088 | 184,965 | Dec 26 09:28 AM | | WALLMAN RICHARD F | Director | Sep 18 '23 | Buy | 15.99 | 10,000 | 159,900 | 133,205 | Sep 19 07:55 AM |
|
|
| |
 |
| Market Cap | 35.56B | EPS (ttm) | 3.43 |
| P/E | 22.79 | EPS this Y | 8.97% |
| Forward P/E | 16.34 | EPS next Y | 11.58% |
| PEG | 1.88 | EPS past 5Y | -2.54% |
| P/S | 1.82 | EPS next 5Y | 12.10% |
| P/B | 4.81 | EPS Q/Q | 97.00% |
| Dividend | 0.11% | Sales Q/Q | -1.21% |
| Insider Own | 7.02% | Inst Own | 70.63% |
| Insider Trans | 0.00% | Inst Trans | - |
| Short Float | 2.59% | Earnings | Apr 30/b |
| Analyst Recom | 1.82 | Target Price | 94.33 |
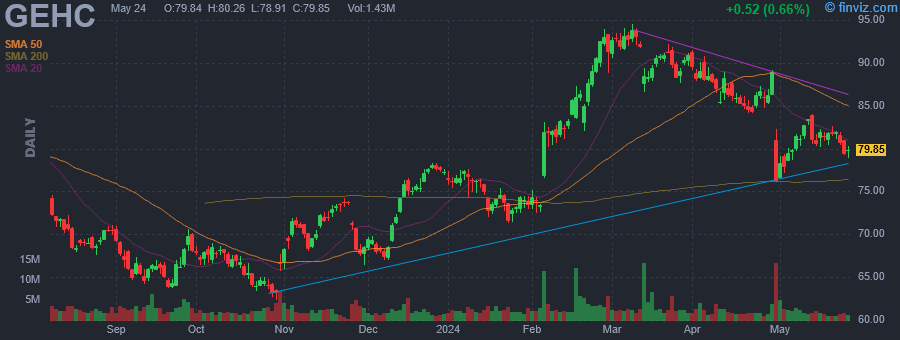
| Avg Volume | 3.77M | 52W Range | 62.35 - 94.50 |
|
|
|
|
GE Healthcare Technologies, Inc. engages in the development and manufacturing of medical technology, pharmaceutical diagnostics, and digital solutions. It operates through the following segments: Imaging, Ultrasound, Patient Care Solutions, and Pharmaceutical Diagnostics. The Imaging segment provides scanning devices, clinical applications, service capabilities and digital solutions. The Ultrasound segment offers screening, diagnosis, treatment, and monitoring of certain diseases. The Patient Care Solutions segment specializes in providing medical devices, consumables, services, and digital solutions. The Pharmaceutical Diagnostics segment supplies diagnostic agents to the global radiology and nuclear medicine community. The company was founded on May 16, 2022 and is headquartered in Chicago, IL. |
| Insider Trading |
Relationship |
Date |
Transaction |
Cost |
#Shares |
Value ($) |
#Shares Total |
SEC Form 4 |
| Jimenez Frank R | GC & Corporate Secretary | May 01 '24 | Buy | 76.52 | 1,315 | 100,624 | 75,796 | May 02 06:00 AM | | O'Neill Kevin Michael | CEO, PDx | Jul 31 '23 | Option Exercise | 40.40 | 13,275 | 536,310 | 37,300 | Aug 02 04:05 PM | | O'Neill Kevin Michael | CEO, PDx | Jul 31 '23 | Sale | 77.32 | 15,609 | 1,206,949 | 24,025 | Aug 02 04:05 PM | | Rott Roland | CEO, Ultrasound | Jun 08 '23 | Sale | 77.37 | 2,473 | 191,336 | 22,335 | Jun 12 04:06 PM |
|
|
|
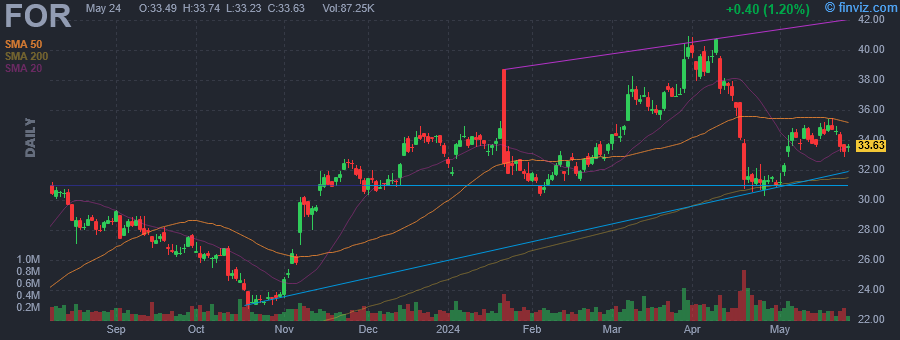 |
| Market Cap | 1.63B | EPS (ttm) | 4.02 |
| P/E | 8.02 | EPS this Y | 11.09% |
| Forward P/E | 7.97 | EPS next Y | 9.16% |
| PEG | 2.06 | EPS past 5Y | 8.78% |
| P/S | 1.05 | EPS next 5Y | 3.90% |
| P/B | 1.11 | EPS Q/Q | 65.24% |
| Dividend | - | Sales Q/Q | 10.71% |
| Insider Own | 63.52% | Inst Own | 36.20% |
| Insider Trans | -0.18% | Inst Trans | 1.97% |
| Short Float | 2.75% | Earnings | Apr 18/b |
| Analyst Recom | 1.50 | Target Price | 40.38 |
| Avg Volume | 248.21K | 52W Range | 19.26 - 40.92 |
|
|
|
|
Forestar Group Inc. is a residential lot development company, which engages in the provision of real estate business. The firm focuses on making investments in land acquisition and development to sell finished single-family residential lots to homebuilders. The company was founded in 2007 and is headquartered in Arlington, TX. |
| Insider Trading |
Relationship |
Date |
Transaction |
Cost |
#Shares |
Value ($) |
#Shares Total |
SEC Form 4 |
| Oxley Anthony W | Chief Executive Officer | Apr 24 '24 | Buy | 31.15 | 3,210 | 99,991 | 3,210 | May 01 09:05 PM | | FULLER SAMUEL R | Director | Mar 31 '24 | Option Exercise | 0.00 | 910 | 0 | 22,951 | Apr 01 04:19 PM | | Ringler G.F. (Rick) III | Director | Mar 31 '24 | Option Exercise | 0.00 | 910 | 0 | 9,951 | Apr 01 04:21 PM | | Jamieson Lisa H. | Director | Mar 31 '24 | Option Exercise | 0.00 | 910 | 0 | 17,451 | Apr 01 04:20 PM | | TOMNITZ DONALD J | Executive Chairman | Mar 31 '24 | Option Exercise | 0.00 | 11,261 | 0 | 110,536 | Apr 01 04:22 PM |
|
|
| |
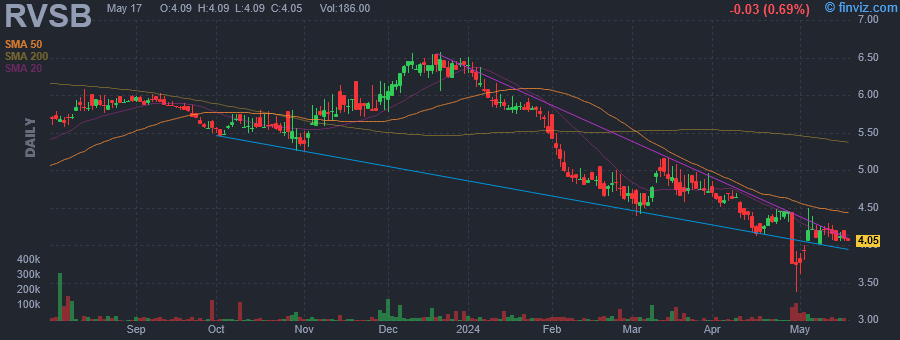 |
| Market Cap | 82.96M | EPS (ttm) | 0.18 |
| P/E | 21.92 | EPS this Y | -30.56% |
| Forward P/E | 8.73 | EPS next Y | 80.00% |
| PEG | 1.83 | EPS past 5Y | -25.09% |
| P/S | 1.24 | EPS next 5Y | 12.00% |
| P/B | 0.54 | EPS Q/Q | -200.86% |
| Dividend | 6.11% | Sales Q/Q | -12.58% |
| Insider Own | 7.44% | Inst Own | 64.72% |
| Insider Trans | 2.17% | Inst Trans | -1.98% |
| Short Float | 0.20% | Earnings | Apr 25/a |
| Analyst Recom | 2.00 | Target Price | 6.00 |
| Avg Volume | 24.92K | 52W Range | 3.37 - 6.57 |
|
|
|
|
Riverview Bancorp, Inc. operates as a holding company. It provides community banking services to small and medium size businesses, professionals, and individuals. It offers a range of deposit products, including demand deposits, negotiable order of withdrawal accounts, money market accounts, savings accounts, certificates of deposit, and retirement savings plans. The company also provides commercial business, commercial real estate, other real estate mortgage, and real estate construction loans, and consumer loans, such as one-to-four family mortgage loans, home equity lines of credit, land loans, and other secured and unsecured consumer loans. In addition, it is involved in the provision of mortgage brokerage and mortgage loan servicing activities, as well as offering asset management services consisting of trust, estate planning, and investment management services. The company was founded in 1997 and is headquartered in Vancouver, WA. |
| Insider Trading |
Relationship |
Date |
Transaction |
Cost |
#Shares |
Value ($) |
#Shares Total |
SEC Form 4 |
| Eby Patricia | Director | Apr 30 '24 | Buy | 3.75 | 5,000 | 18,750 | 22,000 | May 01 07:25 PM | | Eby Patricia | Director | Apr 30 '24 | Buy | 3.75 | 2,000 | 7,500 | 4,400 | May 01 07:25 PM | | Carlson Bradley | Director | Feb 29 '24 | Buy | 4.70 | 1,021 | 4,799 | 19,421 | Mar 01 07:31 PM | | NIES GERALD LEE | Director | Feb 23 '24 | Buy | 4.84 | 22,000 | 106,590 | 190,692 | Feb 27 08:07 PM | | Carlson Bradley | Director | Feb 23 '24 | Buy | 4.80 | 1,000 | 4,800 | 18,400 | Feb 23 07:48 PM |
|
|
|
 |
| Market Cap | 8.05B | EPS (ttm) | 1.90 |
| P/E | 12.95 | EPS this Y | 7.68% |
| Forward P/E | 8.55 | EPS next Y | 8.53% |
| PEG | 0.29 | EPS past 5Y | -30.77% |
| P/S | 0.90 | EPS next 5Y | 44.12% |
| P/B | 0.81 | EPS Q/Q | 0.58% |
| Dividend | 0.00% | Sales Q/Q | -0.39% |
| Insider Own | 70.99% | Inst Own | 33.56% |
| Insider Trans | 20.21% | Inst Trans | 0.47% |
| Short Float | 2.81% | Earnings | May 08/b |
| Analyst Recom | 1.33 | Target Price | 34.40 |
| Avg Volume | 1.65M | 52W Range | 19.53 - 31.69 |
|
|
|
|
Operates as a holding company providing live entertainment |
| Insider Trading |
Relationship |
Date |
Transaction |
Cost |
#Shares |
Value ($) |
#Shares Total |
SEC Form 4 |
| BERKSHIRE HATHAWAY INC | 10% Owner | Apr 29 '24 | Buy | 25.47 | 311,637 | 7,936,272 | 70,002,897 | May 01 07:03 PM | | BERKSHIRE HATHAWAY INC | 10% Owner | Apr 26 '24 | Buy | 24.34 | 277,248 | 6,747,856 | 69,691,260 | Apr 26 08:20 PM | | BERKSHIRE HATHAWAY INC | 10% Owner | Apr 26 '24 | Buy | 24.46 | 219,303 | 5,364,327 | 35,182,219 | Apr 26 08:22 PM | | BERKSHIRE HATHAWAY INC | 10% Owner | Apr 25 '24 | Buy | 24.36 | 227,469 | 5,541,645 | 69,414,012 | Apr 26 08:20 PM | | BERKSHIRE HATHAWAY INC | 10% Owner | Apr 25 '24 | Buy | 24.43 | 157,309 | 3,842,681 | 34,962,916 | Apr 26 08:22 PM |
|
|
| |
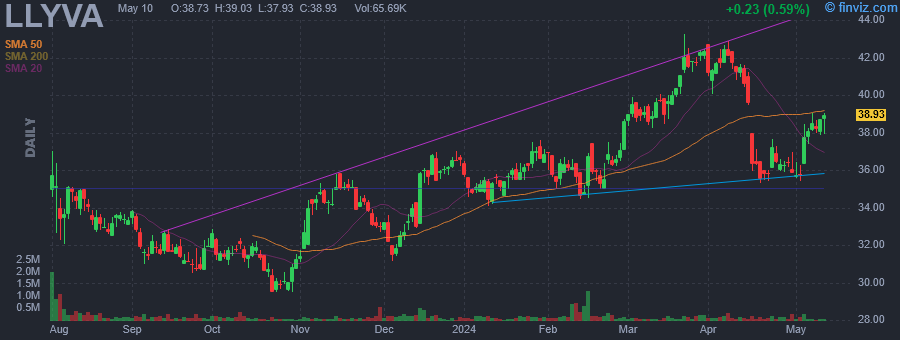 |
| Market Cap | 3.27B | EPS (ttm) | - |
| P/E | - | EPS this Y | - |
| Forward P/E | - | EPS next Y | - |
| PEG | - | EPS past 5Y | - |
| P/S | - | EPS next 5Y | - |
| P/B | - | EPS Q/Q | - |
| Dividend | - | Sales Q/Q | - |
| Insider Own | 97.32% | Inst Own | 26.39% |
| Insider Trans | 77.58% | Inst Trans | - |
| Short Float | 33.67% | Earnings | May 08/b |
| Analyst Recom | 1.00 | Target Price | 56.00 |
| Avg Volume | 197.38K | 52W Range | 29.48 - 43.24 |
|
|
|
|
Operates as a holding company providing live entertainment |
| Insider Trading |
Relationship |
Date |
Transaction |
Cost |
#Shares |
Value ($) |
#Shares Total |
SEC Form 4 |
| BERKSHIRE HATHAWAY INC | 10% Owner | Apr 29 '24 | Buy | 25.47 | 311,637 | 7,936,272 | 70,002,897 | May 01 07:03 PM | | BERKSHIRE HATHAWAY INC | 10% Owner | Apr 26 '24 | Buy | 24.34 | 277,248 | 6,747,856 | 69,691,260 | Apr 26 08:20 PM | | BERKSHIRE HATHAWAY INC | 10% Owner | Apr 26 '24 | Buy | 24.46 | 219,303 | 5,364,327 | 35,182,219 | Apr 26 08:22 PM | | BERKSHIRE HATHAWAY INC | 10% Owner | Apr 25 '24 | Buy | 24.36 | 227,469 | 5,541,645 | 69,414,012 | Apr 26 08:20 PM | | BERKSHIRE HATHAWAY INC | 10% Owner | Apr 25 '24 | Buy | 24.43 | 157,309 | 3,842,681 | 34,962,916 | Apr 26 08:22 PM |
|
|
|
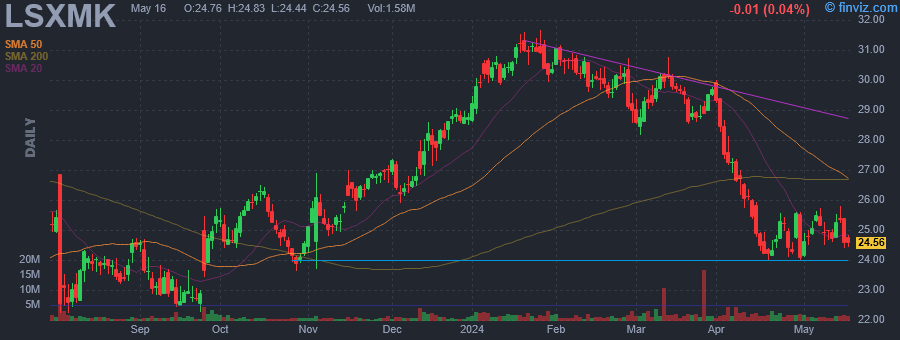 |
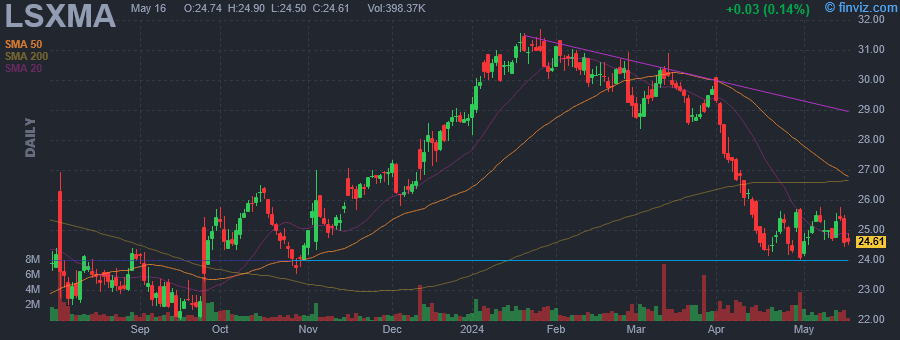
| Market Cap | 8.04B | EPS (ttm) | 1.90 |
| P/E | 12.93 | EPS this Y | 16.30% |
| Forward P/E | 8.01 | EPS next Y | 7.13% |
| PEG | 64.63 | EPS past 5Y | -30.77% |
| P/S | 0.90 | EPS next 5Y | 0.20% |
| P/B | 0.81 | EPS Q/Q | 0.58% |
| Dividend | - | Sales Q/Q | -0.39% |
| Insider Own | 40.03% | Inst Own | 65.03% |
| Insider Trans | 42.49% | Inst Trans | - |
| Short Float | 2.83% | Earnings | May 08/b |
| Analyst Recom | 1.00 | Target Price | 36.00 |
| Avg Volume | 2.35M | 52W Range | 20.75 - 31.67 |
|
|
|
|
Operates as a holding company providing live entertainment |
| Insider Trading |
Relationship |
Date |
Transaction |
Cost |
#Shares |
Value ($) |
#Shares Total |
SEC Form 4 |
| BERKSHIRE HATHAWAY INC | 10% Owner | Apr 29 '24 | Buy | 25.47 | 311,637 | 7,936,272 | 70,002,897 | May 01 07:03 PM | | BERKSHIRE HATHAWAY INC | 10% Owner | Apr 26 '24 | Buy | 24.34 | 277,248 | 6,747,856 | 69,691,260 | Apr 26 08:20 PM | | BERKSHIRE HATHAWAY INC | 10% Owner | Apr 26 '24 | Buy | 24.46 | 219,303 | 5,364,327 | 35,182,219 | Apr 26 08:22 PM | | BERKSHIRE HATHAWAY INC | 10% Owner | Apr 25 '24 | Buy | 24.36 | 227,469 | 5,541,645 | 69,414,012 | Apr 26 08:20 PM | | BERKSHIRE HATHAWAY INC | 10% Owner | Apr 25 '24 | Buy | 24.43 | 157,309 | 3,842,681 | 34,962,916 | Apr 26 08:22 PM |
|
|
|
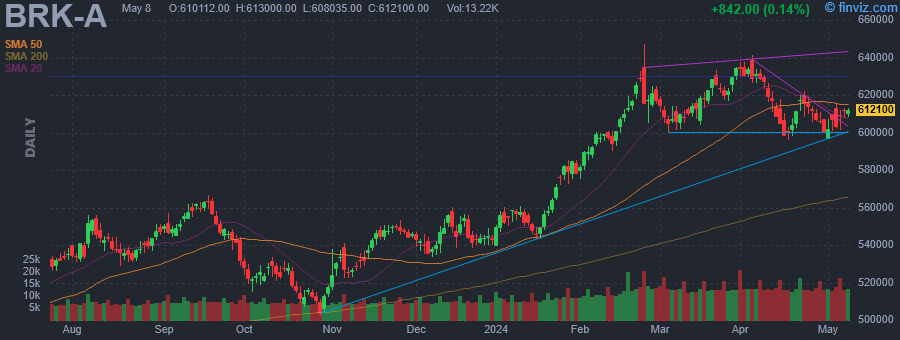 |
| Market Cap | 867.34B | EPS (ttm) | 66371.15 |
| P/E | 9.08 | EPS this Y | 6.48% |
| Forward P/E | 20.94 | EPS next Y | 4.88% |
| PEG | - | EPS past 5Y | 93.53% |
| P/S | 2.38 | EPS next 5Y | -14.50% |
| P/B | 1.55 | EPS Q/Q | 109.82% |
| Dividend | - | Sales Q/Q | 19.46% |
| Insider Own | 60.80% | Inst Own | 7.38% |
| Insider Trans | 0.00% | Inst Trans | - |
| Short Float | 0.07% | Earnings | Feb 24/a |
| Analyst Recom | 2.33 | Target Price | 683069.72 |
| Avg Volume | 13.67K | 52W Range | 482500.00 - 647039.00 |
|
|
|
|
Berkshire Hathaway, Inc. is a holding company, which engages in the provision of property and casualty insurance and reinsurance, utilities and energy, freight rail transportation, finance, manufacturing, and retailing services. It operates through the following segments: Insurance, Burlington Northern Santa Fe, LLC (BNSF), Berkshire Hathaway Energy (BHE), Pilot Travel Centers (PTC), Manufacturing, McLane, and Service and Retailing. The Insurance segment includes the underwriting of GEICO, Berkshire Hathaway Primary Group, and Berkshire Hathaway Reinsurance Group. The BNSF segment involves the operation of railroad systems. The BHE segment focuses on regulated electric and gas utility, power generation and distribution, and real estate brokerage activities. The PTC segment consists of managing travel centers and marketing of wholesale fuel. The Manufacturing segment refers to industrial, consumer and building products, home building, and related financial services. The McLane segment covers the wholesale distribution of groceries and non-food items. The Service and Retailing segment relates to the provision of shared aircraft ownership programs, aviation pilot training, electronic components distribution, retailing businesses, automobile dealerships and trailer, and furniture leasing services. The company was founded by Oliver Chace in 1839 and is headquartered in Omaha, NE. |
| Insider Trading |
Relationship |
Date |
Transaction |
Cost |
#Shares |
Value ($) |
#Shares Total |
SEC Form 4 |
| BERKSHIRE HATHAWAY INC | 10% Owner | Apr 29 '24 | Buy | 25.47 | 311,637 | 7,936,272 | 70,002,897 | May 01 07:03 PM | | BERKSHIRE HATHAWAY INC | 10% Owner | Apr 26 '24 | Buy | 24.34 | 277,248 | 6,747,856 | 69,691,260 | Apr 26 08:20 PM | | BERKSHIRE HATHAWAY INC | 10% Owner | Apr 26 '24 | Buy | 24.46 | 219,303 | 5,364,327 | 35,182,219 | Apr 26 08:22 PM | | BERKSHIRE HATHAWAY INC | 10% Owner | Apr 25 '24 | Buy | 24.36 | 227,469 | 5,541,645 | 69,414,012 | Apr 26 08:20 PM | | BERKSHIRE HATHAWAY INC | 10% Owner | Apr 25 '24 | Buy | 24.43 | 157,309 | 3,842,681 | 34,962,916 | Apr 26 08:22 PM |
|
|
|
