 |
| Market Cap | 1.89B | EPS (ttm) | 0.12 |
| P/E | 111.50 | EPS this Y | 522.22% |
| Forward P/E | 24.44 | EPS next Y | 87.85% |
| PEG | - | EPS past 5Y | - |
| P/S | 0.49 | EPS next 5Y | - |
| P/B | 2.89 | EPS Q/Q | 171.29% |
| Dividend | - | Sales Q/Q | 30.04% |
| Insider Own | 12.20% | Inst Own | 63.96% |
| Insider Trans | 0.08% | Inst Trans | -0.23% |
| Short Float | 13.78% | Earnings | May 02/a |
| Analyst Recom | 3.60 | Target Price | 11.63 |
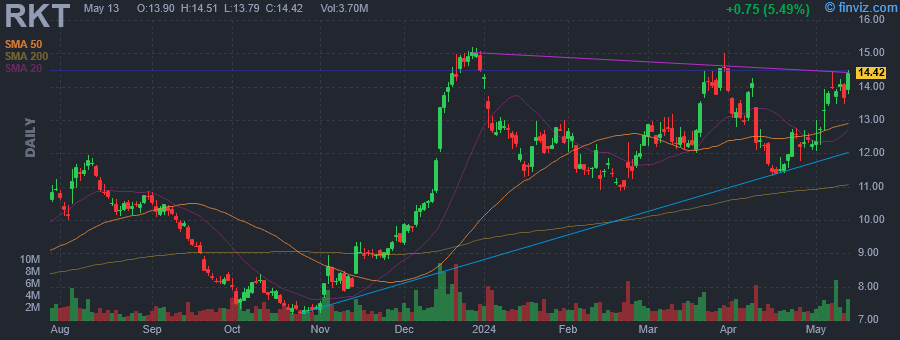
| Avg Volume | 2.51M | 52W Range | 7.17 - 15.60 |
|
|
|
|
Rocket Cos., Inc. engages in the provision of a suite of services related to homeownership and other personal financial transactions. It operates through the following segments: Direct to Consumer and Partner Network. The Direct to Consumer segment consists of performance marketing and direct engagement through the Rocket Mortgage App. The Partner Network Segment focuses on partnerships with premier consumer-focused organizations, brokers and mortgage professionals who leverage the platform and scale to provide mortgage solutions to clients. The company was founded by Daniel Gilbert in 1985 and is headquartered in Detroit, MI. |
| Insider Trading |
Relationship |
Date |
Transaction |
Cost |
#Shares |
Value ($) |
#Shares Total |
SEC Form 4 |
| Rizik Matthew | Director | May 29 '24 | Buy | 13.64 | 315 | 4,297 | 702,180 | May 29 05:31 PM | | Rizik Matthew | Director | May 28 '24 | Buy | 13.83 | 316 | 4,370 | 701,865 | May 29 05:31 PM | | Rizik Matthew | Director | May 23 '24 | Buy | 13.80 | 311 | 4,292 | 701,549 | May 24 05:08 PM | | Rizik Matthew | Director | May 22 '24 | Buy | 14.33 | 301 | 4,313 | 701,238 | May 22 06:05 PM | | Rizik Matthew | Director | May 21 '24 | Buy | 14.39 | 299 | 4,303 | 700,937 | May 22 06:05 PM |
|
|
 |
 |
| Market Cap | 66.18M | EPS (ttm) | 0.66 |
| P/E | 38.82 | EPS this Y | 101.72% |
| Forward P/E | 198.08 | EPS next Y | 420.00% |
| PEG | - | EPS past 5Y | -34.75% |
| P/S | 0.02 | EPS next 5Y | - |
| P/B | 0.72 | EPS Q/Q | 75.45% |
| Dividend | 3.73% | Sales Q/Q | 1.67% |
| Insider Own | 2.43% | Inst Own | 56.85% |
| Insider Trans | 1.57% | Inst Trans | -2.93% |
| Short Float | 0.44% | Earnings | May 08/a |
| Analyst Recom | 1.00 | Target Price | 43.50 |
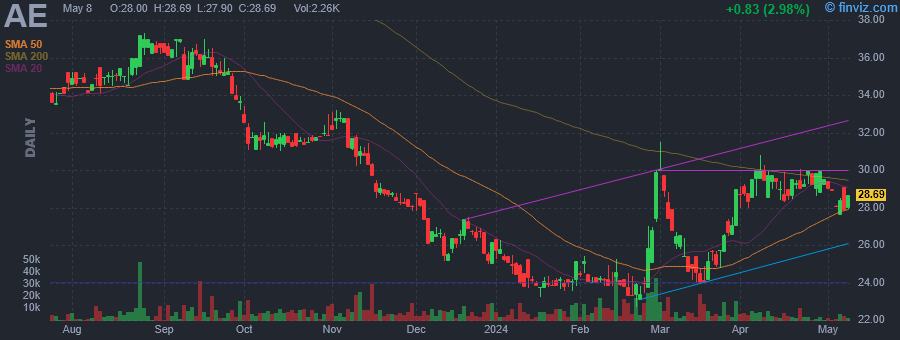
| Avg Volume | 6.44K | 52W Range | 22.67 - 37.30 |
|
|
|
|
Adams Resources & Energy, Inc. engages in the business of crude oil marketing, transportation and storage in various crude oil and natural gas basins. It operates through the following segments: crude oil marketing, transportation and storage, tank truck transportation of liquid chemicals, pressurized gases, asphalt and dry bulk, and pipeline transportation, terminalling and storage of crude oil. The company was founded by Kenneth Stanley Adams, Jr. in 1947 and is headquartered in Houston, TX. |
| Insider Trading |
Relationship |
Date |
Transaction |
Cost |
#Shares |
Value ($) |
#Shares Total |
SEC Form 4 |
| Niemann John O. Jr. | Director | May 29 '24 | Buy | 26.00 | 400 | 10,400 | 5,267 | May 29 05:26 PM | | Roycraft Kevin J. | CEO & President | Mar 26 '24 | Buy | 27.40 | 150 | 4,110 | 9,362 | Mar 26 05:02 PM | | Harrison Wade M | President, Service Transport | Mar 26 '24 | Buy | 26.99 | 48 | 1,296 | 3,306 | Mar 26 05:04 PM | | Roycraft Kevin J. | CEO & President | Mar 18 '24 | Buy | 24.50 | 137 | 3,356 | 9,212 | Mar 18 04:12 PM | | Niemann John O. Jr. | Director | Mar 01 '24 | Option Exercise | 0.00 | 366 | 0 | 4,867 | Mar 04 05:58 PM |
|
|
|
 |
| Market Cap | 1.35B | EPS (ttm) | 1.59 |
| P/E | 5.01 | EPS this Y | -3.77% |
| Forward P/E | 6.28 | EPS next Y | 12.01% |
| PEG | 0.35 | EPS past 5Y | 4.07% |
| P/S | 1.12 | EPS next 5Y | 14.21% |
| P/B | 0.59 | EPS Q/Q | -279.71% |
| Dividend | 14.75% | Sales Q/Q | -1.03% |
| Insider Own | 0.99% | Inst Own | 59.79% |
| Insider Trans | 2.09% | Inst Trans | 2.56% |
| Short Float | 6.69% | Earnings | May 08/a |
| Analyst Recom | 2.75 | Target Price | 10.07 |
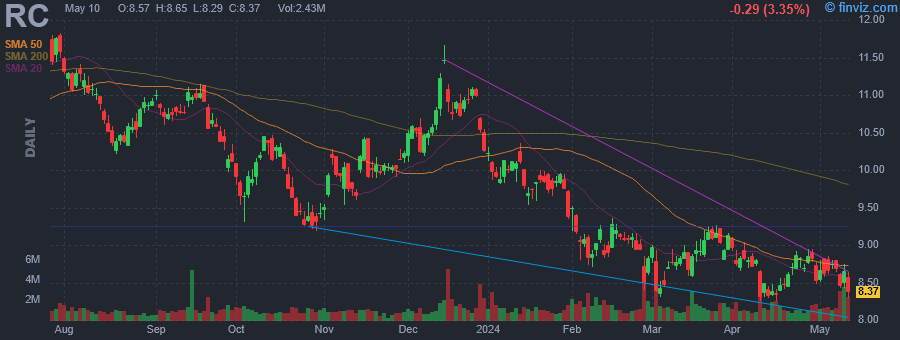
| Avg Volume | 1.43M | 52W Range | 8.25 - 11.97 |
|
|
|
|
Ready Capital Corp. is a real estate finance company, which engages in acquiring, managing, and financing small balance commercial loans. It operates through the following segments: SBC Lending and Acquisitions, Small Business Lending, and Residential Mortgage Banking. The SBC Lending and Acquisitions segment is involved in the SBC loans across the full life-cycle of an SBC property including construction, bridge, stabilized, and agency loan origination channels through wholly-owned subsidiary, ReadyCap Commercial, LLC. The Small Business Lending segment acquires, originates, and services owner-occupied loans guaranteed by the SBA under its SBA Section 7(a) Program through wholly-owned subsidiary, ReadyCap Lending, LLC. The Residential Mortgage Banking segment focuses on the residential mortgage loan origination segment through wholly-owned subsidiary, GMFS, LLC. The company was founded in November 2011 and is headquartered in New York, NY. |
| Insider Trading |
Relationship |
Date |
Transaction |
Cost |
#Shares |
Value ($) |
#Shares Total |
SEC Form 4 |
| NATHAN GILBERT E | Director | May 24 '24 | Buy | 8.29 | 10,000 | 82,860 | 95,249 | May 29 05:25 PM | | NATHAN GILBERT E | Director | Mar 22 '24 | Buy | 9.12 | 7,000 | 63,832 | 7,000 | Mar 26 02:26 PM | | NATHAN GILBERT E | Director | Mar 22 '24 | Buy | 9.13 | 2,150 | 19,629 | 85,249 | Mar 26 02:26 PM | | NATHAN GILBERT E | Director | Mar 14 '24 | Buy | 8.65 | 10,000 | 86,475 | 83,099 | Mar 18 01:00 PM | | LUEBBERS KEVIN M | Director | Mar 05 '24 | Buy | 8.43 | 5,000 | 42,148 | 119,925 | Mar 06 06:38 PM |
|
|
| |
 |
| Market Cap | 37.32M | EPS (ttm) | -1.42 |
| P/E | - | EPS this Y | 60.52% |
| Forward P/E | - | EPS next Y | 85.00% |
| PEG | - | EPS past 5Y | -64.63% |
| P/S | 0.11 | EPS next 5Y | - |
| P/B | 0.72 | EPS Q/Q | 13.23% |
| Dividend | - | Sales Q/Q | -9.08% |
| Insider Own | 37.82% | Inst Own | 21.52% |
| Insider Trans | -5.71% | Inst Trans | -11.57% |
| Short Float | 1.72% | Earnings | May 09/a |
| Analyst Recom | 1.00 | Target Price | 4.50 |
| Avg Volume | 74.56K | 52W Range | 1.32 - 8.20 |
|
|
|
|
Fathom Holdings, Inc. is a national, technology driven, end to end real estate services company, which engages in the provision of residential, brokerage, mortgage, title, insurance, and SaaS offerings for brokers and agents. It operates through the following segments: Real Estate Brokerage, Mortgage, Technology, and Corporate and Other Services. The company was founded by Joshua Harley in January 2010 and is headquartered in Cary, NC. |
| Insider Trading |
Relationship |
Date |
Transaction |
Cost |
#Shares |
Value ($) |
#Shares Total |
SEC Form 4 |
| Flanders Scott N | Director | May 29 '24 | Buy | 1.75 | 700 | 1,225 | 602,215 | May 29 04:53 PM | | Flanders Scott N | Director | May 24 '24 | Buy | 1.70 | 3,066 | 5,203 | 601,515 | May 29 04:53 PM | | Flanders Scott N | Director | May 23 '24 | Buy | 1.53 | 2,114 | 3,234 | 598,449 | May 23 05:39 PM | | Flanders Scott N | Director | May 22 '24 | Buy | 1.65 | 25,000 | 41,250 | 596,335 | May 23 05:39 PM | | Flanders Scott N | Director | May 21 '24 | Buy | 1.65 | 1,251 | 2,059 | 571,335 | May 23 05:39 PM |
|
|
|
 |
| Market Cap | 630.94M | EPS (ttm) | -1.59 |
| P/E | - | EPS this Y | 0.98% |
| Forward P/E | - | EPS next Y | 19.06% |
| PEG | - | EPS past 5Y | - |
| P/S | 0.69 | EPS next 5Y | 36.48% |
| P/B | 0.23 | EPS Q/Q | -155.46% |
| Dividend | 4.47% | Sales Q/Q | -15.19% |
| Insider Own | 3.58% | Inst Own | 106.40% |
| Insider Trans | -2.88% | Inst Trans | -2.82% |
| Short Float | 16.84% | Earnings | May 01/a |
| Analyst Recom | 2.31 | Target Price | 7.35 |
| Avg Volume | 2.23M | 52W Range | 4.05 - 9.85 |
|
|
|
|
Hudson Pacific Properties, Inc. is a real estate company, which acquires, repositions, develops, and operates sustainable office and state of-the-art studio properties in high-barrier-to-entry submarkets in California, the Pacific Northwest, Western Canada, and Greater London, United Kingdom. It operates through the Office Properties and Studio Properties segments. The Office Properties segment manages office properties located in California and the Pacific Northwest. The Studio Properties segment is primarily used for the physical production of media content, such as television programs, feature films, commercials, music videos and photographs. The company was founded by Victor J. Coleman in 2006 and is headquartered in Los Angeles, CA. |
| Insider Trading |
Relationship |
Date |
Transaction |
Cost |
#Shares |
Value ($) |
#Shares Total |
SEC Form 4 |
| LAMMAS MARK T | President | May 29 '24 | Buy | 4.31 | 5,800 | 24,998 | 119,157 | May 29 04:42 PM | | Diramerian Harout Krikor | Chief Financial Officer | May 29 '24 | Buy | 4.29 | 2,325 | 9,974 | 53,246 | May 29 04:41 PM | | COLEMAN VICTOR J | Chief Executive Officer | May 22 '24 | Sale | 5.18 | 100,000 | 517,564 | 387,451 | May 24 07:58 PM | | COLEMAN VICTOR J | Chief Executive Officer | May 14 '24 | Sale | 5.72 | 127,918 | 731,691 | 487,451 | May 16 04:09 PM | | SHOLEM BARRY A | Director | Feb 22 '24 | Buy | 6.69 | 40,000 | 267,600 | 110,176 | Feb 22 07:34 PM |
|
|
| |
 |
| Market Cap | 54.53M | EPS (ttm) | -3.94 |
| P/E | - | EPS this Y | - |
| Forward P/E | - | EPS next Y | - |
| PEG | - | EPS past 5Y | - |
| P/S | 7.48 | EPS next 5Y | - |
| P/B | 1.59 | EPS Q/Q | -98.79% |
| Dividend | - | Sales Q/Q | 49.87% |
| Insider Own | 46.49% | Inst Own | 6.94% |
| Insider Trans | 1.69% | Inst Trans | 185.68% |
| Short Float | 3.33% | Earnings | Nov 14/a |
| Analyst Recom | 3.00 | Target Price | 1.00 |
| Avg Volume | 573.92K | 52W Range | 0.40 - 3.25 |
|
|
|
|
Palladyne AI Corp. engages in the design, development, and manufacture of industrial robotic systems that augment human performance by combining human intelligence, instinct, and judgment with the strength, endurance, and precision of machines to enhance employee safety and productivity. Its mobile robotic systems include the Guardian S, Guardian GT, Guardian XO, and Guardian XT. The company was founded in 2015 and is headquartered in Salt Lake City, UT. |
| Insider Trading |
Relationship |
Date |
Transaction |
Cost |
#Shares |
Value ($) |
#Shares Total |
SEC Form 4 |
| WEIBLING DENNIS M | Director | May 28 '24 | Buy | 1.84 | 23,976 | 44,022 | 150,000 | May 29 04:38 PM | | WEIBLING DENNIS M | Director | May 24 '24 | Buy | 1.99 | 15,926 | 31,723 | 126,024 | May 28 05:29 PM | | Wolff Benjamin G | PRESIDENT & CEO | May 22 '24 | Buy | 1.96 | 8,000 | 15,680 | 1,287,946 | May 23 04:30 PM | | WEIBLING DENNIS M | Director | May 22 '24 | Buy | 1.95 | 7,208 | 14,078 | 110,098 | May 23 04:32 PM | | WEIBLING DENNIS M | Director | May 21 '24 | Buy | 1.80 | 2,890 | 5,202 | 102,890 | May 22 04:46 PM |
|
|
|
 |
| Market Cap | 49.13B | EPS (ttm) | 4.59 |
| P/E | 42.78 | EPS this Y | 14.72% |
| Forward P/E | 23.89 | EPS next Y | 15.43% |
| PEG | 2.72 | EPS past 5Y | 11.53% |
| P/S | 4.67 | EPS next 5Y | 15.73% |
| P/B | - | EPS Q/Q | 35.70% |
| Dividend | 0.32% | Sales Q/Q | 12.21% |
| Insider Own | 2.08% | Inst Own | 96.38% |
| Insider Trans | -0.79% | Inst Trans | -2.94% |
| Short Float | 1.33% | Earnings | Apr 24/b |
| Analyst Recom | 2.27 | Target Price | 217.37 |
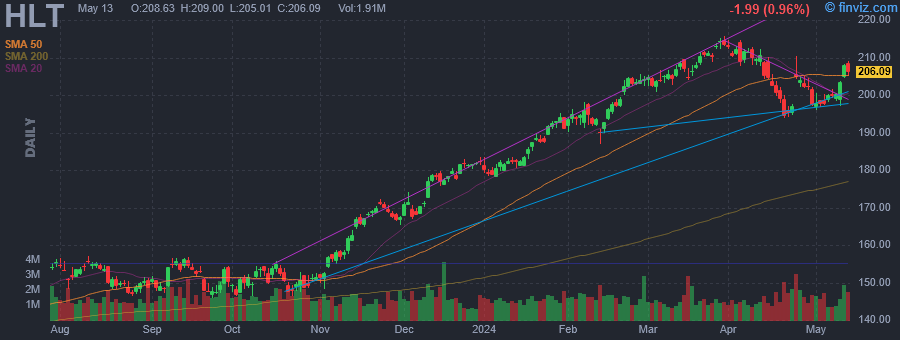
| Avg Volume | 1.54M | 52W Range | 134.43 - 215.79 |
|
|
|
|
Hilton Worldwide Holdings, Inc. engages in the provision of hospitality businesses. It operates through the Management and Franchise, and Ownership segments. The Management and Franchise segment operates hotels of third-party owners. The Ownership segment includes owned, leased, and joint venture hotels. The company was founded by Conrad N. Hilton in 1925 and is headquartered in McLean, VA. |
| Insider Trading |
Relationship |
Date |
Transaction |
Cost |
#Shares |
Value ($) |
#Shares Total |
SEC Form 4 |
| Healey Melanie | Director | May 28 '24 | Buy | 199.65 | 2,000 | 399,299 | 14,938 | May 29 04:34 PM | | NASSETTA CHRISTOPHER J | See Remarks | Feb 09 '24 | Option Exercise | 45.46 | 53,488 | 2,431,564 | 2,589,966 | Feb 09 04:46 PM | | NASSETTA CHRISTOPHER J | See Remarks | Feb 09 '24 | Sale | 192.83 | 22,095 | 4,260,653 | 2,567,871 | Feb 09 04:46 PM | | NASSETTA CHRISTOPHER J | See Remarks | Feb 08 '24 | Option Exercise | 45.46 | 21,489 | 976,890 | 2,557,967 | Feb 09 04:46 PM | | NASSETTA CHRISTOPHER J | See Remarks | Feb 08 '24 | Sale | 195.68 | 21,489 | 4,205,070 | 2,536,478 | Feb 09 04:46 PM |
|
|
| |
 |
| Market Cap | 327.41M | EPS (ttm) | -0.89 |
| P/E | - | EPS this Y | -11.61% |
| Forward P/E | - | EPS next Y | 6.31% |
| PEG | - | EPS past 5Y | -70.68% |
| P/S | 1.67 | EPS next 5Y | - |
| P/B | 2.59 | EPS Q/Q | -31.91% |
| Dividend | - | Sales Q/Q | 21.12% |
| Insider Own | 29.09% | Inst Own | 66.61% |
| Insider Trans | 6.40% | Inst Trans | 10.85% |
| Short Float | 10.35% | Earnings | May 07/a |
| Analyst Recom | 3.00 | Target Price | 6.83 |
| Avg Volume | 1.01M | 52W Range | 3.92 - 27.41 |
|
|
|
|
Treace Medical Concepts, Inc. engages in the design, manufacture, and marketing of orthopedic medical devices and biologic solutions. It offers Lapiplasty, a bunion surgery for three-dimensional bunion correction. It operates and distributes its products and services under the following trademarks: Treace Medical Concepts, Lapiplasty, Fast Grafter, Align My Toe, The Future of Hallux Valgus, Fix It Right The First Time, and Plantar Python. The company was founded by John T. Treace in July 2013 and is headquartered in Ponte Vedra Beach, FL. |
| Insider Trading |
Relationship |
Date |
Transaction |
Cost |
#Shares |
Value ($) |
#Shares Total |
SEC Form 4 |
| TREACE JAMES T | Director | May 28 '24 | Buy | 5.07 | 50,000 | 253,475 | 1,089,441 | May 29 04:33 PM | | MOTT RICHARD W | Director | May 22 '24 | Buy | 4.99 | 12,100 | 60,425 | 1,054,944 | May 23 04:30 PM | | Treace John T. | Chief Executive Officer | May 17 '24 | Buy | 5.56 | 100,000 | 556,170 | 6,343,095 | May 20 04:30 PM | | Treace John T. | Chief Executive Officer | May 14 '24 | Buy | 5.12 | 150,000 | 767,805 | 6,243,095 | May 14 06:19 PM | | Kiernan Jane E | Director | May 14 '24 | Buy | 5.17 | 19,356 | 100,001 | 24,941 | May 14 06:20 PM |
|
|
|
 |
| Market Cap | 141.31M | EPS (ttm) | 3.83 |
| P/E | 6.68 | EPS this Y | -59.93% |
| Forward P/E | 11.23 | EPS next Y | 27.02% |
| PEG | - | EPS past 5Y | 6.22% |
| P/S | 1.09 | EPS next 5Y | - |
| P/B | 0.81 | EPS Q/Q | -60.07% |
| Dividend | 5.16% | Sales Q/Q | 0.59% |
| Insider Own | 5.06% | Inst Own | 59.96% |
| Insider Trans | 6.32% | Inst Trans | -1.53% |
| Short Float | 3.22% | Earnings | Apr 30/a |
| Analyst Recom | 3.00 | Target Price | 26.75 |
| Avg Volume | 21.51K | 52W Range | 23.32 - 33.58 |
|
|
|
|
Evans Bancorp, Inc. is a bank holding company, which engages in the provision of financial solutions. It operates through the Banking Activities and Insurance Agency Activities segments. The Banking Activities segment offers consumer and commercial banking services such as lending, deposits, annuities, and mutual funds. The Insurance Agency Activities segment includes insurance policies on a commission basis, surety bonds, risk management, and disability reinsurance products. The company was founded on October 28, 1988 and is headquartered in Williamsville, NY. |
| Insider Trading |
Relationship |
Date |
Transaction |
Cost |
#Shares |
Value ($) |
#Shares Total |
SEC Form 4 |
| PL Capital Advisors, LLC | 10% Owner | May 28 '24 | Buy | 26.12 | 21,061 | 550,185 | 576,633 | May 29 04:24 PM | | PL Capital Advisors, LLC | 10% Owner | May 23 '24 | Buy | 27.75 | 2,776 | 77,034 | 555,572 | May 24 05:10 PM | | NASCA DAVID J | President and CEO | Mar 21 '24 | Option Exercise | 30.09 | 798 | 24,012 | 97,188 | Mar 22 02:56 PM | | Connerton John B | Treasurer | Mar 21 '24 | Option Exercise | 30.09 | 313 | 9,418 | 16,815 | Mar 22 02:55 PM | | Connerton John B | Treasurer | Mar 18 '24 | Sale | 29.12 | 3,146 | 91,612 | 16,304 | Mar 19 01:58 PM |
|
|
|
 |
| Market Cap | 74.98M | EPS (ttm) | 1.26 |
| P/E | 11.68 | EPS this Y | - |
| Forward P/E | - | EPS next Y | - |
| PEG | - | EPS past 5Y | 9.96% |
| P/S | 0.91 | EPS next 5Y | - |
| P/B | 0.68 | EPS Q/Q | -44.75% |
| Dividend | 3.79% | Sales Q/Q | 10.93% |
| Insider Own | 20.61% | Inst Own | 33.52% |
| Insider Trans | 2.20% | Inst Trans | -0.49% |
| Short Float | 0.07% | Earnings | Jan 30/a |
| Analyst Recom | - | Target Price | - |
| Avg Volume | 3.54K | 52W Range | 13.49 - 22.33 |
|
|
|
|
Old Point Financial Corp. operates as a bank holding company, which engages in the provision of banking services through its subsidiaries. It offers various consumer, mortgage, and business banking services, including loan, deposit, and cash management services. The company was founded on February 16, 1984 and is headquartered in Hampton, VA. |
| Insider Trading |
Relationship |
Date |
Transaction |
Cost |
#Shares |
Value ($) |
#Shares Total |
SEC Form 4 |
| PL Capital Advisors, LLC | 10% Owner | May 28 '24 | Buy | 14.92 | 1,799 | 26,835 | 627,020 | May 29 04:22 PM | | PL Capital Advisors, LLC | 10% Owner | May 17 '24 | Buy | 14.92 | 2,101 | 31,356 | 625,221 | May 20 04:30 PM | | PL Capital Advisors, LLC | 10% Owner | May 15 '24 | Buy | 14.17 | 871 | 12,346 | 623,120 | May 16 04:42 PM | | PL Capital Advisors, LLC | 10% Owner | May 14 '24 | Buy | 14.25 | 17,403 | 247,961 | 622,249 | May 16 04:42 PM | | WITT JOSEPH R | President/Financial Svcs, CSO | May 10 '24 | Buy | 14.25 | 180 | 2,565 | 21,906 | May 13 11:02 AM |
|
|
|
