 |
| Market Cap | 453.14M | EPS (ttm) | 3.73 |
| P/E | 7.39 | EPS this Y | -32.58% |
| Forward P/E | 10.69 | EPS next Y | 5.71% |
| PEG | - | EPS past 5Y | 17.31% |
| P/S | 1.70 | EPS next 5Y | - |
| P/B | 1.11 | EPS Q/Q | 21.96% |
| Dividend | 1.94% | Sales Q/Q | 20.64% |
| Insider Own | 25.55% | Inst Own | 31.31% |
| Insider Trans | -4.68% | Inst Trans | 7.49% |
| Short Float | 0.35% | Earnings | Apr 25/a |
| Analyst Recom | 1.25 | Target Price | 32.00 |
| Avg Volume | 29.24K | 52W Range | 19.87 - 30.22 |
|
|
|
|
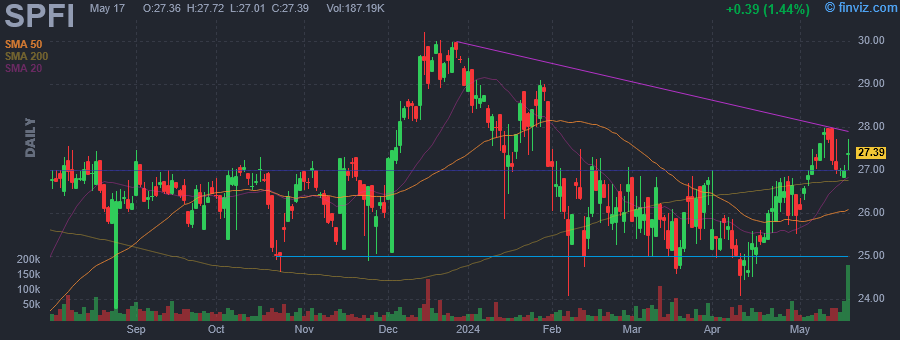
South Plains Financial, Inc. is a bank holding company, which engages in the provision of commercial and consumer financial services. The firm also offers commercial and retail banking, along with insurance, investment, trust, and mortgage services. It operates under the Community Banking and Insurance segments. The Community Banking segment focuses on City Bank, the sole banking subsidiary of the company. The Insurance segment includes Windmark Insurance Agency, Inc. (Windmark). The company was founded on October 28, 1992 and is headquartered in Lubbock, TX. |
| Insider Trading |
Relationship |
Date |
Transaction |
Cost |
#Shares |
Value ($) |
#Shares Total |
SEC Form 4 |
| Valles Noe G | Director | May 06 '24 | Buy | 25.00 | 40,000 | 1,000,000 | 285,512 | May 08 03:32 PM | | Griffith Curtis C | Chairman and CEO | May 06 '24 | Sale | 25.00 | 40,000 | 1,000,000 | 1,063,797 | May 08 03:40 PM | | Griffith Curtis C | Chairman and CEO | Mar 12 '24 | Sale | 24.75 | 100,000 | 2,475,000 | 1,103,797 | Mar 13 06:51 PM | | Griffith Curtis C | Chairman and CEO | Mar 08 '24 | Sale | 25.27 | 24,160 | 610,523 | 1,203,797 | Mar 08 04:45 PM | | Griffith Curtis C | Chairman and CEO | Mar 07 '24 | Sale | 25.45 | 19,574 | 498,244 | 1,227,957 | Mar 08 04:45 PM |
|
|
 |
 |
| Market Cap | 899.76M | EPS (ttm) | 0.08 |
| P/E | 217.89 | EPS this Y | 1191.88% |
| Forward P/E | - | EPS next Y | -105.32% |
| PEG | 8.93 | EPS past 5Y | -29.82% |
| P/S | 3.16 | EPS next 5Y | 24.40% |
| P/B | 0.95 | EPS Q/Q | -202.20% |
| Dividend | 0.61% | Sales Q/Q | -3.40% |
| Insider Own | 15.78% | Inst Own | 53.16% |
| Insider Trans | 0.36% | Inst Trans | -1.03% |
| Short Float | 1.92% | Earnings | May 03/b |
| Analyst Recom | 2.50 | Target Price | 26.00 |
| Avg Volume | 174.48K | 52W Range | 11.87 - 25.51 |
|
|
|
|
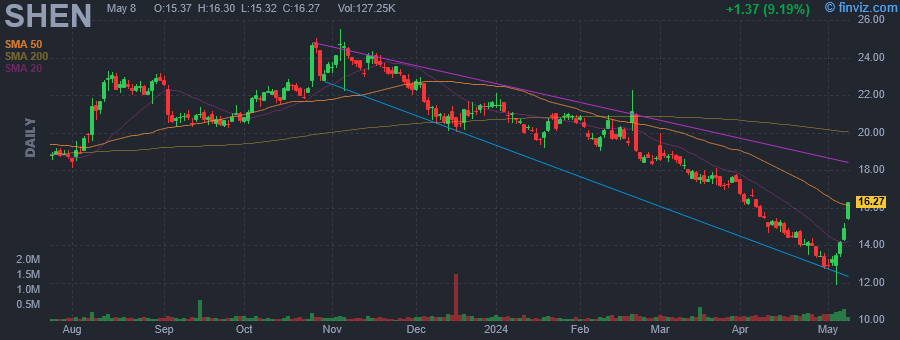
Shenandoah Telecommunications Co. is a holding company, which engages in the provision of regulated and unregulated telecommunication services to end-user customers and other telecommunications providers. It offers voice, video and data communications services. It operates through the Broadband and Tower segments. The Broadband segment provides broadband, video, and voice services to residential and commercial customers in portions of Virginia, West Virginia, Maryland, and Kentucky, via fiber optic and hybrid fiber coaxial ("HFC") cable. The Tower segment leases space on 225 owned cell towers. The company was founded in 1902 and is headquartered in Edinburg, VA. |
| Insider Trading |
Relationship |
Date |
Transaction |
Cost |
#Shares |
Value ($) |
#Shares Total |
SEC Form 4 |
| FRENCH CHRISTOPHER E | President & CEO | May 07 '24 | Buy | 14.69 | 11,000 | 161,560 | 319,750 | May 08 10:55 AM | | McKay Edward H | Executive VP & COO | May 07 '24 | Buy | 14.95 | 10,000 | 149,450 | 66,951 | May 07 07:48 PM | | FRENCH CHRISTOPHER E | President & CEO | May 07 '24 | Buy | 14.59 | 5,000 | 72,930 | 69,629 | May 08 10:55 AM | | MASON RICHARD W JR | SVP Engineering & Operations | May 07 '24 | Buy | 14.73 | 2,000 | 29,467 | 14,501 | May 07 07:44 PM | | Fitzsimmons Tracy | Director | May 07 '24 | Buy | 14.93 | 1,694 | 25,291 | 38,942 | May 08 07:39 AM |
|
|
|
 |
| Market Cap | 3.41B | EPS (ttm) | -0.78 |
| P/E | - | EPS this Y | 85.02% |
| Forward P/E | - | EPS next Y | 54.25% |
| PEG | - | EPS past 5Y | - |
| P/S | 3.88 | EPS next 5Y | 0.21% |
| P/B | 1.49 | EPS Q/Q | -43.99% |
| Dividend | 4.38% | Sales Q/Q | -0.99% |
| Insider Own | 0.70% | Inst Own | 88.84% |
| Insider Trans | -6.24% | Inst Trans | -3.05% |
| Short Float | 5.64% | Earnings | Apr 30/b |
| Analyst Recom | 3.47 | Target Price | 15.62 |
| Avg Volume | 2.08M | 52W Range | 8.90 - 17.69 |
|
|
|
May-07-24 07:44PM
|
Analyst Report: The Macerich Company
(Morningstar Research) |
|
01:58PM
|
Hedge Fund and Insider Trading News: Stanley Druckenmiller, Ken Griffin, David Einhorn, Dan Loeb, Harris Kupperman, Shah Capital Management, Macerich Co (MAC), Sensata Technologies Holding PLC (ST), and More
(Insider Monkey) |
|
May-06-24 07:01PM
|
Insider Buying: President and CEO Jackson Hsieh Acquires 140,000 Shares of Macerich Co (MAC)
(GuruFocus.com) |
|
03:26PM
|
Macerich Insider Bought Shares Worth $1,996,820, According to a Recent SEC Filing
(MT Newswires) |
|
May-01-24 08:02PM
|
Analyst Report: The Macerich Company
(Morningstar Research) |
|
12:13PM
|
Macerich (MAC) Stock Declines on Q1 FFO Miss, Revenues Fall Y/Y
(Zacks) |
|
11:10AM
|
The Macerich Company (NYSE:MAC) Q1 2024 Earnings Call Transcript
(Insider Monkey) |
|
08:45AM
|
Piper Sandler Downgrades Macerich to Underweight From Neutral, Adjusts PT to $11 From $17
(MT Newswires) |
|
04:49AM
|
Q1 2024 Macerich Co Earnings Call
(Thomson Reuters StreetEvents) |
|
03:23AM
|
Macerich Co (MAC) (Q1 2024) Earnings Call Transcript Highlights: Navigating Challenges with ...
(GuruFocus.com) |
|
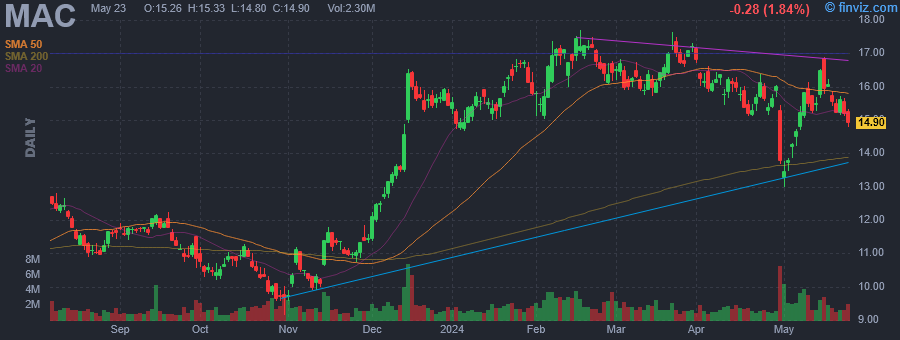
Macerich Co. operates as a real estate investment trust, which engages in the acquisition, ownership, development, redevelopment, management, and leasing of regional and community shopping centers located throughout the United States. The company was founded by Mace Siegel Dana K. Anderson, Arthur M. Coppola and Edward C. Coppola in 1964 and is headquartered in Santa Monica, CA. |
| Insider Trading |
Relationship |
Date |
Transaction |
Cost |
#Shares |
Value ($) |
#Shares Total |
SEC Form 4 |
| Healey Doug J | Senior EVP, Head of Leasing | May 07 '24 | Buy | 15.20 | 7,500 | 114,000 | 78,487 | May 08 02:13 PM | | Hsieh Jackson | President and CEO | May 06 '24 | Buy | 14.26 | 140,000 | 1,996,820 | 170,500 | May 06 03:20 PM | | COPPOLA EDWARD C | Director | Mar 28 '24 | Sale | 17.19 | 75,000 | 1,289,250 | 560,667 | Mar 29 04:53 PM | | COPPOLA EDWARD C | Director | Mar 27 '24 | Sale | 17.01 | 20,000 | 340,200 | 635,667 | Mar 29 04:53 PM | | O HERN THOMAS E | Director | Mar 20 '24 | Sale | 16.94 | 95,000 | 1,609,300 | 102,900 | Mar 22 06:07 PM |
|
|
| |
 |
| Market Cap | 74.54M | EPS (ttm) | -2.02 |
| P/E | - | EPS this Y | -17.78% |
| Forward P/E | 19.58 | EPS next Y | 158.49% |
| PEG | - | EPS past 5Y | - |
| P/S | 0.12 | EPS next 5Y | 3.00% |
| P/B | 9.43 | EPS Q/Q | -103.91% |
| Dividend | - | Sales Q/Q | -14.14% |
| Insider Own | 16.34% | Inst Own | 40.83% |
| Insider Trans | 12.13% | Inst Trans | 1.26% |
| Short Float | 3.65% | Earnings | May 02/b |
| Analyst Recom | 1.00 | Target Price | 45.00 |
| Avg Volume | 36.97K | 52W Range | 7.56 - 15.89 |
|
|
|
|
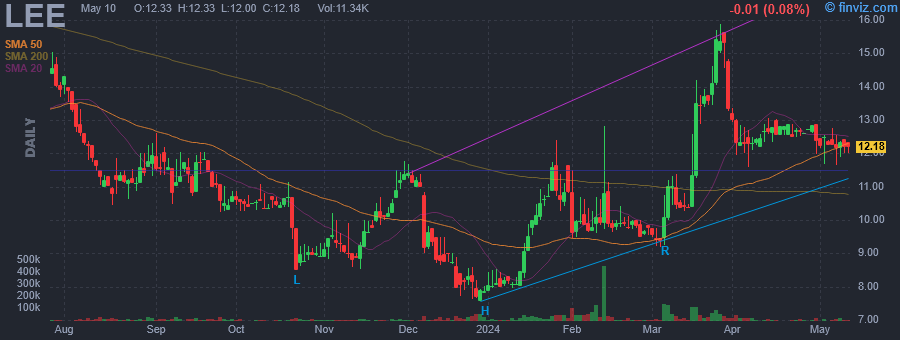
Lee Enterprises, Inc. engages in the provision of local news, information, and advertising services. It also offers retail, classified, digital, national advertising, and niche publications. Its digital products include video, digital couponing, behavioral targeting, banner advertisements, and social networking. The company was founded by Alfred Wilson Lee in 1890 and is headquartered in Davenport, IA. |
| Insider Trading |
Relationship |
Date |
Transaction |
Cost |
#Shares |
Value ($) |
#Shares Total |
SEC Form 4 |
| Fletcher Steven C. | Director | May 07 '24 | Buy | 12.37 | 1,000 | 12,370 | 6,000 | May 08 01:00 PM | | Quint Digital Ltd | 10% Owner | Mar 26 '24 | Buy | 15.61 | 17,000 | 265,350 | 763,000 | Mar 27 09:42 AM | | Quint Digital Ltd | 10% Owner | Mar 25 '24 | Buy | 14.92 | 20,000 | 298,430 | 746,000 | Mar 27 09:26 AM | | Quint Digital Ltd | 10% Owner | Mar 22 '24 | Buy | 14.10 | 22,000 | 310,280 | 726,000 | Mar 25 08:41 AM | | Quint Digital Ltd | 10% Owner | Mar 18 '24 | Buy | 12.92 | 46,500 | 600,930 | 704,000 | Mar 20 01:00 PM |
|
|
|
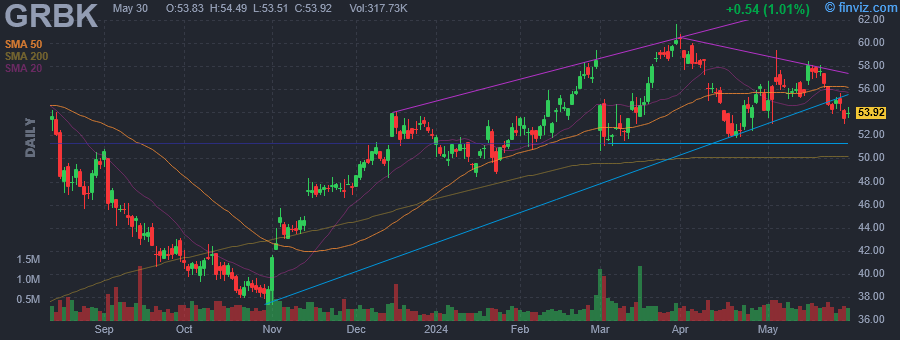 |
| Market Cap | 2.50B | EPS (ttm) | 6.59 |
| P/E | 8.45 | EPS this Y | 20.72% |
| Forward P/E | 6.98 | EPS next Y | 7.66% |
| PEG | 4.91 | EPS past 5Y | 43.25% |
| P/S | 1.41 | EPS next 5Y | 1.72% |
| P/B | 1.88 | EPS Q/Q | 32.77% |
| Dividend | - | Sales Q/Q | -1.04% |
| Insider Own | 7.48% | Inst Own | 77.60% |
| Insider Trans | -36.38% | Inst Trans | 6.03% |
| Short Float | 4.23% | Earnings | May 01/a |
| Analyst Recom | 3.00 | Target Price | 57.50 |
| Avg Volume | 373.33K | 52W Range | 37.31 - 61.62 |
|
|
|
|
Green Brick Partners, Inc. engages in residential land development and homebuilding. It operates through the following segments: Builder Operations Central, Builder Operations Southeast, and Land Development segments. The Builder Operations Central segment segment represents operations of its builders in Texas. The Builder Operations Southeast segment includes operations of builders in Georgia and Florida. The Land Development segment sells finished lots or option lots from third-party developers to their controlled builders for homebuilding operations and provides them with construction financing and strategic planning. The company was founded by James R. Brickman on April 11, 2006 and is headquartered in Plano, TX. |
| Insider Trading |
Relationship |
Date |
Transaction |
Cost |
#Shares |
Value ($) |
#Shares Total |
SEC Form 4 |
| Press Richard S | Director | May 06 '24 | Buy | 57.44 | 1,474 | 84,664 | 1,000 | May 08 12:15 PM | | COSTELLO RICHARD ARTHUR | Chief Financial Officer | May 06 '24 | Sale | 56.77 | 40,000 | 2,270,800 | 52,116 | May 06 06:28 PM | | Press Richard S | Director | Mar 11 '24 | Buy | 51.84 | 1,000 | 51,840 | 88,063 | Mar 12 05:58 PM | | Press Richard S | Director | Mar 08 '24 | Buy | 52.41 | 1,000 | 52,410 | 87,063 | Mar 12 05:58 PM | | EINHORN DAVID | Director | Jan 02 '24 | Sale | 46.24 | 937,500 | 43,353,000 | 1,802,690 | Jan 04 04:06 PM |
|
|
| |
 |
| Market Cap | 434.45M | EPS (ttm) | -0.14 |
| P/E | - | EPS this Y | 225.00% |
| Forward P/E | 22.43 | EPS next Y | 600.00% |
| PEG | - | EPS past 5Y | - |
| P/S | 0.45 | EPS next 5Y | 0.28% |
| P/B | 1.57 | EPS Q/Q | 17.62% |
| Dividend | - | Sales Q/Q | -0.90% |
| Insider Own | 5.09% | Inst Own | 98.07% |
| Insider Trans | -0.16% | Inst Trans | 1.30% |
| Short Float | 2.60% | Earnings | May 02/b |
| Analyst Recom | 1.00 | Target Price | 21.00 |
| Avg Volume | 116.68K | 52W Range | 14.18 - 24.51 |
|
|
|
|
Stoneridge, Inc. engages in the production of engineered electrical and electronic components, modules, and systems for the automotive, commercial, off-highway, motorcycle, and agricultural vehicle markets. It operates through the following segments: Control Devices, Electronics, and Stoneridge Brazil. The Control Devices segment designs and manufactures products that monitor, measure, and activate specific functions within a vehicle such as sensors, switches, valves, and actuators. The Electronics segment offers driver information systems, camera-based vision systems, connectivity and compliance products, and electronic control units. The Stoneridge Brazil segment sells vehicle tracking devices and monitoring services, vehicle security alarms and convenience accessories, in-vehicle audio and infotainment devices, and telematics solutions. The company was founded by D. M. Draime in 1965 and is headquartered in Novi, MI. |
| Insider Trading |
Relationship |
Date |
Transaction |
Cost |
#Shares |
Value ($) |
#Shares Total |
SEC Form 4 |
| Zizelman James | President and CEO | May 07 '24 | Buy | 15.72 | 6,500 | 102,180 | 6,500 | May 08 11:05 AM | | Ferraiolo Caetano Roberto | President Stoneridge Brazil | Mar 08 '24 | Option Exercise | 0.00 | 1,476 | 0 | 2,500 | Mar 11 07:18 PM | | Zizelman James | President and CEO | Mar 08 '24 | Option Exercise | 0.00 | 5,258 | 0 | 15,650 | Mar 11 07:40 PM | | Kased Rajaey | President Control Devices | Mar 08 '24 | Option Exercise | 0.00 | 2,112 | 0 | 6,795 | Mar 11 08:08 PM | | Hartman Robert J. Jr. | Chief Accounting Officer | Mar 08 '24 | Option Exercise | 0.00 | 1,395 | 0 | 34,688 | Mar 11 08:29 PM |
|
|
|
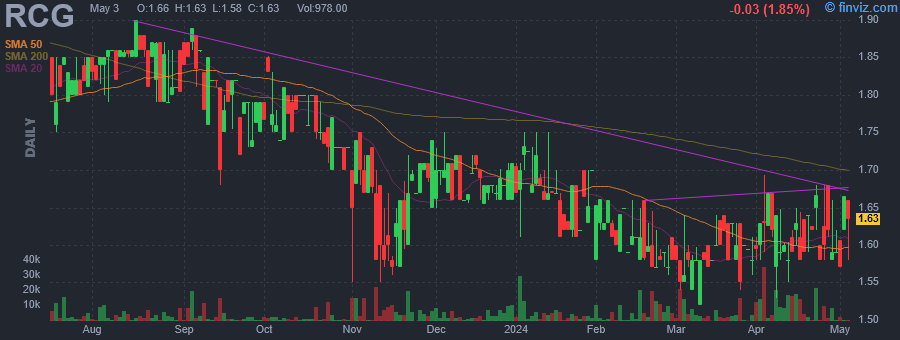 |
| Market Cap | 11.23M | EPS (ttm) | -0.12 |
| P/E | - | EPS this Y | - |
| Forward P/E | - | EPS next Y | - |
| PEG | - | EPS past 5Y | - |
| P/S | 39.27 | EPS next 5Y | - |
| P/B | 0.81 | EPS Q/Q | - |
| Dividend | 0.95% | Sales Q/Q | 26.30% |
| Insider Own | 14.93% | Inst Own | 16.58% |
| Insider Trans | 1.21% | Inst Trans | - |
| Short Float | 0.01% | Earnings | - |
| Analyst Recom | - | Target Price | - |
| Avg Volume | 7.48K | 52W Range | 1.52 - 1.90 |
|
|
|
|
RENN Fund, Inc. is a closed ended equity mutual fund launched by RENN Capital Group, Inc. The fund is co-managed by Horizon Kinetics Asset Management LLC. It invests in the public equity markets of the United States. The fund seeks to invest in stocks of companies operating across diversified sectors. It seeks to invest in stocks of small-cap and mid-cap companies. The fund employs a fundamental analysis with a bottom-up stock picking approach to create its portfolio. It was formerly known as RENN Global Entrepreneurs Fund, Inc. RENN Fund, Inc. was formed on January 20, 1994 and is domiciled in the United States. |
| Insider Trading |
Relationship |
Date |
Transaction |
Cost |
#Shares |
Value ($) |
#Shares Total |
SEC Form 4 |
| STAHL MURRAY | President and CEO | May 07 '24 | Buy | 1.60 | 55 | 88 | 247,714 | May 08 11:01 AM | | STAHL MURRAY | President and CEO | May 07 '24 | Buy | 1.60 | 4 | 6 | 5,049 | May 08 11:01 AM | | STAHL MURRAY | President and CEO | May 06 '24 | Buy | 1.58 | 55 | 87 | 247,690 | May 07 10:10 AM | | STAHL MURRAY | President and CEO | May 06 '24 | Buy | 1.58 | 4 | 6 | 5,045 | May 07 10:10 AM | | STAHL MURRAY | President and CEO | May 03 '24 | Buy | 1.65 | 55 | 91 | 247,666 | May 06 12:02 PM |
|
|
| |
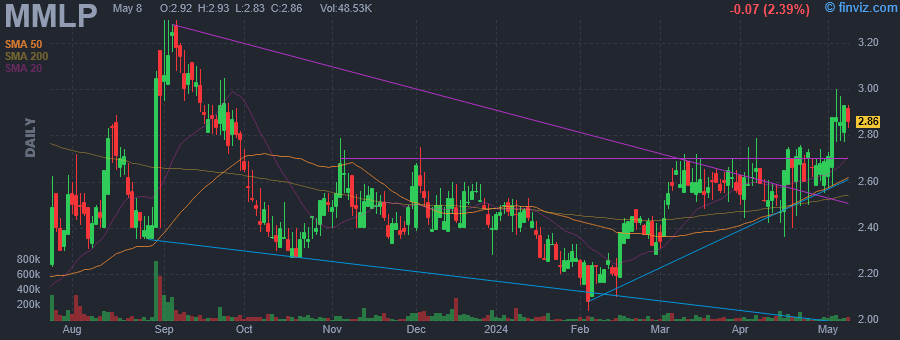 |
| Market Cap | 111.15M | EPS (ttm) | 0.10 |
| P/E | 29.75 | EPS this Y | 227.27% |
| Forward P/E | 12.95 | EPS next Y | 57.14% |
| PEG | 8.26 | EPS past 5Y | - |
| P/S | 0.15 | EPS next 5Y | 3.60% |
| P/B | - | EPS Q/Q | 164.25% |
| Dividend | 0.70% | Sales Q/Q | -26.05% |
| Insider Own | 28.25% | Inst Own | 35.13% |
| Insider Trans | 0.97% | Inst Trans | 1.12% |
| Short Float | 0.19% | Earnings | Apr 17/a |
| Analyst Recom | 3.00 | Target Price | 3.50 |
| Avg Volume | 46.29K | 52W Range | 1.95 - 3.30 |
|
|
|
|
Martin Midstream Partners LP engages in a diverse set of operations focused primarily in the United States Gulf Coast region. It operates through the following segments: Terminalling and Storage, Transportation, Sulfur Services, and Natural Gas Liquids. The Terminalling and Storage segment offers storage, refining, blending, packaging, and handling services for producers and suppliers of petroleum products and by-products, including the refining of naphthenic crude oil and the blending and packaging of various grades and quantities of industrial, commercial, and automotive lubricants and greases. The Transportation segment manages a fleet of inland marine tank barges, inland push boats and offshore tug, and barge unit that transport petroleum products and by-products. The Sulfur Services segment develops an integrated system of transportation assets and facilities relating to sulfur services. The Natural Gas Liquids segment distributes natural gas liquids. The company was founded in 2002 and is headquartered in Kilgore, TX. |
| Insider Trading |
Relationship |
Date |
Transaction |
Cost |
#Shares |
Value ($) |
#Shares Total |
SEC Form 4 |
| BONDURANT ROBERT D | President and CEO | May 07 '24 | Buy | 2.89 | 980 | 2,829 | 149,051 | May 08 10:59 AM | | MARTIN RUBEN S | Director | May 07 '24 | Buy | 2.89 | 502 | 1,449 | 159,302 | May 08 11:00 AM | | Taylor Sharon L | Executive Vice President / CFO | May 07 '24 | Buy | 2.89 | 243 | 702 | 23,277 | May 08 10:59 AM | | Shoup Scot A | Senior VP Operations | May 07 '24 | Buy | 2.89 | 108 | 311 | 27,954 | May 08 11:00 AM | | BONDURANT ROBERT D | President and CEO | Apr 09 '24 | Buy | 2.65 | 1,603 | 4,243 | 148,070 | Apr 10 12:57 PM |
|
|
|
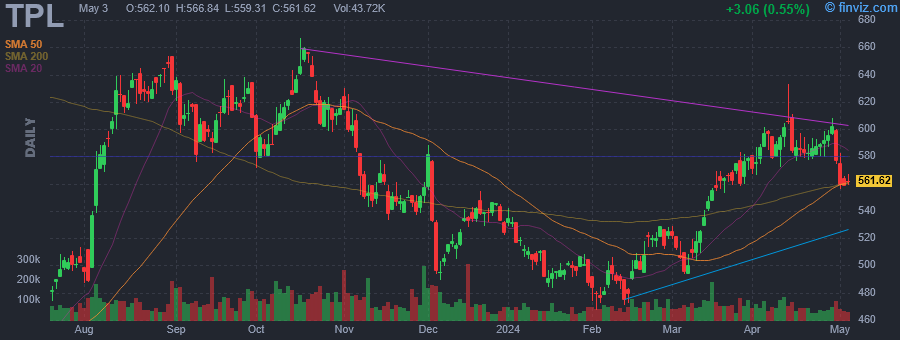 |
| Market Cap | 12.99B | EPS (ttm) | 17.59 |
| P/E | 32.09 | EPS this Y | -8.60% |
| Forward P/E | 7.72 | EPS next Y | 248.01% |
| PEG | 1.60 | EPS past 5Y | 14.40% |
| P/S | 20.57 | EPS next 5Y | 20.03% |
| P/B | 12.46 | EPS Q/Q | 13.90% |
| Dividend | 0.78% | Sales Q/Q | 9.20% |
| Insider Own | 0.82% | Inst Own | 59.40% |
| Insider Trans | 1.11% | Inst Trans | 0.69% |
| Short Float | 3.62% | Earnings | May 08/a |
| Analyst Recom | 2.70 | Target Price | 660.71 |
| Avg Volume | 75.29K | 52W Range | 422.07 - 666.67 |
|
|
|
|
Texas Pacific Land Corporation engages in the land and resource management, and water services and operations businesses. The company owns a 1/128th nonparticipating perpetual oil and gas royalty interest (NPRI) under approximately 85,000 acres of land; a 1/16th NPRI under approximately 371,000 acres of land; and approximately 4,000 additional net royalty acres, total of approximately 195,000 NRA located in the western part of Texas. The Land and Resource Management segment manages surface acres of land, and oil and gas royalty interest in West Texas. This segment also engages in easements, such as transporting oil, gas and related hydrocarbons, power line and utility, and subsurface wellbore easements. In addition, this segment leases its land for processing, storage, and compression facilities and roads; and is involved in sale of materials, such as caliche, sand, and other material, as well as sells land. The Water Services and Operations segment provides full-service water offerings, including water sourcing, produced-water treatment, infrastructure development, and disposal solutions to operators in the Permian Basin. This segment also holds produced water royalties. Texas Pacific Land Corporation was founded in 1888 and is headquartered in Dallas, Texas. |
| Insider Trading |
Relationship |
Date |
Transaction |
Cost |
#Shares |
Value ($) |
#Shares Total |
SEC Form 4 |
| HORIZON KINETICS ASSET MANAGEM | 10% Owner | May 07 '24 | Buy | 572.35 | 3 | 1,717 | 1,084,980 | May 08 10:51 AM | | HORIZON KINETICS ASSET MANAGEM | 10% Owner | May 06 '24 | Buy | 569.38 | 3 | 1,708 | 1,084,977 | May 07 11:25 AM | | HORIZON KINETICS ASSET MANAGEM | 10% Owner | May 03 '24 | Buy | 561.48 | 3 | 1,684 | 1,084,974 | May 06 11:45 AM | | HORIZON KINETICS ASSET MANAGEM | 10% Owner | May 02 '24 | Buy | 560.50 | 3 | 1,682 | 1,084,971 | May 03 01:52 PM | | HORIZON KINETICS ASSET MANAGEM | 10% Owner | May 01 '24 | Buy | 558.69 | 3 | 1,676 | 1,084,968 | May 02 12:55 PM |
|
|
|
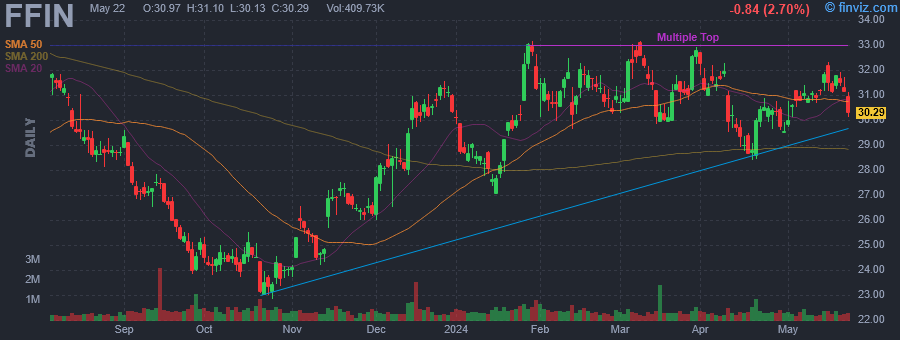 |
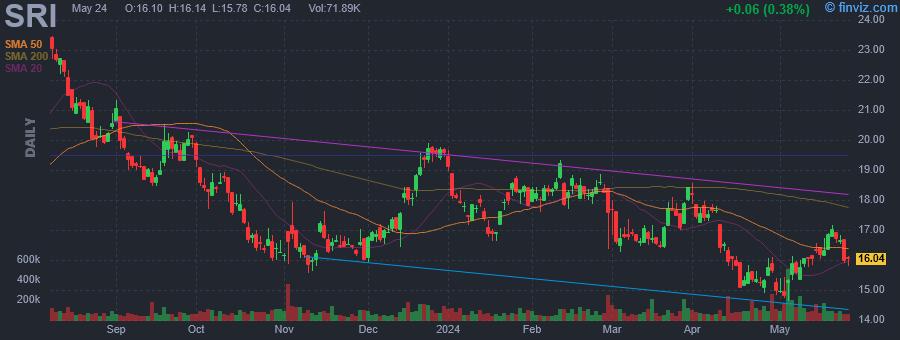
| Market Cap | 4.41B | EPS (ttm) | 1.40 |
| P/E | 22.12 | EPS this Y | 4.69% |
| Forward P/E | 19.93 | EPS next Y | 5.01% |
| PEG | 2.21 | EPS past 5Y | 4.67% |
| P/S | 6.64 | EPS next 5Y | 10.00% |
| P/B | 2.94 | EPS Q/Q | 1.61% |
| Dividend | 2.40% | Sales Q/Q | 20.19% |
| Insider Own | 4.12% | Inst Own | 70.07% |
| Insider Trans | 0.12% | Inst Trans | -0.56% |
| Short Float | 6.61% | Earnings | Apr 18/a |
| Analyst Recom | 3.00 | Target Price | 31.40 |
| Avg Volume | 467.82K | 52W Range | 22.84 - 33.15 |
|
|
|
|
First Financial Bankshares, Inc. is a holding company, which engages in the provision of financial and community banking services. It offers mortgage loans, savings and checking accounts, auto and equity loans, online and mobile banking, investment and trust management, and retirement plans. The company was founded in 1956 and is headquartered in Abilene, TX. |
| Insider Trading |
Relationship |
Date |
Transaction |
Cost |
#Shares |
Value ($) |
#Shares Total |
SEC Form 4 |
| Edwards Murray Hamilton | Director | May 07 '24 | Buy | 30.96 | 750 | 23,220 | 41,584 | May 08 09:50 AM | | Denny Michael B. | Director | May 03 '24 | Buy | 31.21 | 600 | 18,726 | 104,585 | May 06 04:21 PM | | Edwards Murray Hamilton | Director | May 02 '24 | Buy | 30.28 | 325 | 9,841 | 40,834 | May 02 03:00 PM | | Nickles Robert Clark Jr | Director | May 01 '24 | Buy | 30.16 | 593 | 17,885 | 93,563 | May 01 05:48 PM | | TROTTER JOHNNY | Director | Apr 30 '24 | Buy | 29.55 | 1,500 | 44,325 | 942,371 | May 01 05:46 PM |
|
|
|
