 |
| Market Cap | 786.45M | EPS (ttm) | -0.54 |
| P/E | - | EPS this Y | -22.64% |
| Forward P/E | 6.24 | EPS next Y | 17.68% |
| PEG | - | EPS past 5Y | 38.65% |
| P/S | 1.96 | EPS next 5Y | - |
| P/B | 0.66 | EPS Q/Q | -1275.77% |
| Dividend | 12.87% | Sales Q/Q | -5.11% |
| Insider Own | 2.15% | Inst Own | 57.45% |
| Insider Trans | -1.75% | Inst Trans | 3.26% |
| Short Float | 1.25% | Earnings | May 01/b |
| Analyst Recom | 2.50 | Target Price | 7.88 |
| Avg Volume | 750.77K | 52W Range | 5.20 - 8.01 |
|
|
| May-03-24 | Downgrade |
Raymond James |
Outperform → Mkt Perform |
|
|
|
|
BrightSpire Capital, Inc. is a real estate investment trust. It originates, acquires, finances, and manages portfolio consisting of commercial real estate (CRE) debt investments and net leased properties in the United States. It operates through the following segments: Senior Mezzanine Loans and Preferred Equity, Net Leased and other Real Estate, CRE Debt Securities, and Corporate. The Senior and Mezzanine Loans and Preferred Equity segment covers CRE debt investments including senior loans, mezzanine loans, and preferred equity interests as well as participations in such loans. The Net Leased and Other Real Estate segment includes investments in commercial real estate with long-term leases to tenants on a net lease basis. The CRE Debt Securities segment consists of securities investments previously consisting of BBB and some BB rated CMBS. the Corporate segment deals with corporate-level asset management and other fees. The company was founded on August 23, 2017 and is headquartered in New York, NY. |
| Insider Trading |
Relationship |
Date |
Transaction |
Cost |
#Shares |
Value ($) |
#Shares Total |
SEC Form 4 |
| Palame David A | See Remarks | Mar 27 '24 | Sale | 6.76 | 50,000 | 338,000 | 347,832 | Mar 29 07:02 PM |
|
|
 |
 |
| Market Cap | 1.02B | EPS (ttm) | -0.84 |
| P/E | - | EPS this Y | -140.19% |
| Forward P/E | - | EPS next Y | 29.22% |
| PEG | - | EPS past 5Y | - |
| P/S | 3.82 | EPS next 5Y | 6.00% |
| P/B | 1.72 | EPS Q/Q | -116.16% |
| Dividend | 4.36% | Sales Q/Q | -50.08% |
| Insider Own | 1.06% | Inst Own | 80.02% |
| Insider Trans | 0.32% | Inst Trans | -0.43% |
| Short Float | 1.40% | Earnings | Apr 29/a |
| Analyst Recom | 2.33 | Target Price | 65.38 |
| Avg Volume | 89.47K | 52W Range | 46.74 - 69.97 |
|
|
| May-03-24 | Downgrade |
Compass Point |
Buy → Neutral |
$65 → $68 |
|
|
|
Centerspace is a real estate investment trust, which engages in the business of owning, managing, acquiring, developing, and redeveloping apartment communities. It operates under the Multifamily and All Other segments. The All Other segment includes non-multifamily properties and non-multifamily components of mixed-use properties. The company was founded on July 31, 1970 and is headquartered in Minot, ND. |
| Insider Trading |
Relationship |
Date |
Transaction |
Cost |
#Shares |
Value ($) |
#Shares Total |
SEC Form 4 |
| Schissel John A | Director | Mar 11 '24 | Buy | 56.40 | 500 | 28,198 | 9,522 | Mar 12 04:11 PM | | Jones-Tyson Rodney | Director | Jan 17 '24 | Option Exercise | 0.00 | 593 | 0 | 2,044 | Jan 17 06:32 PM | | Olson Anne | President, CEO & Secretary | Jan 01 '24 | Option Exercise | 0.00 | 1,921 | 0 | 16,808 | Jan 03 06:40 PM | | Patel Bhairav | EVP and CFO | Jan 01 '24 | Option Exercise | 0.00 | 1,270 | 0 | 1,690 | Jan 03 06:40 PM | | Green Emily Nagle | Director | May 17 '23 | Option Exercise | 0.00 | 856 | 0 | 6,243 | May 18 03:34 PM |
|
|
|
 |
| Market Cap | 781.23M | EPS (ttm) | -2.20 |
| P/E | - | EPS this Y | 41.26% |
| Forward P/E | - | EPS next Y | 25.03% |
| PEG | - | EPS past 5Y | -45.48% |
| P/S | 3.35 | EPS next 5Y | - |
| P/B | 1.69 | EPS Q/Q | -457.68% |
| Dividend | - | Sales Q/Q | -5.13% |
| Insider Own | 2.31% | Inst Own | 103.50% |
| Insider Trans | -6.27% | Inst Trans | -0.41% |
| Short Float | 9.26% | Earnings | May 07/a |
| Analyst Recom | 2.20 | Target Price | 18.00 |
| Avg Volume | 444.54K | 52W Range | 9.00 - 24.17 |
|
|
| May-03-24 | Downgrade |
B. Riley Securities |
Buy → Neutral |
$22 → $19 |
|
|
|
CryoPort, Inc. engages in the provision of logistics solutions to the life science industry. It also provides logistics solutions for biologic materials such as immunotherapies, stem cells, CAR-T cells, and reproductive cells for clients worldwide, including points-of-care, clinical research organizations central laboratories, biopharmaceuticals, contract manufacturing, health centers, and university researchers. It offers personalized medicine, immunotherapies, cellular therapies, CAR T-cell therapies, stem cell therapies, vaccines, diagnostic materials, semen, eggs, embryos, cord blood, bio-pharmaceuticals, infectious substances, and other commodities that require continuous exposure to certain ranges of precision-controlled temperatures. The company was founded on May 25, 1990 and is headquartered in Brentwood, TN. |
| Insider Trading |
Relationship |
Date |
Transaction |
Cost |
#Shares |
Value ($) |
#Shares Total |
SEC Form 4 |
| SHELTON JERRELL | Chief Executive Officer | Mar 25 '24 | Sale | 17.54 | 2,631 | 46,154 | 692,182 | Mar 26 08:09 PM | | Sawicki Mark W | Chief Scientific Officer | Mar 25 '24 | Sale | 17.54 | 1,367 | 23,980 | 77,444 | Mar 26 08:08 PM | | STEFANOVICH ROBERT | Chief Financial Officer | Mar 25 '24 | Sale | 17.54 | 1,079 | 18,928 | 128,333 | Mar 26 08:12 PM | | SHELTON JERRELL | President, CEO | Mar 15 '24 | Option Exercise | 4.80 | 100,000 | 480,000 | 749,253 | Mar 19 07:48 PM | | Mandalam Ramkumar | Director | Mar 15 '24 | Option Exercise | 5.40 | 8,334 | 45,004 | 46,404 | Mar 19 07:49 PM |
|
|
| |
 |
| Market Cap | 1.90B | EPS (ttm) | -4.66 |
| P/E | - | EPS this Y | 3.28% |
| Forward P/E | 9.12 | EPS next Y | 32.24% |
| PEG | - | EPS past 5Y | - |
| P/S | 0.82 | EPS next 5Y | 19.50% |
| P/B | 2.10 | EPS Q/Q | -84.73% |
| Dividend | - | Sales Q/Q | 1.74% |
| Insider Own | 64.67% | Inst Own | 35.20% |
| Insider Trans | 0.00% | Inst Trans | 5.41% |
| Short Float | 8.46% | Earnings | May 02/b |
| Analyst Recom | 1.83 | Target Price | 16.59 |
| Avg Volume | 1.24M | 52W Range | 10.59 - 30.75 |
|
|
| May-03-24 | Downgrade |
JP Morgan |
Overweight → Neutral |
$18 → $12.50 |
|
|
|
Driven Brands Holdings, Inc. engages in the provision of automotive services. It provides consumer and commercial automotive needs, including paint, collision, glass, vehicle repair, oil change, maintenance and car wash. It operates through the following segments: Maintenance, Car Wash, Paint, Collision and Glass, Platform Services, and Corporate and Other. The Maintenance segment consists of the Take 5 Oil and Meineke brands, and revenue is primarily derived from the performance of maintenance services, including oil changes and regularly scheduled and as-needed automotive maintenance services and vehicle component repair and replacement. The Car Wash segment operates under the IMO brand across Europe and Australia and the Take 5 Car Wash brand in the U.S., providing express-style conveyor car wash services to both retail and commercial customers. The Paint, Collision and Glass segment includes the ABRA, CARSTAR, Fix Auto, Maaco, AGN, and Uniban brands and services both retail and commercial customers such as commercial fleet operators and insurance carriers. The Platform Services segment represents the 1-800 Radiator and A/C, PH, Spire Supply, Driven Advantage, and ATI businesses. The Corporate and Other segment focuses on the costs related to the advertising revenues and expenses and shared service costs, which are related to finance, information technology, human resources, legal, supply chain, and other support services. The company was founded in 1972 and is headquartered in Charlotte, NC. |
| Insider Trading |
Relationship |
Date |
Transaction |
Cost |
#Shares |
Value ($) |
#Shares Total |
SEC Form 4 |
| Fitzpatrick Jonathan G. | Chief Executive Officer | May 30 '23 | Buy | 23.76 | 42,000 | 997,920 | 2,332,363 | May 30 06:20 PM | | Ferrera Gary W | EVP & Chief Financial Officer | May 25 '23 | Buy | 24.23 | 4,000 | 96,920 | 63,101 | May 30 06:20 PM |
|
|
|
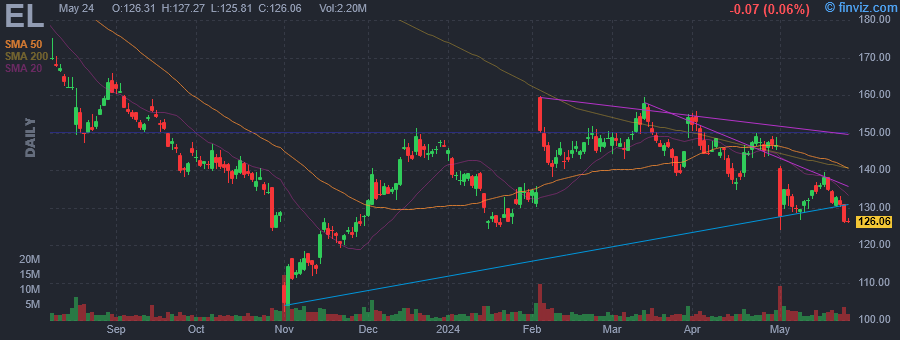 |
| Market Cap | 47.66B | EPS (ttm) | 1.78 |
| P/E | 74.77 | EPS this Y | -35.45% |
| Forward P/E | 31.64 | EPS next Y | 88.12% |
| PEG | 3.73 | EPS past 5Y | -1.12% |
| P/S | 3.11 | EPS next 5Y | 20.06% |
| P/B | 8.30 | EPS Q/Q | 111.76% |
| Dividend | 1.99% | Sales Q/Q | 5.26% |
| Insider Own | 35.30% | Inst Own | 58.42% |
| Insider Trans | -0.00% | Inst Trans | -0.56% |
| Short Float | 1.98% | Earnings | May 01/b |
| Analyst Recom | 2.32 | Target Price | 151.82 |
| Avg Volume | 2.74M | 52W Range | 102.22 - 210.01 |
|
|
| May-03-24 | Downgrade |
Morgan Stanley |
Overweight → Equal-Weight |
$164 → $140 |
|
|
|
The Estee Lauder Companies, Inc. engages in the manufacture of skin care, makeup, fragrance and hair care products. It sells products under the following brand names: Estee Lauder, Clinique, Origins, MAC, Bobbi Brown, La Mer, Jo Malone London, Aveda and Too Faced. Its channels consist of department stores, multi-brand retailers, upscale perfumeries and pharmacies, and prestige salons and spas. The company was founded by Estee Lauder and Joseph Lauder in 1946 and is headquartered in New York, NY. |
| Insider Trading |
Relationship |
Date |
Transaction |
Cost |
#Shares |
Value ($) |
#Shares Total |
SEC Form 4 |
| Hyman Jennifer | Director | Feb 07 '24 | Buy | 146.70 | 1,350 | 198,045 | 2,350 | Feb 07 04:35 PM | | Stanley Deirdre | EVP & General Counsel | Feb 07 '24 | Sale | 147.00 | 4,343 | 638,421 | 13,025 | Feb 07 04:18 PM | | STERNLICHT BARRY S | Director | Nov 08 '23 | Option Exercise | 70.68 | 3,813 | 269,503 | 34,795 | Nov 09 02:26 PM | | Hertzmark Hudis Jane | Executive Group President | Nov 01 '23 | Option Exercise | 0.00 | 5,843 | 0 | 18,293 | Nov 02 04:06 PM | | LAUDER JANE | Executive Vice President & CDO | Nov 01 '23 | Option Exercise | 0.00 | 2,597 | 0 | 58,826 | Nov 02 04:05 PM |
|
|
| |
 |
| Market Cap | 15.28B | EPS (ttm) | 5.33 |
| P/E | 21.64 | EPS this Y | 22.29% |
| Forward P/E | 7.74 | EPS next Y | 25.67% |
| PEG | 1.12 | EPS past 5Y | 14.85% |
| P/S | 1.17 | EPS next 5Y | 19.30% |
| P/B | 17.30 | EPS Q/Q | -4.76% |
| Dividend | - | Sales Q/Q | 8.41% |
| Insider Own | 4.74% | Inst Own | 96.38% |
| Insider Trans | -1.83% | Inst Trans | -3.43% |
| Short Float | 5.39% | Earnings | May 02/a |
| Analyst Recom | 2.31 | Target Price | 150.83 |
| Avg Volume | 2.59M | 52W Range | 87.94 - 160.05 |
|
|
| May-03-24 | Downgrade |
BMO Capital Markets |
Outperform → Market Perform |
$165 → $145 |
| May-03-24 | Downgrade |
Piper Sandler |
Overweight → Neutral |
$175 → $145 |
|
|
May-03-24 04:51PM
|
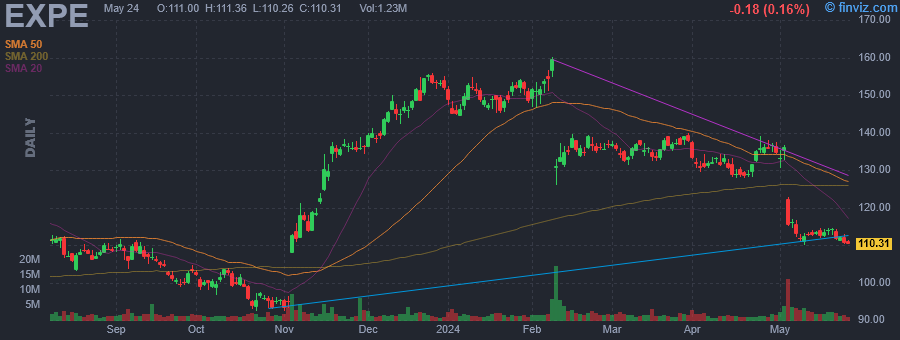
These Stocks Moved the Most Today: Apple, Amgen, Expedia, Coinbase, Cloudflare, Fortinet, Live Nation, and More
(Barrons.com) -15.25% |
|
04:49PM
|
S&P 500 Gains and Losses Today: Amgen Soars as Weight-Loss Drug Shows Promise
(Investopedia) |
|
04:19PM
|
US STOCKS-Wall St ends sharply higher, jobs data strengthens case for rate cuts
(Reuters) |
|
04:13PM
|
Booking Stock Jumps While Expedia Tumbles Following Q1 Reports
(Investor's Business Daily) |
|
04:00PM
|
US STOCKS-Wall St ends sharply higher, US jobs data strengthens case for rate cuts
(Reuters) |
|
03:57PM
|
Expedia stock sinks on full-year guidance cut, Q1 bookings
(Yahoo Finance Video) |
|
03:46PM
|
These Stocks Are Moving the Most Today: Apple, Amgen, Expedia, Coinbase, Cloudflare, Fortinet, Live Nation, and More
(Barrons.com) |
|
02:22PM
|
US STOCKS-Wall St rallies as soft jobs data makes case for Fed policy easing
(Reuters) |
|
02:19PM
|
Why Expedia Stock Was Falling Double Digits Today
(Motley Fool) |
|
01:36PM
|
Stocks surge as soft jobs report revives Fed rate cut hopes: Yahoo Finance
(Yahoo Finance Video) |
|
Expedia Group, Inc. is an online travel company, which engages in the provision of travel products and services to leisure and corporate travelers. It operates through the following segments: B2C, B2B, and Trivago. The B2C segment offers a full range of travel and advertising services to worldwide customers through a variety of consumer brands. The B2B segment refers to a wide range of travel and non-travel companies including airlines, offline travel agents, online retailers, corporate travel management, and financial institutions. The Trivago segment generates advertising revenue primarily from sending referrals to online travel companies and travel service providers from hotel metasearch websites. The company was founded in 1994 and is headquartered in Seattle, WA. |
| Insider Trading |
Relationship |
Date |
Transaction |
Cost |
#Shares |
Value ($) |
#Shares Total |
SEC Form 4 |
| Gorin Ariane | Director | Apr 15 '24 | Option Exercise | 0.00 | 1,529 | 0 | 50,038 | Apr 17 05:09 PM | | Menendez-Cambo Patricia | Director | Apr 05 '24 | Option Exercise | 0.00 | 474 | 0 | 3,808 | Apr 05 06:00 PM | | Soliday Lance A | Chief Accounting Officer | Feb 29 '24 | Option Exercise | 104.50 | 2,903 | 303,364 | 13,783 | Mar 01 04:37 PM | | Soliday Lance A | Chief Accounting Officer | Feb 29 '24 | Sale | 136.50 | 2,778 | 379,188 | 11,005 | Mar 01 04:37 PM | | Diller Barry | Chairman & Sr. Executive | Feb 28 '24 | Option Exercise | 119.04 | 150,000 | 17,856,000 | 261,277 | Mar 01 04:37 PM |
|
|
|
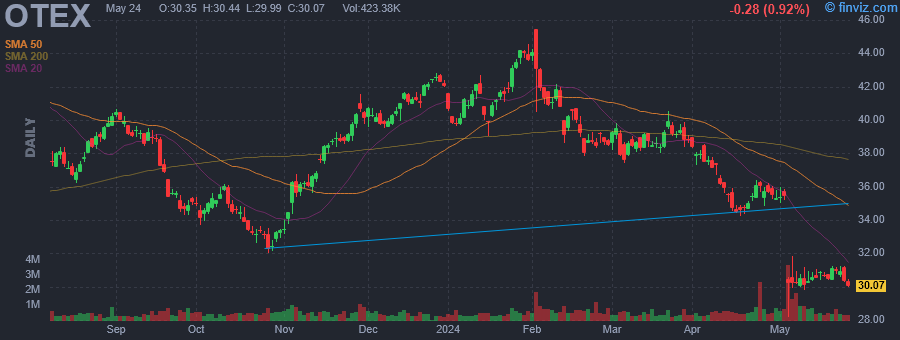 |
| Market Cap | 8.25B | EPS (ttm) | 0.62 |
| P/E | 49.11 | EPS this Y | 28.54% |
| Forward P/E | 8.50 | EPS next Y | -15.84% |
| PEG | 5.22 | EPS past 5Y | -9.39% |
| P/S | 1.40 | EPS next 5Y | 9.40% |
| P/B | 2.00 | EPS Q/Q | 69.25% |
| Dividend | 3.31% | Sales Q/Q | 16.27% |
| Insider Own | 2.19% | Inst Own | 69.22% |
| Insider Trans | 0.00% | Inst Trans | -0.44% |
| Short Float | 1.92% | Earnings | May 02/a |
| Analyst Recom | 2.08 | Target Price | 41.68 |
| Avg Volume | 631.86K | 52W Range | 32.04 - 45.47 |
|
|
| May-03-24 | Downgrade |
BMO Capital Markets |
Outperform → Market Perform |
$50 → $38 |
|
|
|
Open Text Corp. engages in the design, development, marketing and sales of enterprise information management software and solutions. It includes customer experience management (CEM), digital process automation, business network, and enterprise content management, discovery, security, and artificial intelligence (AI) and analytics solutions. It also offers consulting, managed, and learning services. The company was founded on June 26, 1991 and is headquartered in Waterloo, Canada. |
|
| |
 |
| Market Cap | 8.59B | EPS (ttm) | -0.82 |
| P/E | - | EPS this Y | 142.60% |
| Forward P/E | 9.24 | EPS next Y | 10.61% |
| PEG | - | EPS past 5Y | - |
| P/S | 0.29 | EPS next 5Y | 31.65% |
| P/B | 0.39 | EPS Q/Q | 50.05% |
| Dividend | 1.57% | Sales Q/Q | 5.78% |
| Insider Own | 11.27% | Inst Own | 73.10% |
| Insider Trans | 0.00% | Inst Trans | 1.97% |
| Short Float | 12.27% | Earnings | Apr 29/a |
| Analyst Recom | 3.23 | Target Price | 12.84 |
| Avg Volume | 21.09M | 52W Range | 10.12 - 23.45 |
|
|
| May-03-24 | Downgrade |
Seaport Research Partners |
Buy → Neutral |
|
| May-03-24 | Downgrade |
Argus |
Hold → Sell |
|
|
|
|
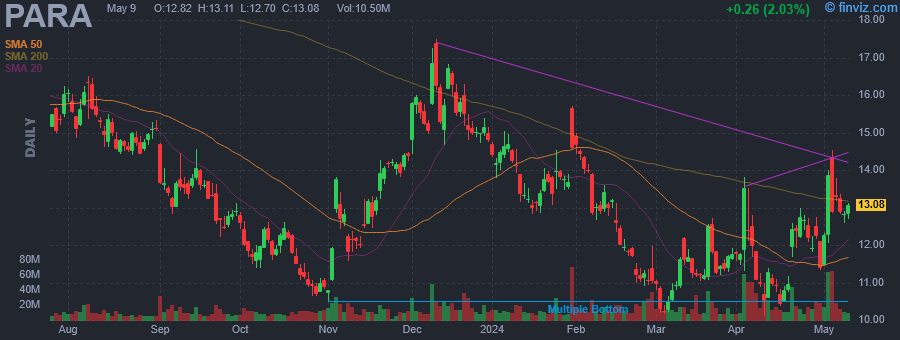
Paramount Global operates as a mass media company, which creates and distributes content across a variety of platforms to audiences around the world. It operates its business through the following segments: Entertainment, Cable Networks, Publishing, and Local Media. The Entertainment segment is composed of the CBS Television Network, CBS Television Studios, CBS Studios International, CBS Television Distribution, CBS Interactive, and CBS Films, as well as the company's digital streaming services, CBS All Access and CBSN. The Cable Networks segment includes Showtime Networks, CBS Sports Network, and Smithsonian Networks. The Publishing segment manages Simon & Schuster's consumer book publishing business with imprints such as Simon & Schuster, Pocket Books, Scribner, and Atria Books. The Local Media segment handles CBS Television Stations and CBS Local Digital Media, with revenues generated primarily from advertising sales and retransmission fees. The company was founded by Sumner Murray Redstone in 1986 and is headquartered in New York, NY. |
| Insider Trading |
Relationship |
Date |
Transaction |
Cost |
#Shares |
Value ($) |
#Shares Total |
SEC Form 4 |
| Klieger Robert N. | Director | Mar 01 '24 | Option Exercise | 0.00 | 2,169 | 0 | 28,711 | Mar 05 04:51 PM | | GRIEGO LINDA M | Director | Mar 01 '24 | Option Exercise | 0.00 | 2,169 | 0 | 54,954 | Mar 05 04:51 PM | | Byrne Barbara M | Director | Mar 01 '24 | Option Exercise | 0.00 | 2,169 | 0 | 32,418 | Mar 05 04:50 PM | | Seligman Nicole | Director | Mar 01 '24 | Option Exercise | 0.00 | 2,169 | 0 | 33,357 | Mar 05 04:55 PM | | PHILLIPS JR CHARLES E | Director | Mar 01 '24 | Option Exercise | 0.00 | 2,169 | 0 | 91,070 | Mar 05 04:53 PM |
|
|
|
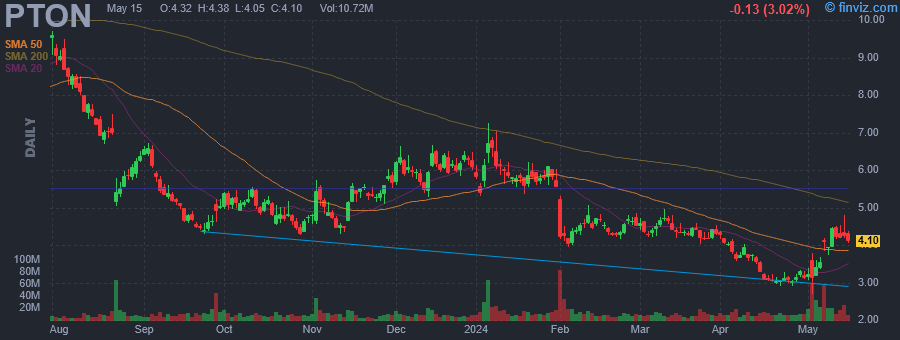 |
| Market Cap | 1.26B | EPS (ttm) | -2.12 |
| P/E | - | EPS this Y | 57.36% |
| Forward P/E | - | EPS next Y | 40.79% |
| PEG | - | EPS past 5Y | -85.03% |
| P/S | 0.47 | EPS next 5Y | - |
| P/B | - | EPS Q/Q | 42.25% |
| Dividend | - | Sales Q/Q | -4.17% |
| Insider Own | 11.50% | Inst Own | 74.46% |
| Insider Trans | -1.46% | Inst Trans | 0.83% |
| Short Float | 15.60% | Earnings | May 02/b |
| Analyst Recom | 2.96 | Target Price | 4.94 |
| Avg Volume | 12.28M | 52W Range | 2.70 - 9.87 |
|
|
| May-03-24 | Downgrade |
Bernstein |
Outperform → Mkt Perform |
$8 → $3.80 |
|
|
|
Peloton Interactive, Inc. provides an at-home fitness platform for live and on-demand indoor cycling classes. The firm pioneered connected, technology-enabled fitness, and the streaming of immersive, instructor-led boutique classes for its members. It operates through the Connected Fitness Products and Subscription segments. The Connected Fitness Products segment includes the sales of bikes, tread & related accessories. The Subscription segment refers to the monthly subscription and credits from live studio classes. The company was founded by John Foley, Graham Stanton, Thomas Cortese, Yony Feng, and Hisao Kushi in 2012 and is headquartered in New York, NY. |
| Insider Trading |
Relationship |
Date |
Transaction |
Cost |
#Shares |
Value ($) |
#Shares Total |
SEC Form 4 |
| Coddington Elizabeth F | Chief Financial Officer | Mar 14 '24 | Sale | 4.34 | 8,977 | 38,975 | 104,428 | Mar 15 04:11 PM | | Cotter Jennifer Cunningham | Chief Content Officer | Mar 07 '24 | Sale | 4.43 | 104,620 | 463,540 | 32,363 | Mar 11 04:33 PM | | RENDICH ANDREW S | Chief Supply Chain Officer | Feb 26 '24 | Sale | 4.49 | 125,840 | 564,556 | 47,690 | Feb 27 04:23 PM | | Cotter Jennifer Cunningham | Chief Content Officer | Feb 16 '24 | Sale | 4.45 | 38,407 | 170,857 | 134,483 | Feb 20 04:23 PM | | RENDICH ANDREW S | Chief Supply Chain Officer | Feb 16 '24 | Sale | 4.47 | 36,804 | 164,532 | 173,530 | Feb 20 04:25 PM |
|
|
|
 |
| Market Cap | 1.63B | EPS (ttm) | -1.25 |
| P/E | - | EPS this Y | 220.41% |
| Forward P/E | 40.19 | EPS next Y | 59.87% |
| PEG | - | EPS past 5Y | -22.91% |
| P/S | 4.59 | EPS next 5Y | - |
| P/B | 11.06 | EPS Q/Q | -29.66% |
| Dividend | - | Sales Q/Q | 28.68% |
| Insider Own | 14.84% | Inst Own | 108.55% |
| Insider Trans | -5.41% | Inst Trans | 0.38% |
| Short Float | 18.23% | Earnings | May 02/a |
| Analyst Recom | 2.07 | Target Price | 49.36 |
| Avg Volume | 638.03K | 52W Range | 37.00 - 68.41 |
|
|
| May-03-24 | Downgrade |
BTIG Research |
Buy → Neutral |
|
| May-03-24 | Downgrade |
Piper Sandler |
Overweight → Neutral |
$66 → $40 |
| May-03-24 | Downgrade |
Robert W. Baird |
Outperform → Neutral |
$72 → $45 |
| May-03-24 | Downgrade |
KeyBanc Capital Markets |
Overweight → Sector Weight |
|
| May-03-24 | Downgrade |
Goldman |
Buy → Neutral |
$80 → $44 |
| May-03-24 | Downgrade |
William Blair |
Outperform → Mkt Perform |
|
|
|
|
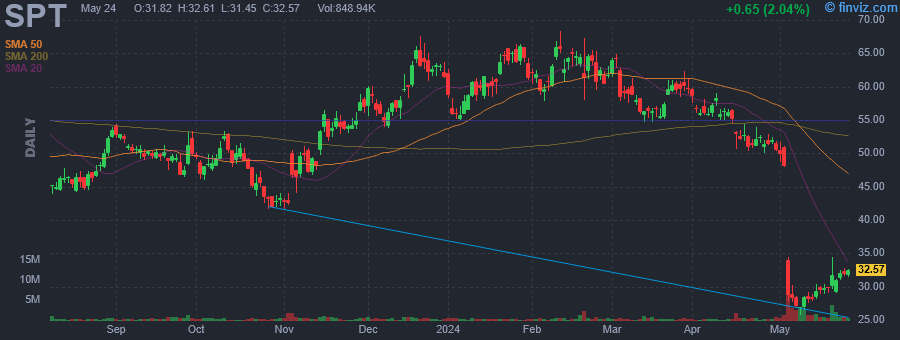
Sprout Social, Inc. provides online social media management tools for businesses. It offers communication tools, contact management, lead generation, and analytics services. The firm also offers solutions for enterprises, agencies, small businesses, customer service, social media marketing, and employee advocacy sectors. The company was founded by Justyn Howard, Aaron Rankin, Gilbert Lara, and Peter Soung in 2010 and is headquartered in Chicago, IL. |
| Insider Trading |
Relationship |
Date |
Transaction |
Cost |
#Shares |
Value ($) |
#Shares Total |
SEC Form 4 |
| Howard Justyn Russell | Chairman and CEO | Apr 08 '24 | Sale | 56.52 | 20,000 | 1,130,325 | 0 | Apr 09 05:28 PM | | Rankin Aaron Edward Frederick | Director | Apr 04 '24 | Sale | 56.95 | 22,000 | 1,252,800 | 0 | Apr 08 05:29 PM | | Barretto Ryan Paul | President | Apr 04 '24 | Sale | 56.95 | 5,600 | 318,936 | 198,175 | Apr 08 05:30 PM | | Del Preto Joseph | CFO and Treasurer | Apr 01 '24 | Sale | 59.63 | 1,500 | 89,445 | 172,644 | Apr 02 05:30 PM | | Howard Justyn Russell | Chairman and CEO | Mar 07 '24 | Sale | 58.36 | 40,000 | 2,334,530 | 0 | Mar 08 04:04 PM |
|
|
|
