 |
| Market Cap | 667.72M | EPS (ttm) | 2.44 |
| P/E | 5.11 | EPS this Y | 96.60% |
| Forward P/E | 7.91 | EPS next Y | -12.26% |
| PEG | - | EPS past 5Y | 26.00% |
| P/S | 2.57 | EPS next 5Y | - |
| P/B | 0.78 | EPS Q/Q | 121.20% |
| Dividend | 10.75% | Sales Q/Q | 13.20% |
| Insider Own | 0.30% | Inst Own | 29.00% |
| Insider Trans | 6.06% | Inst Trans | 52.78% |
| Short Float | 0.18% | Earnings | May 09/b |
| Analyst Recom | 3.00 | Target Price | 12.25 |
| Avg Volume | 305.66K | 52W Range | 9.09 - 12.69 |
|
|
|
|
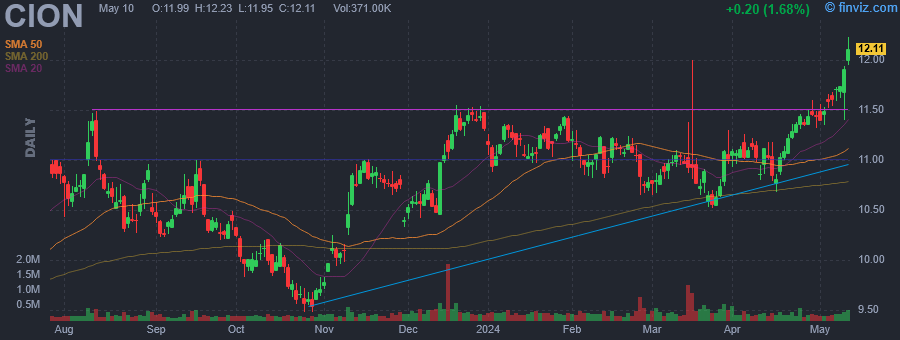
CION Investment Corporation is a business development company. It specializes in investments in senior secured loans, including unitranche loans, First Lien, second lien loans, long-term subordinated loans, and mezzanine loans; equity interests such as warrants or options; and corporate bonds; and other debt securities in middle-market companies. The firm invests in growth capital, acquisitions, leveraged buyouts, market/product expansion, refinancing and recapitalization. The fund also invests up to 30 percent of their assets opportunistically in other types of investments, including the securities of larger public companies and foreign securities. It also makes investments in the secondary loan market. The fund does not invest in start-up companies, turnaround situations, or companies with speculative business plans. The fund prefers to invest in high tech industries, healthcare, pharmaceuticals, business services, media, chemicals, plastic, rubber, telecommunication, consumer services, advertising, printing and publishing, consumer goods, durables, diversified financials, and other industries. It also invests in homebuilding, restaurants, beverage and tobacco bars, broadcasting, distributors, Non-durable good distribution, food beverage and tobacco, energy, oil gas and consumables fuels, insurance, aerospace and defense, industrial machinery, paper and forest product machinery, information technology, metals and mining, and real estate. It primarily seeks to invest in the United States. The fund seeks to invest between $5 million and $50 million in companies with an EBITDA between $25 million and $75 million with average targeted hold of $25 million. It also purchases minority interests in the form of common or preferred equity in the target companies, typically in conjunction with its debt investments or through a co-investment with a financial sponsor. The fund seeks to exit its investments through an initial public offering of common stock, a merger, a sale, or other recapitalization. |
| Insider Trading |
Relationship |
Date |
Transaction |
Cost |
#Shares |
Value ($) |
#Shares Total |
SEC Form 4 |
| BRESNER GREGG A. | President & CIO | May 17 '24 | Buy | 12.51 | 2,000 | 25,020 | 52,099 | May 17 03:19 PM | | Reisner Michael A | Co-Chairman & Co-CEO | May 13 '24 | Buy | 12.27 | 407 | 4,994 | 44,160 | May 14 02:30 PM | | Pinero Eric A. | Chief Legal Officer | Apr 05 '24 | Buy | 11.11 | 450 | 5,000 | 7,136 | Apr 05 04:01 PM | | ROMAN STEPHEN | CCO & Secretary | Apr 01 '24 | Buy | 11.05 | 450 | 4,972 | 9,146 | Apr 01 02:23 PM | | Gatto Mark | Co-Chairman & Co-CEO | Mar 27 '24 | Buy | 11.02 | 1,150 | 12,673 | 1,000 | Mar 29 10:55 AM |
|
|
 |
 |
| Market Cap | 757.56M | EPS (ttm) | 0.61 |
| P/E | 32.46 | EPS this Y | -117.14% |
| Forward P/E | 43.30 | EPS next Y | 355.56% |
| PEG | 16.23 | EPS past 5Y | 57.99% |
| P/S | 0.18 | EPS next 5Y | 2.00% |
| P/B | - | EPS Q/Q | -1051.20% |
| Dividend | 10.54% | Sales Q/Q | -7.34% |
| Insider Own | 52.52% | Inst Own | 24.00% |
| Insider Trans | 0.01% | Inst Trans | -0.13% |
| Short Float | 0.58% | Earnings | May 08/a |
| Analyst Recom | 3.00 | Target Price | 20.00 |
| Avg Volume | 37.91K | 52W Range | 17.91 - 24.19 |
|
|
|
|
CrossAmerica Partners LP engages in the business of wholesaling distribution of motor fuel, convenience store operation, and the ownership and leasing of real estate used in the retail distribution of motor fuel. It operates through the Wholesale and Retail segments. The Wholesale segment focuses on providing wholesale distribution services to lessee dealers and independent dealers. The Retail segment includes retail sale of motor fuel at retail sites operated by commission agents, convenience merchandise items, and motor fuel at company operated sites. The company was founded on December 2, 2011 and is headquartered in Allentown, PA. |
| Insider Trading |
Relationship |
Date |
Transaction |
Cost |
#Shares |
Value ($) |
#Shares Total |
SEC Form 4 |
| Kelso Thomas E | Director | May 16 '24 | Buy | 19.52 | 500 | 9,761 | 2,476 | May 17 03:16 PM | | Gannon Justin A. | Director | May 14 '24 | Buy | 19.39 | 500 | 9,695 | 29,860 | May 16 04:53 PM | | Kelso Thomas E | Director | Mar 04 '24 | Buy | 21.64 | 500 | 10,820 | 1,976 | Mar 05 06:12 PM | | Topper Joseph V. Jr. | Director | May 30 '23 | Buy | 18.32 | 3,000 | 54,946 | 233,335 | May 30 08:38 PM | | Topper Joseph V. Jr. | Director | May 26 '23 | Buy | 18.33 | 15,000 | 274,922 | 230,335 | May 30 08:38 PM |
|
|
|
 |
| Market Cap | 170.22M | EPS (ttm) | -0.04 |
| P/E | - | EPS this Y | - |
| Forward P/E | - | EPS next Y | - |
| PEG | - | EPS past 5Y | 27.70% |
| P/S | 6.55 | EPS next 5Y | - |
| P/B | 0.73 | EPS Q/Q | -43.08% |
| Dividend | - | Sales Q/Q | 14.23% |
| Insider Own | 1.59% | Inst Own | 8.58% |
| Insider Trans | 4.88% | Inst Trans | -2.90% |
| Short Float | 6.25% | Earnings | May 09/a |
| Analyst Recom | 3.00 | Target Price | 0.44 |
| Avg Volume | 5.96M | 52W Range | 0.12 - 0.25 |
|
|
|
|
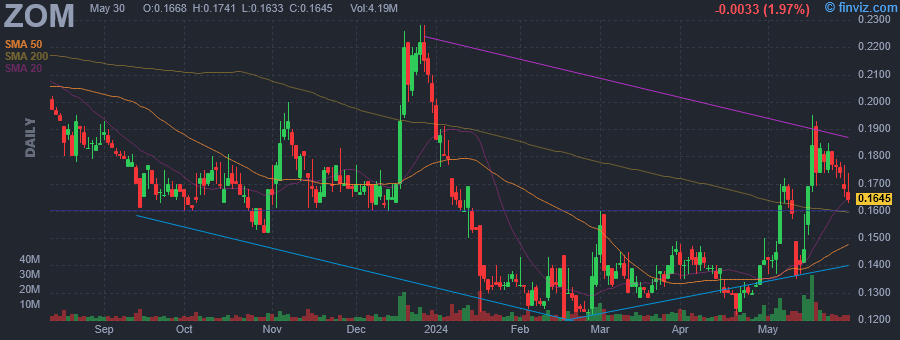
Zomedica Corp. operates as a veterinary health company, which engages in the discovery, development, and commercialization of pharmaceuticals for the companion pet. It offers products for dogs and cats by focusing on the unmet needs of clinical veterinarians. Its TRUFORMA biosensor platform is designed to assist practitioners in the diagnosis of complex conditions. The company was founded by Gerald L. Solensky. on January 7, 2013 and is headquartered in Ann Arbor, MI. |
| Insider Trading |
Relationship |
Date |
Transaction |
Cost |
#Shares |
Value ($) |
#Shares Total |
SEC Form 4 |
| POWERS JOHNNY D | Director | May 17 '24 | Buy | 0.17 | 100,000 | 17,450 | 2,225,000 | May 17 03:08 PM | | POWERS JOHNNY D | Director | May 16 '24 | Buy | 0.18 | 25,000 | 4,600 | 2,125,000 | May 17 10:08 AM | | POWERS JOHNNY D | Director | May 14 '24 | Buy | 0.14 | 50,000 | 6,981 | 2,100,000 | May 15 04:30 PM | | Blair Anthony K | COO | May 13 '24 | Buy | 0.14 | 150,000 | 21,000 | 150,000 | May 14 04:31 PM | | HEATON LARRY C II | CEO | May 13 '24 | Buy | 0.14 | 100,000 | 14,200 | 300,000 | May 13 05:07 PM |
|
|
| |
 |
| Market Cap | 1.00B | EPS (ttm) | 2.84 |
| P/E | 11.90 | EPS this Y | -12.54% |
| Forward P/E | 12.93 | EPS next Y | 2.85% |
| PEG | 1.32 | EPS past 5Y | 7.87% |
| P/S | 3.09 | EPS next 5Y | 9.00% |
| P/B | 1.53 | EPS Q/Q | -8.85% |
| Dividend | 3.19% | Sales Q/Q | 11.06% |
| Insider Own | 4.97% | Inst Own | 49.32% |
| Insider Trans | 1.20% | Inst Trans | 0.65% |
| Short Float | 3.91% | Earnings | Apr 29/a |
| Analyst Recom | 2.75 | Target Price | 35.50 |
| Avg Volume | 116.28K | 52W Range | 24.85 - 34.96 |
|
|
|
|
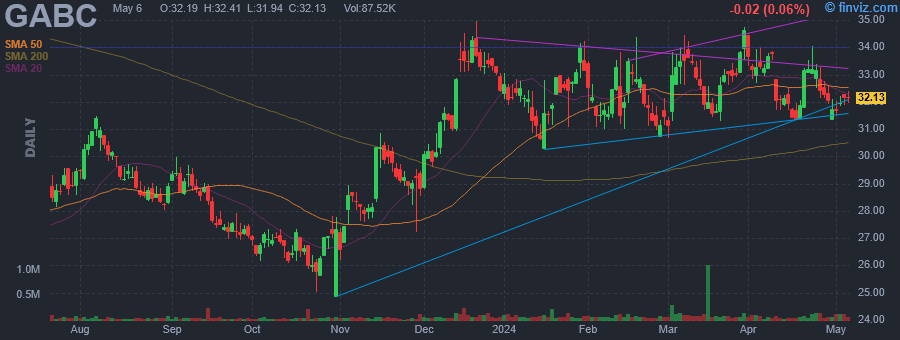
German American Bancorp, Inc. is a financial holding company, which engages in owning a trust, brokerage, and financial planning through German American Financial Advisors & Trust Co. and German American Insurance, Inc. It operates through the following segments: Core Banking, Wealth Management Services, Insurance Operations, and Other. The Core Banking segment is involved in attracting deposits from the public and using such funds to originate consumer, commercial and agricultural, commercial and agricultural real estate, and residential mortgage loans, primarily in the company's local markets. The Wealth Management Services segment offers trust, investment advisory, brokerage, and retirement planning services to customers. The Insurance Operations segment focuses on the full range of personal and corporate property and casualty insurance products, primarily in the company's banking subsidiary's local markets. The company was founded in 1982 and is headquartered in Jasper, IN. |
| Insider Trading |
Relationship |
Date |
Transaction |
Cost |
#Shares |
Value ($) |
#Shares Total |
SEC Form 4 |
| SHEIDLER JACK | Director | May 15 '24 | Buy | 33.00 | 80 | 2,650 | 61,375 | May 17 02:29 PM | | Bawel Zachary W | Director | May 15 '24 | Buy | 33.00 | 52 | 1,700 | 17,780 | May 17 12:04 PM | | Ellspermann Susan J | Director | May 15 '24 | Buy | 33.00 | 52 | 1,700 | 6,313 | May 17 12:24 PM | | SEGER THOMAS W | Director | May 15 '24 | Buy | 33.00 | 26 | 850 | 478,790 | May 17 12:43 PM | | SHEIDLER JACK | Director | Apr 15 '24 | Buy | 32.06 | 28 | 900 | 61,295 | Apr 18 11:58 AM |
|
|
|
 |
| Market Cap | 447.09M | EPS (ttm) | 2.05 |
| P/E | 23.37 | EPS this Y | -35.37% |
| Forward P/E | 10.30 | EPS next Y | 46.95% |
| PEG | 0.58 | EPS past 5Y | 7.84% |
| P/S | 1.50 | EPS next 5Y | 40.00% |
| P/B | 1.56 | EPS Q/Q | -90.08% |
| Dividend | 0.50% | Sales Q/Q | 1.07% |
| Insider Own | 12.21% | Inst Own | 45.94% |
| Insider Trans | 0.18% | Inst Trans | -6.94% |
| Short Float | 4.29% | Earnings | May 09/a |
| Analyst Recom | 1.00 | Target Price | 93.67 |
| Avg Volume | 56.92K | 52W Range | 46.32 - 79.46 |
|
|
|
|
RCI Hospitality Holdings, Inc. engages in the provision of live adult entertainment and dining experiences. It operates through the following segments: Nightclubs and Bombshells. The Nightclubs segment includes adult entertainment. The Bombshells segment involves the operation of restaurants and bars. The company was founded by Robert L. Watters in 1983 and is headquartered in Houston, TX. |
| Insider Trading |
Relationship |
Date |
Transaction |
Cost |
#Shares |
Value ($) |
#Shares Total |
SEC Form 4 |
| Elaine Johnson Martin | Director | May 15 '24 | Buy | 47.25 | 64 | 3,024 | 9,991 | May 17 02:01 PM | | Elaine Johnson Martin | Director | May 14 '24 | Buy | 48.05 | 842 | 40,458 | 9,927 | May 14 08:03 PM | | LANGAN ERIC SCOTT | President and CEO | Mar 15 '24 | Buy | 54.54 | 1,000 | 54,540 | 703,000 | Mar 18 06:10 AM | | Barabash Yura V | Director | Feb 26 '24 | Buy | 55.95 | 188 | 10,518 | 1,149 | Feb 26 06:50 PM | | ADW Capital Management, LLC | 10% Owner | Sep 27 '23 | Sale | 60.11 | 8,000 | 480,880 | 941,000 | Sep 28 11:00 AM |
|
|
| |
 |
| Market Cap | 74.92M | EPS (ttm) | 0.03 |
| P/E | 150.94 | EPS this Y | 3300.00% |
| Forward P/E | 11.51 | EPS next Y | 2.94% |
| PEG | - | EPS past 5Y | - |
| P/S | 1.13 | EPS next 5Y | - |
| P/B | 1.19 | EPS Q/Q | 35.21% |
| Dividend | - | Sales Q/Q | -26.35% |
| Insider Own | 88.69% | Inst Own | 3.67% |
| Insider Trans | 0.02% | Inst Trans | 20.63% |
| Short Float | 0.30% | Earnings | May 07/a |
| Analyst Recom | 1.00 | Target Price | 9.00 |
| Avg Volume | 4.24K | 52W Range | 3.40 - 6.40 |
|
|
|
|
Stabilis Solutions, Inc. engages in the provision of small-scale liquefied natural gas production, distribution, and fueling services to multiple end markets. It operates through the following segments: LNG and Power Delivery. The LNG segment supplies LNG to the industrial, midstream, and oilfield sectors in North America and provides turnkey fuel solutions to help users of propane, diesel and other crude-based fuel products convert to LNG. The Power Delivery segment provides power delivery solutions to the global energy industry through its subsidiary in Brazil and joint venture in China. The company was founded on October 21, 1996 and is headquartered in Houston, TX. |
| Insider Trading |
Relationship |
Date |
Transaction |
Cost |
#Shares |
Value ($) |
#Shares Total |
SEC Form 4 |
| Mitchell Peter C. | Director | May 15 '24 | Buy | 4.14 | 3,564 | 14,753 | 25,000 | May 17 02:00 PM | | KUNTZ EDWARD L | Director | Nov 13 '23 | Buy | 4.91 | 5,000 | 24,550 | 58,172 | Nov 14 08:45 AM | | Ballard Westervelt T. JR | President and CEO | Aug 23 '23 | Option Exercise | 0.00 | 125,000 | 0 | 432,916 | Aug 25 04:46 PM | | KUNTZ EDWARD L | Director | May 26 '23 | Buy | 3.87 | 7,000 | 27,090 | 53,172 | May 30 04:13 PM |
|
|
|
 |
| Market Cap | 245.55M | EPS (ttm) | 0.78 |
| P/E | 15.98 | EPS this Y | 19.28% |
| Forward P/E | 10.30 | EPS next Y | 22.47% |
| PEG | - | EPS past 5Y | - |
| P/S | 2.09 | EPS next 5Y | - |
| P/B | 1.26 | EPS Q/Q | -19.64% |
| Dividend | 1.60% | Sales Q/Q | 36.41% |
| Insider Own | 24.56% | Inst Own | 34.47% |
| Insider Trans | 1.75% | Inst Trans | 0.91% |
| Short Float | 0.29% | Earnings | Apr 25/a |
| Analyst Recom | 2.25 | Target Price | 13.25 |
| Avg Volume | 16.80K | 52W Range | 9.12 - 12.97 |
|
|
|
|
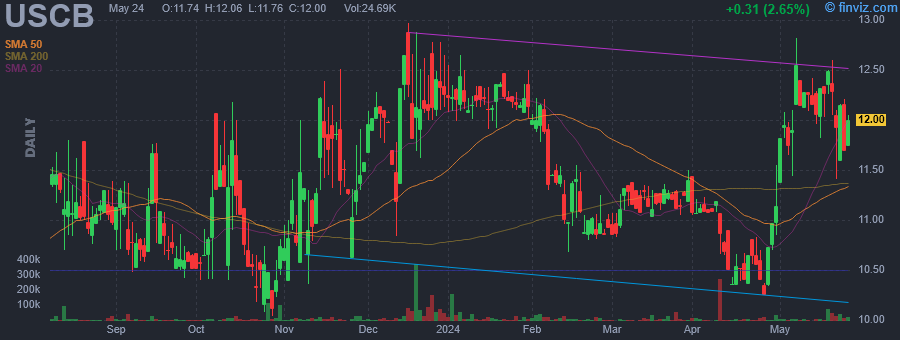
USCB Financial Holdings, Inc. operates as a bank holding company. The company was founded on December 17, 2021 and is headquartered in Doral, FL. |
| Insider Trading |
Relationship |
Date |
Transaction |
Cost |
#Shares |
Value ($) |
#Shares Total |
SEC Form 4 |
| Anderson Robert B. | Executive VP and CFO | May 16 '24 | Buy | 12.15 | 525 | 6,379 | 79,933 | May 17 01:34 PM | | Anderson Robert B. | Executive VP and CFO | May 15 '24 | Buy | 12.13 | 5,000 | 60,650 | 79,408 | May 17 01:34 PM | | Anderson Robert B. | Executive VP and CFO | May 07 '24 | Buy | 12.38 | 3,000 | 37,140 | 74,408 | May 07 01:51 PM | | Anderson Robert B. | Executive VP and CFO | May 06 '24 | Buy | 11.91 | 3,000 | 35,730 | 71,408 | May 07 01:51 PM | | Anderson Robert B. | Executive VP and CFO | May 01 '24 | Buy | 11.48 | 987 | 11,331 | 68,408 | May 01 03:48 PM |
|
|
| |
 |
| Market Cap | 16.45B | EPS (ttm) | 8.00 |
| P/E | 22.88 | EPS this Y | -0.86% |
| Forward P/E | 18.53 | EPS next Y | 14.58% |
| PEG | - | EPS past 5Y | 1.69% |
| P/S | 2.11 | EPS next 5Y | -14.29% |
| P/B | 4.08 | EPS Q/Q | -22.60% |
| Dividend | 2.74% | Sales Q/Q | 0.16% |
| Insider Own | 2.13% | Inst Own | 90.19% |
| Insider Trans | -4.54% | Inst Trans | 0.04% |
| Short Float | 1.55% | Earnings | Apr 22/a |
| Analyst Recom | 2.60 | Target Price | 186.67 |
| Avg Volume | 650.90K | 52W Range | 122.20 - 191.27 |
|
|
|
|
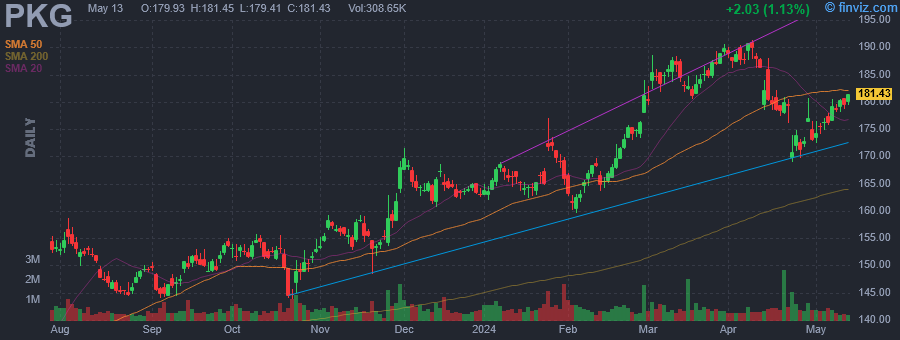
Packaging Corporation of America engages in the production of container products. It operates through the following segments: Packaging, Paper, and Corporate and Other. The Packaging segment offers a variety of corrugated packaging products, such as conventional shipping containers. The Paper segment manufactures and sells a range of papers, including communication-based papers, and pressure sensitive papers. The Corporate and Other segment focuses on transportation assets, such as rail cars, and trucks. The company was founded in 1959 and is headquartered in Lake Forest, IL. |
| Insider Trading |
Relationship |
Date |
Transaction |
Cost |
#Shares |
Value ($) |
#Shares Total |
SEC Form 4 |
| GOWLAND KAREN E | Director | May 15 '24 | Buy | 182.06 | 300 | 54,618 | 916 | May 17 01:11 PM | | Mundy Robert P. | EVP & CFO | Mar 06 '24 | Sale | 182.51 | 10,000 | 1,825,100 | 46,454 | Mar 08 10:19 AM | | KOWLZAN MARK W | Chairman & CEO | Mar 04 '24 | Sale | 186.70 | 53,196 | 9,931,693 | 474,010 | Mar 06 04:55 PM | | Hassfurther Thomas A | Exec. VP | Feb 29 '24 | Sale | 181.06 | 13,850 | 2,507,681 | 187,647 | Mar 01 02:13 PM | | Hassfurther Thomas A | Exec. VP | Feb 22 '24 | Sale | 173.80 | 14,191 | 2,466,396 | 183,930 | Feb 26 12:52 PM |
|
|
|
 |
| Market Cap | 246.16M | EPS (ttm) | -0.19 |
| P/E | - | EPS this Y | - |
| Forward P/E | - | EPS next Y | - |
| PEG | - | EPS past 5Y | - |
| P/S | 13.37 | EPS next 5Y | - |
| P/B | 0.91 | EPS Q/Q | - |
| Dividend | 3.54% | Sales Q/Q | 3.60% |
| Insider Own | - | Inst Own | 31.22% |
| Insider Trans | - | Inst Trans | - |
| Short Float | 0.11% | Earnings | - |
| Analyst Recom | - | Target Price | - |
| Avg Volume | 32.13K | 52W Range | 8.58 - 10.32 |
|
|
|
|
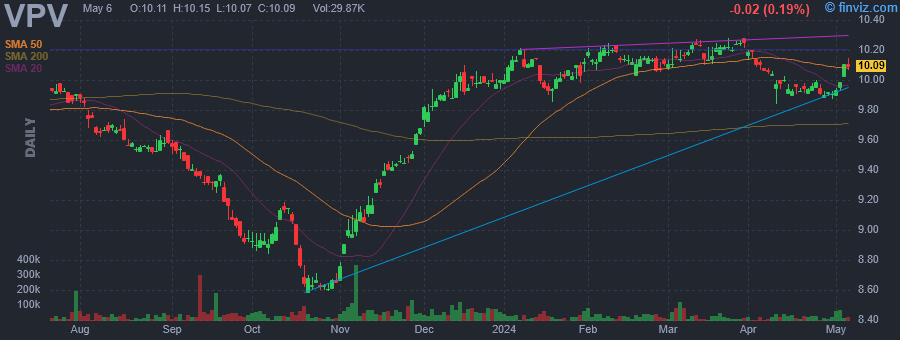
Invesco Pennsylvania Value Municipal Income Trust is a closed-ended fixed income mutual fund launched by Invesco Ltd. The fund is co-managed by Invesco Advisers, Inc., INVESCO Asset Management (Japan) Limited, INVESCO Asset Management Deutschland GmbH, INVESCO Asset Management Limited, Invesco Canada Ltd., Invesco Hong Kong Limited, and INVESCO Senior Secured Management, Inc. It invests in the fixed income markets of the United States. The fund primarily invests in investment grade Pennsylvania municipal securities which include municipal bonds, municipal notes, municipal commercial paper, and lease obligations. It employs fundamental analysis with bottom-up security selection approach to create its portfolio. The fund was formerly known as Invesco Van Kampen Pennsylvania Value Municipal Income Trust. Invesco Pennsylvania Value Municipal Income Trust was formed on April 30, 1993 and is domiciled in the United States. |
| Insider Trading |
Relationship |
Date |
Transaction |
Cost |
#Shares |
Value ($) |
#Shares Total |
SEC Form 4 |
| Saba Capital Management, L.P. | 10% Owner | May 15 '24 | Buy | 10.28 | 7,265 | 74,684 | 2,883,105 | May 17 01:11 PM | | Saba Capital Management, L.P. | 10% Owner | May 03 '24 | Buy | 10.06 | 2,199 | 22,122 | 2,875,840 | May 07 05:23 PM | | Saba Capital Management, L.P. | 10% Owner | May 02 '24 | Buy | 9.96 | 30,935 | 308,113 | 2,873,641 | May 03 01:24 PM | | Saba Capital Management, L.P. | 10% Owner | Apr 15 '24 | Buy | 9.94 | 2,973 | 29,552 | 2,842,701 | Apr 15 05:15 PM | | Saba Capital Management, L.P. | 10% Owner | Apr 12 '24 | Buy | 10.01 | 13,333 | 133,463 | 2,839,728 | Apr 15 05:15 PM |
|
|
|
 |
| Market Cap | 444.06M | EPS (ttm) | -0.24 |
| P/E | - | EPS this Y | - |
| Forward P/E | - | EPS next Y | - |
| PEG | - | EPS past 5Y | - |
| P/S | 14.06 | EPS next 5Y | - |
| P/B | 0.92 | EPS Q/Q | - |
| Dividend | 3.45% | Sales Q/Q | 5.80% |
| Insider Own | - | Inst Own | 33.09% |
| Insider Trans | - | Inst Trans | - |
| Short Float | 0.13% | Earnings | - |
| Analyst Recom | - | Target Price | - |
| Avg Volume | 53.87K | 52W Range | 9.65 - 12.03 |
|
|
|
|
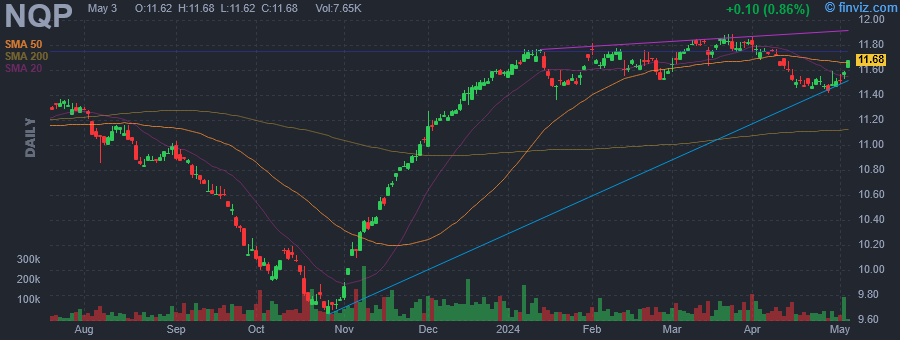
Nuveen Pennsylvania Quality Municipal Income Fund is a closed ended fixed income mutual fund launched by Nuveen Investments, Inc. The fund is co-managed by Nuveen Fund Advisors LLC and Nuveen Asset Management, LLC. It invests in the fixed income markets of Pennsylvania. The fund invests in tax exempt municipal bonds, with a rating of Baa/BBB or higher. It employs fundamental analysis, with bottom-up stock picking approach, to create its portfolio. The fund benchmarks the performance of its portfolio against the Standard & Poor's Pennsylvania Municipal Bond Index and Standard & Poor's National Municipal Bond Index. The fund was formerly known a Nuveen Pennsylvania Investment Quality Municipal Fund. Nuveen Pennsylvania Quality Municipal Income Fund was formed on December 20, 1990 and is domiciled in the United States. |
| Insider Trading |
Relationship |
Date |
Transaction |
Cost |
#Shares |
Value ($) |
#Shares Total |
SEC Form 4 |
| Saba Capital Management, L.P. | 10% Owner | May 15 '24 | Buy | 12.00 | 8,068 | 96,816 | 5,170,599 | May 17 01:07 PM | | Saba Capital Management, L.P. | 10% Owner | May 03 '24 | Buy | 11.65 | 1,234 | 14,376 | 5,162,531 | May 07 05:16 PM | | Saba Capital Management, L.P. | 10% Owner | May 02 '24 | Buy | 11.55 | 65,807 | 760,071 | 5,161,297 | May 03 01:14 PM | | Saba Capital Management, L.P. | 10% Owner | Apr 29 '24 | Buy | 11.49 | 7,796 | 89,576 | 5,095,490 | May 01 10:28 AM | | Saba Capital Management, L.P. | 10% Owner | Apr 25 '24 | Buy | 11.46 | 31,908 | 365,666 | 5,087,694 | Apr 26 11:51 AM |
|
|
|
