 |
| Market Cap | 2.16B | EPS (ttm) | 0.26 |
| P/E | 96.26 | EPS this Y | 71.87% |
| Forward P/E | 12.87 | EPS next Y | 328.56% |
| PEG | - | EPS past 5Y | - |
| P/S | 18.38 | EPS next 5Y | - |
| P/B | 1.79 | EPS Q/Q | - |
| Dividend | - | Sales Q/Q | - |
| Insider Own | 0.13% | Inst Own | 8.81% |
| Insider Trans | 0.00% | Inst Trans | - |
| Short Float | 0.91% | Earnings | Mar 26/b |
| Analyst Recom | 1.00 | Target Price | 27.75 |
| Avg Volume | 153.32K | 52W Range | 16.29 - 24.44 |
|
|
|
|
Cadeler A/S engages in the supplier within the offshore wind industry for installation services and operations and maintenance works. It owns Windfarm Installation Vessels, Pacific Orca, and Pacific Osprey. In addition, it also offers construction and decommissioning tasks. The company was founded in 2008 and is headquartered in Copenhagen, Denmark. |
|
 |
 |
| Market Cap | 1.16B | EPS (ttm) | -2.05 |
| P/E | - | EPS this Y | 129.59% |
| Forward P/E | 14.84 | EPS next Y | 53.46% |
| PEG | - | EPS past 5Y | - |
| P/S | 0.28 | EPS next 5Y | 10.00% |
| P/B | 0.89 | EPS Q/Q | 131.45% |
| Dividend | - | Sales Q/Q | 35.13% |
| Insider Own | 17.65% | Inst Own | 63.10% |
| Insider Trans | -6.43% | Inst Trans | -0.84% |
| Short Float | 4.01% | Earnings | Apr 25/a |
| Analyst Recom | 2.00 | Target Price | 15.50 |
| Avg Volume | 489.28K | 52W Range | 5.24 - 22.09 |
|
|
|
|
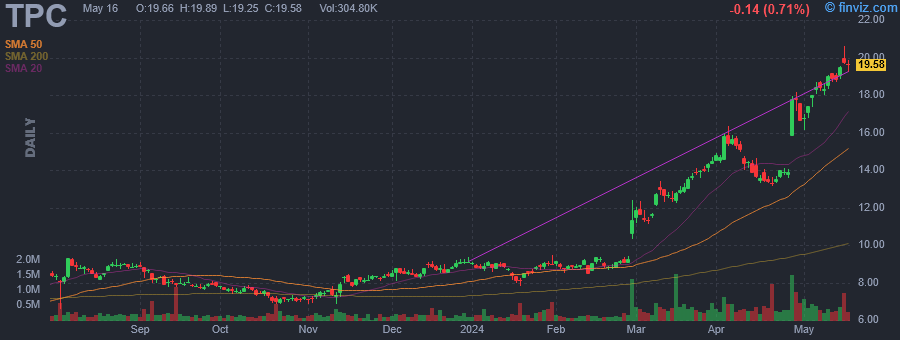
Tutor Perini Corp. engages in the provision of construction services. It operates through the following business segments: Civil, Building, and Specialty Contractors. The Civil segment specializes in public works construction and the replacement and reconstruction of infrastructure across the major geographic regions of the United States. The Building segment offers services to a number of specialized building markets for private and public works customers, including hospitality and gaming, transportation, health care, commercial offices, government facilities, sports and entertainment, education, correctional facilities, biotech, pharmaceutical, industrial, and high-tech. The Specialty Contractors segment covers electrical, mechanical, plumbing, HVAC, fire protection systems and pneumatically placed concrete for a full range of civil and building construction projects in the industrial, commercial, hospitality and gaming, and mass-transit end markets. The company was founded by Bonfiglio Perini in 1918 and is headquartered in Sylmar, CA. |
| Insider Trading |
Relationship |
Date |
Transaction |
Cost |
#Shares |
Value ($) |
#Shares Total |
SEC Form 4 |
| KLEIN MICHAEL R | Director | May 16 '24 | Sale | 19.41 | 183,750 | 3,566,588 | 25,226 | May 17 07:32 PM | | KLEIN MICHAEL R | Director | May 15 '24 | Sale | 19.99 | 181,155 | 3,621,288 | 208,976 | May 17 07:32 PM | | SMALLEY GARY G. | President | Mar 20 '24 | Sale | 13.28 | 15,940 | 211,683 | 68,346 | Mar 20 05:50 PM | | SMALLEY GARY G. | President | Mar 19 '24 | Sale | 13.02 | 27,959 | 364,026 | 84,286 | Mar 20 05:50 PM | | SMALLEY GARY G. | President | Mar 18 '24 | Sale | 12.86 | 27,958 | 359,540 | 112,245 | Mar 20 05:50 PM |
|
|
|
 |
| Market Cap | 5.71B | EPS (ttm) | -2.88 |
| P/E | - | EPS this Y | 2.59% |
| Forward P/E | - | EPS next Y | 41.46% |
| PEG | - | EPS past 5Y | -49.95% |
| P/S | 17.49 | EPS next 5Y | 8.00% |
| P/B | 12.54 | EPS Q/Q | -13.90% |
| Dividend | - | Sales Q/Q | 15.86% |
| Insider Own | 3.68% | Inst Own | 103.03% |
| Insider Trans | -25.69% | Inst Trans | 1.34% |
| Short Float | 6.70% | Earnings | May 01/a |
| Analyst Recom | 1.53 | Target Price | 112.80 |
| Avg Volume | 477.81K | 52W Range | 54.38 - 113.97 |
|
|
|
|
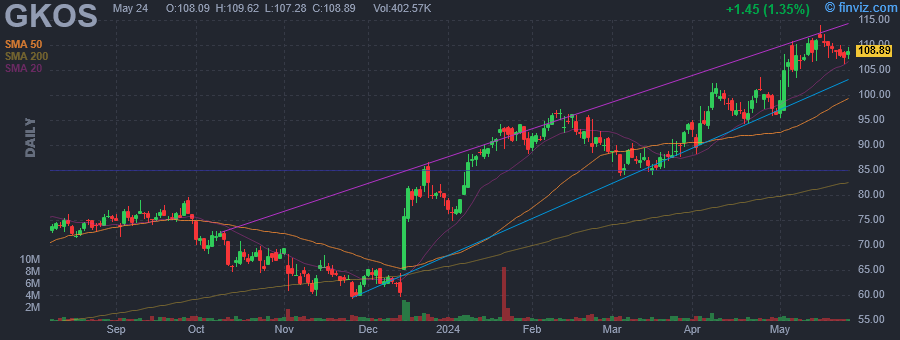
Glaukos Corp. is an ophthalmic medical technology and pharmaceutical company, which focuses on novel therapies for the treatment of glaucoma, corneal disorders, and retinal diseases. It engages in development and commercialization of therapies across several end markets within ophthalmology. The company was founded by Olav B. Bergheim, Morteza Gharib, and Richard Hill on July 14, 1998 and is headquartered in Aliso Viejo, CA. |
| Insider Trading |
Relationship |
Date |
Transaction |
Cost |
#Shares |
Value ($) |
#Shares Total |
SEC Form 4 |
| Stapley Marc | Director | May 15 '24 | Option Exercise | 32.00 | 6,250 | 200,000 | 38,610 | May 16 07:45 PM | | Stapley Marc | Director | May 15 '24 | Sale | 112.80 | 6,250 | 704,993 | 32,360 | May 16 07:45 PM | | Gilliam Joseph E | PRESIDENT & COO | May 10 '24 | Option Exercise | 55.18 | 2,395 | 132,156 | 104,240 | May 14 04:43 PM | | Gilliam Joseph E | PRESIDENT & COO | May 10 '24 | Sale | 110.56 | 2,395 | 264,791 | 101,845 | May 14 04:43 PM | | Thurman Alex R. | SVP & CHIEF FINANCIAL OFFICER | May 10 '24 | Sale | 110.51 | 353 | 39,011 | 51,647 | May 14 04:41 PM |
|
|
| |
 |
| Market Cap | 152.39B | EPS (ttm) | 7.94 |
| P/E | 13.64 | EPS this Y | -1.24% |
| Forward P/E | 12.15 | EPS next Y | 7.46% |
| PEG | 2.88 | EPS past 5Y | 3.64% |
| P/S | 1.69 | EPS next 5Y | 4.73% |
| P/B | 1.88 | EPS Q/Q | 9.05% |
| Dividend | 3.80% | Sales Q/Q | 16.68% |
| Insider Own | 0.01% | Inst Own | 48.78% |
| Insider Trans | 0.00% | Inst Trans | -0.94% |
| Short Float | 1.28% | Earnings | May 30/b |
| Analyst Recom | 2.40 | Target Price | 96.19 |
| Avg Volume | 1.07M | 52W Range | 77.90 - 107.19 |
|
|
|
|
Royal Bank of Canada engages in the provision of banking and financial services. It operates through the following segments: Personal and Commercial Banking, Wealth Management, Insurance, Capital Markets, and Corporate Support. The Personal and Commercial Banking segment deals with a broad suite of financial products and services in both individual and business clients in Canada, the Caribbean, and the U.S. The Wealth Management segment offers a suite of wealth, investment, trust, banking, credit, and other advice-based solutions. It also offers other wealth management solutions to institutional and individual clients through its distribution channels and third-party distributors. The Insurance segment refers to a suite of advice and solutions for individual and business clients including life, health, wealth, property and casualty, travel, group benefits, annuities, and reinsurance. The Capital Markets segment is involved in the provision of advisory and origination, sales and trading, lending and financing and transaction banking to corporations, institutional clients, asset managers, private equity firms and governments globally. The Corporate Support segment consists of technology and operations services. The company was founded by J. W. Merkell, Edward Kenny, T. C. Kinnear, James B. Duffus, William Cunard, John Tobin, George P. Mitchell and Jeremiah Northup in 1864 and is headquartered in Toronto, Canada. |
|
|
 |
| Market Cap | 143.48B | EPS (ttm) | 5.54 |
| P/E | 72.98 | EPS this Y | 10.02% |
| Forward P/E | 54.89 | EPS next Y | 17.30% |
| PEG | 5.81 | EPS past 5Y | 9.71% |
| P/S | 19.60 | EPS next 5Y | 12.56% |
| P/B | 10.28 | EPS Q/Q | 51.45% |
| Dividend | - | Sales Q/Q | 11.46% |
| Insider Own | 0.69% | Inst Own | 86.16% |
| Insider Trans | -10.14% | Inst Trans | -0.44% |
| Short Float | 1.04% | Earnings | Apr 18/a |
| Analyst Recom | 1.97 | Target Price | 428.53 |
| Avg Volume | 1.41M | 52W Range | 254.85 - 408.43 |
|
|
| Today | Initiated |
Goldman |
Buy |
$500 |
|
|
|
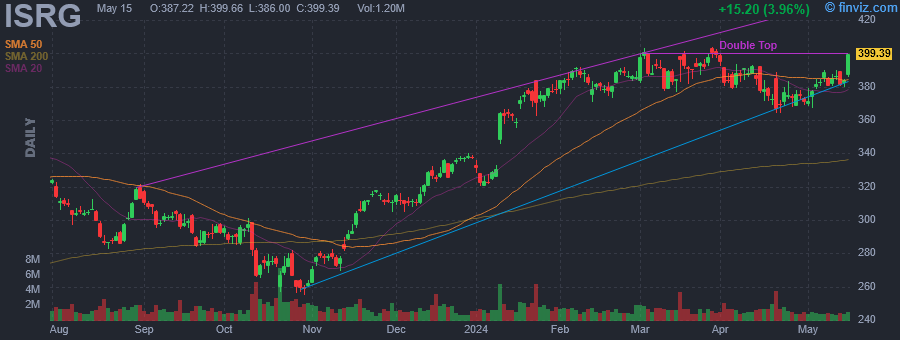
Intuitive Surgical, Inc. engages in the provision of robotic-assisted surgical solutions and invasive care through a comprehensive ecosystem of products and services. Its products include Da Vinci Surgical and Ion Endoluminal systems. The company was founded by Frederic H. Moll, John Gordon Freund, and Robert G. Younge in November 1995 and is headquartered in Sunnyvale, CA. |
| Insider Trading |
Relationship |
Date |
Transaction |
Cost |
#Shares |
Value ($) |
#Shares Total |
SEC Form 4 |
| Brosius Mark | SVP & Chief Mfg and Supply Cha | May 17 '24 | Sale | 396.19 | 63 | 24,960 | 295 | May 17 06:05 PM | | Miller Brian Edward | EVP & Chief Digital Officer | May 16 '24 | Sale | 400.00 | 2,553 | 1,021,200 | 9,619 | May 17 04:33 PM | | Brosius Mark | SVP & Chief Mfg and Supply Cha | May 16 '24 | Sale | 398.28 | 175 | 69,699 | 358 | May 17 06:05 PM | | Brosius Mark | SVP & Chief Mfg and Supply Cha | May 15 '24 | Sale | 387.22 | 175 | 67,764 | 533 | May 15 05:39 PM | | Brosius Mark | SVP & Chief Mfg and Supply Cha | May 14 '24 | Sale | 380.85 | 175 | 66,649 | 708 | May 15 05:39 PM |
|
|
| |
 |
| Market Cap | 2.17B | EPS (ttm) | 0.04 |
| P/E | 55.23 | EPS this Y | -135.60% |
| Forward P/E | - | EPS next Y | 53.19% |
| PEG | - | EPS past 5Y | - |
| P/S | 282.97 | EPS next 5Y | - |
| P/B | 4.70 | EPS Q/Q | -223.53% |
| Dividend | - | Sales Q/Q | -71.87% |
| Insider Own | 0.85% | Inst Own | 45.58% |
| Insider Trans | 0.00% | Inst Trans | -8.39% |
| Short Float | 4.84% | Earnings | May 08/a |
| Analyst Recom | 1.43 | Target Price | 3.09 |
| Avg Volume | 16.10M | 52W Range | 1.00 - 2.42 |
|
|
|
|
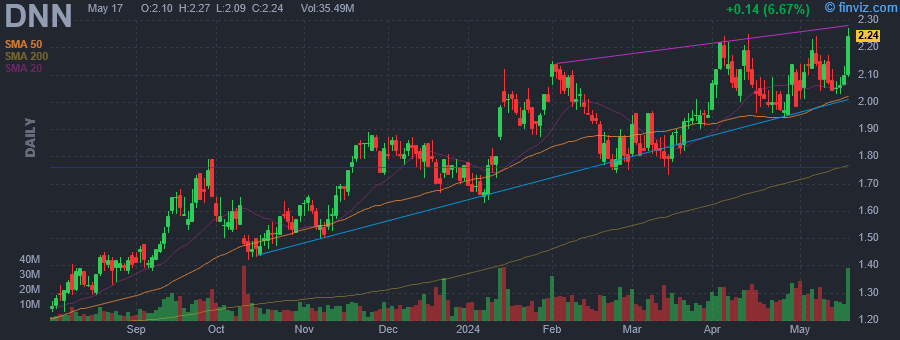
Denison Mines Corp. engages in the exploration and development of uranium. The firm has interests in the Athabasca Basin, Wheeler River, Midwest Project, McClean Lake, and Waterbury Lake. The company was founded on May 9, 1997 and is headquartered in Toronto, Canada. |
|
|
 |
| Market Cap | 8.30B | EPS (ttm) | 1.51 |
| P/E | 33.40 | EPS this Y | 8.60% |
| Forward P/E | 26.08 | EPS next Y | 9.44% |
| PEG | 3.39 | EPS past 5Y | 13.25% |
| P/S | 3.38 | EPS next 5Y | 9.85% |
| P/B | 4.75 | EPS Q/Q | 80.87% |
| Dividend | 1.02% | Sales Q/Q | 5.93% |
| Insider Own | 2.63% | Inst Own | 90.50% |
| Insider Trans | -0.95% | Inst Trans | 0.81% |
| Short Float | 3.53% | Earnings | May 08/b |
| Analyst Recom | 2.09 | Target Price | 49.37 |
| Avg Volume | 1.19M | 52W Range | 35.06 - 50.26 |
|
|
|
|
The New York Times Co. is a media organization, which engages in creating, collecting, and distributing news and information. It offers news products and other interest-specific products, and related content and services. It offers newspapers, print, and digital products and investments. The firm also manages The New York Times, NYTimes.com, and mobile applications. The company was founded by Henry Jarvis Raymond and George Jones on September 18, 1851, and is headquartered in New York, NY. |
| Insider Trading |
Relationship |
Date |
Transaction |
Cost |
#Shares |
Value ($) |
#Shares Total |
SEC Form 4 |
| BENTEN R ANTHONY | SVP, Treasurer & CAO | May 21 '24 | Sale | 48.98 | 5,171 | 253,283 | 38,576 | May 23 05:25 PM | | KOPIT LEVIEN MEREDITH A. | PRESIDENT & CEO | May 10 '24 | Sale | 47.72 | 12,548 | 598,841 | 120,072 | May 14 05:05 PM | | Brayton Diane | EVP, GENERAL COUNSEL | Feb 22 '24 | Sale | 42.84 | 7,000 | 299,880 | 39,312 | Feb 23 05:25 PM | | KOPIT LEVIEN MEREDITH A. | PRESIDENT & CEO | Feb 16 '24 | Sale | 44.11 | 13,543 | 597,382 | 90,759 | Feb 21 05:19 PM | | Perpich David S. | Director | Feb 14 '24 | Sale | 44.03 | 3,014 | 132,706 | 20,813 | Feb 15 04:21 PM |
|
|
| |
 |
| Market Cap | 199.12B | EPS (ttm) | 7.35 |
| P/E | 23.12 | EPS this Y | 31.68% |
| Forward P/E | 15.12 | EPS next Y | 23.14% |
| PEG | 0.90 | EPS past 5Y | 15.59% |
| P/S | 2.54 | EPS next 5Y | 25.78% |
| P/B | 3.22 | EPS Q/Q | 26.03% |
| Dividend | 1.56% | Sales Q/Q | -0.19% |
| Insider Own | 62.37% | Inst Own | 38.98% |
| Insider Trans | -2.63% | Inst Trans | -1.05% |
| Short Float | 5.31% | Earnings | Apr 25/a |
| Analyst Recom | 1.50 | Target Price | 186.24 |
| Avg Volume | 4.39M | 52W Range | 124.92 - 169.11 |
|
|
|
|
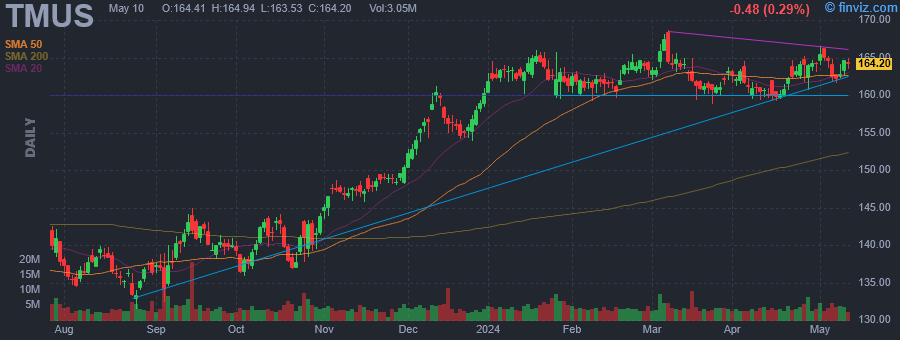
T-Mobile US, Inc. engages in the provision of wireless communications services under the T-Mobile and MetroPCS brands. It offers postpaid and prepaid wireless voice, messaging and data services, and wholesale wireless services. The company was founded in 1994 and is headquartered in Bellevue, WA. |
| Insider Trading |
Relationship |
Date |
Transaction |
Cost |
#Shares |
Value ($) |
#Shares Total |
SEC Form 4 |
| DEUTSCHE TELEKOM AG | Director | May 24 '28 | Sale | 165.66 | 189,670 | 31,421,035 | 674,313,641 | May 28 07:30 PM | | DEUTSCHE TELEKOM AG | Director | May 28 '24 | Sale | 167.13 | 189,670 | 31,699,768 | 674,123,971 | May 28 07:30 PM | | DEUTSCHE TELEKOM AG | Director | May 23 '24 | Sale | 164.98 | 189,670 | 31,291,014 | 674,503,311 | May 23 09:52 PM | | Freier Jon | President, Consumer Group | May 23 '24 | Sale | 164.38 | 20,000 | 3,287,600 | 172,628 | May 28 05:01 PM | | DEUTSCHE TELEKOM AG | Director | May 22 '24 | Sale | 165.06 | 189,670 | 31,307,408 | 674,692,981 | May 23 09:52 PM |
|
|
|
 |
| Market Cap | 8.74B | EPS (ttm) | -2.64 |
| P/E | - | EPS this Y | 5.76% |
| Forward P/E | 16.56 | EPS next Y | 13.56% |
| PEG | - | EPS past 5Y | - |
| P/S | 2.00 | EPS next 5Y | 8.93% |
| P/B | 1.44 | EPS Q/Q | -69.14% |
| Dividend | - | Sales Q/Q | -4.14% |
| Insider Own | 1.17% | Inst Own | 98.01% |
| Insider Trans | 0.93% | Inst Trans | -3.01% |
| Short Float | 3.47% | Earnings | May 08/b |
| Analyst Recom | 2.07 | Target Price | 19.09 |
| Avg Volume | 4.22M | 52W Range | 7.88 - 17.58 |
|
|
|
|
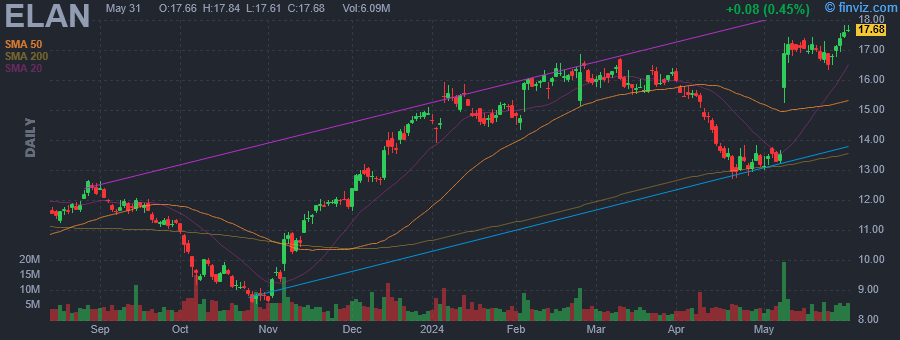
Elanco Animal Health, Inc. innovates, develops, manufactures, and markets products for pets and farm animals. It offers products through the following four categories: Companion Animal Disease Prevention, Companion Animal Therapeutics, Food Animal Future Protein & Health, and Food Animal Ruminants & Swine. The Companion Animal Disease Prevention category engages in the broadest parasiticide portfolios in the companion animal sector based on indications, species and formulations, with products that protect pets from worms, fleas and ticks. The Companion Animal Therapeutics category provides the details of a broad pain and osteoarthritis portfolio across species, modes of action, indications and disease stages. The Food Animal Future Protein & Health category includes vaccines, nutritional enzymes and animal-only antibiotics, serves the growing demand for protein and includes innovative products in poultry and aquaculture production, where demand for animal health products is outpacing overall industry growth. It also focuses on developing functional nutritional health products that promote food animal health, including enzymes, probiotics and prebiotics. The Food Animal Ruminants & Swine category develops animal food products used in ruminant and swine production. The company was founded in 1954 and is headquartered in Greenfield, IN. |
| Insider Trading |
Relationship |
Date |
Transaction |
Cost |
#Shares |
Value ($) |
#Shares Total |
SEC Form 4 |
| DOYLE WILLIAM F | Director | May 21 '24 | Buy | 16.98 | 15,000 | 254,700 | 76,330 | May 23 04:33 PM | | DOYLE WILLIAM F | Director | Mar 08 '24 | Buy | 16.30 | 15,000 | 244,500 | 61,330 | Mar 12 04:32 PM | | Harrington Michael J | Director | Mar 08 '24 | Buy | 16.29 | 3,100 | 50,494 | 77,594 | Mar 12 04:30 PM | | HOOVER R DAVID | Director | Mar 06 '24 | Buy | 16.14 | 20,000 | 322,808 | 185,000 | Mar 08 05:09 PM |
|
|
|
 |
| Market Cap | 27.66B | EPS (ttm) | 29.29 |
| P/E | 37.12 | EPS this Y | 6.50% |
| Forward P/E | 30.47 | EPS next Y | 14.90% |
| PEG | 3.66 | EPS past 5Y | 26.96% |
| P/S | 6.45 | EPS next 5Y | 10.15% |
| P/B | 13.25 | EPS Q/Q | 42.87% |
| Dividend | - | Sales Q/Q | 21.30% |
| Insider Own | 0.97% | Inst Own | 100.37% |
| Insider Trans | -22.40% | Inst Trans | -0.11% |
| Short Float | 3.64% | Earnings | May 23/a |
| Analyst Recom | 1.77 | Target Price | 1063.60 |
| Avg Volume | 465.29K | 52W Range | 464.25 - 1083.71 |
|
|
|
|
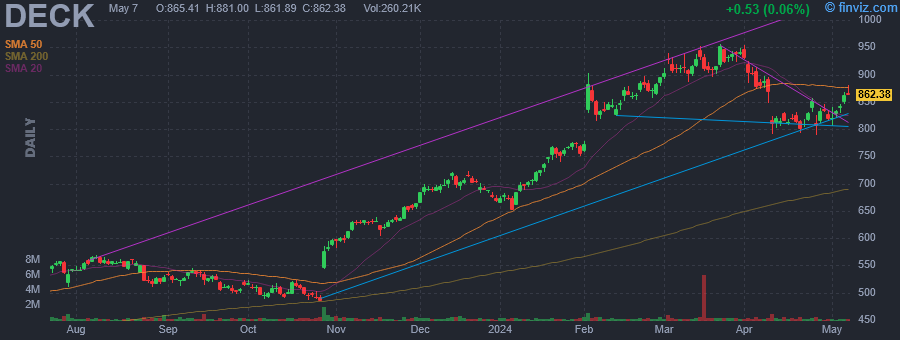
Deckers Outdoor Corp. engages in the business of designing, marketing, and distributing footwear, apparel, and accessories developed for both everyday casual lifestyle use and high performance activities. It operates through the following segments: UGG Brand, HOKA Brand, Teva Brand, Sanuk Brand, Other Brands, and Direct-to-Consumer. The UGG Brand segment offers a line of premium footwear, apparel, and accessories. The HOKA Brand segment sells footwear and apparel that offers enhanced cushioning and inherent stability with minimal weight, originally designed for ultra-runners. The Teva Brand segment focuses on the sport sandal and modern outdoor lifestyle category, such as sandals, shoes, and boots. The Sanuk Brand segment originated in Southern California surf culture and has emerged into a lifestyle brand with a presence in the relaxed casual shoe and sandal categories. The Other Brands segment includes the Koolaburra by UGG brand. The Direct-to-Consumer segment consists of retail stores and e-commerce websites. The company was founded by Douglas B. Otto in 1973 and is headquartered in Goleta, CA. |
| Insider Trading |
Relationship |
Date |
Transaction |
Cost |
#Shares |
Value ($) |
#Shares Total |
SEC Form 4 |
| Garcia Thomas | Chief Administrative Officer | May 29 '24 | Sale | 1074.86 | 4,000 | 4,299,440 | 11,654 | May 29 07:26 PM | | DEVINE MICHAEL F III | Director | May 29 '24 | Sale | 1077.00 | 2,000 | 2,154,000 | 6,204 | May 29 05:20 PM | | Powers David | President & CEO | Apr 15 '24 | Option Exercise | 69.29 | 5,993 | 415,255 | 104,211 | Apr 16 08:04 PM | | Powers David | President & CEO | Apr 15 '24 | Sale | 824.11 | 5,993 | 4,938,909 | 98,218 | Apr 16 08:04 PM | | Powers David | President & CEO | Mar 15 '24 | Option Exercise | 69.29 | 5,993 | 415,255 | 104,211 | Mar 18 05:17 PM |
|
|
|
