 |
| Market Cap | 1.55B | EPS (ttm) | 1.83 |
| P/E | 23.46 | EPS this Y | 1.96% |
| Forward P/E | 17.67 | EPS next Y | 17.07% |
| PEG | 1.07 | EPS past 5Y | 29.60% |
| P/S | 0.55 | EPS next 5Y | 22.00% |
| P/B | 1.43 | EPS Q/Q | 10.77% |
| Dividend | 1.53% | Sales Q/Q | -2.75% |
| Insider Own | 2.59% | Inst Own | 95.29% |
| Insider Trans | -3.89% | Inst Trans | 0.44% |
| Short Float | 2.16% | Earnings | May 01/a |
| Analyst Recom | 2.00 | Target Price | 35.75 |
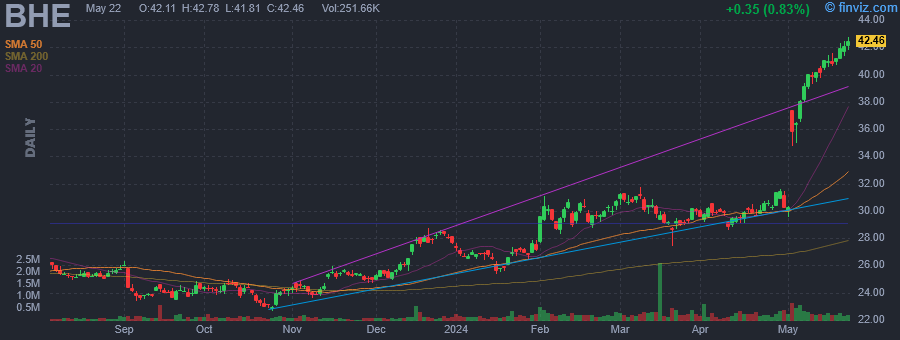
| Avg Volume | 338.86K | 52W Range | 22.50 - 42.78 |
|
|
|
|
Benchmark Electronics, Inc. engages in the provision of integrated electronic manufacturing services, engineering and design services, and technology solutions. It operates through the following geographical segments: Americas, Asia, and Europe. The firm offers services to original equipment manufacturers of industrial control telecommunication equipment, computers, and related products for business enterprises, medical devices, and testing and instrumentation products. Its services include comprehensive and integrated design and manufacturing services and solutions from initial product concept to volume production, including direct order fulfillment and aftermarket services. The company was founded by Cary T. Fu, Steven A. Barton, and Donald E. Nigbor in 1979 and is headquartered in Tempe, AZ. |
| Insider Trading |
Relationship |
Date |
Transaction |
Cost |
#Shares |
Value ($) |
#Shares Total |
SEC Form 4 |
| McCreary Jeffrey Stephen | Director | May 08 '24 | Sale | 39.49 | 10,000 | 394,900 | 45,062 | May 08 05:09 PM | | JANICK JAN M | SVP, Chief Technology Officer | May 07 '24 | Sale | 38.87 | 6,777 | 263,422 | 67,774 | May 08 05:06 PM | | Kamal Arvind | Interim CFO | May 07 '24 | Sale | 38.38 | 783 | 30,052 | 20,735 | May 08 05:04 PM | | Benck Jeff | President and CEO | Feb 20 '24 | Option Exercise | 29.22 | 68,305 | 1,995,872 | 442,749 | Feb 22 09:33 PM | | Beaver Stephen J | SVP, General Counsel and CLO | Feb 20 '24 | Option Exercise | 0.00 | 13,213 | 0 | 86,779 | Feb 22 09:35 PM |
|
|
 |
 |
| Market Cap | 11.21B | EPS (ttm) | 2.81 |
| P/E | 81.04 | EPS this Y | 35.17% |
| Forward P/E | 35.37 | EPS next Y | 27.57% |
| PEG | 6.75 | EPS past 5Y | 7.12% |
| P/S | 13.26 | EPS next 5Y | 12.00% |
| P/B | 6.28 | EPS Q/Q | 59.47% |
| Dividend | - | Sales Q/Q | 14.90% |
| Insider Own | 0.80% | Inst Own | 99.72% |
| Insider Trans | -10.69% | Inst Trans | -2.93% |
| Short Float | 3.58% | Earnings | May 09/a |
| Analyst Recom | 1.33 | Target Price | 247.00 |
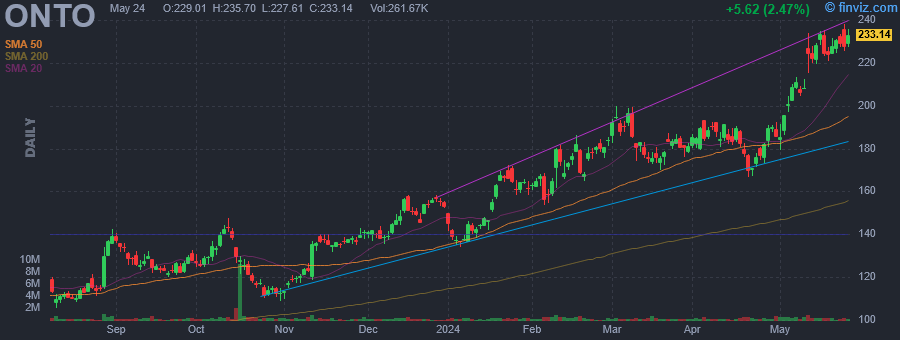
| Avg Volume | 424.00K | 52W Range | 94.83 - 235.42 |
|
|
|
|
Onto Innovation, Inc. engages in the business of designing, developing, manufacturing, and supporting high-performance control metrology, defect inspection, lithography, and data analysis systems used by microelectronics device manufacturers. The firm is also involved in providing process and yield management solutions used in bare silicon wafer production and wafer processing facilities. The company was founded in 1940 and is headquartered in Wilmington, MA. |
| Insider Trading |
Relationship |
Date |
Transaction |
Cost |
#Shares |
Value ($) |
#Shares Total |
SEC Form 4 |
| Plisinski Michael P | CEO | Mar 20 '24 | Sale | 175.48 | 40,000 | 7,019,129 | 235,492 | Mar 22 04:42 PM | | OH Yoon Ah | VP, General Counsel & Corp Sec | Mar 18 '24 | Sale | 180.00 | 1,685 | 303,300 | 14,913 | Mar 18 04:21 PM | | OH Yoon Ah | VP, General Counsel & Corp Sec | Mar 15 '24 | Sale | 173.96 | 2,685 | 467,083 | 16,598 | Mar 18 04:21 PM | | MILLER DAVID BRIAN | Director | Feb 13 '24 | Sale | 170.49 | 2,800 | 477,372 | 9,008 | Feb 13 06:01 PM | | Plisinski Michael P | CEO | Feb 10 '24 | Option Exercise | 0.00 | 19,050 | 0 | 276,572 | Feb 12 04:42 PM |
|
|
|
 |
| Market Cap | 18.33B | EPS (ttm) | 15.16 |
| P/E | 25.73 | EPS this Y | 21.54% |
| Forward P/E | 22.54 | EPS next Y | 6.76% |
| PEG | 25.73 | EPS past 5Y | 22.36% |
| P/S | 1.40 | EPS next 5Y | 1.00% |
| P/B | 7.01 | EPS Q/Q | 79.21% |
| Dividend | 0.18% | Sales Q/Q | 18.75% |
| Insider Own | 1.47% | Inst Own | 92.98% |
| Insider Trans | -1.51% | Inst Trans | -2.77% |
| Short Float | 1.05% | Earnings | Apr 25/b |
| Analyst Recom | 2.00 | Target Price | 403.83 |
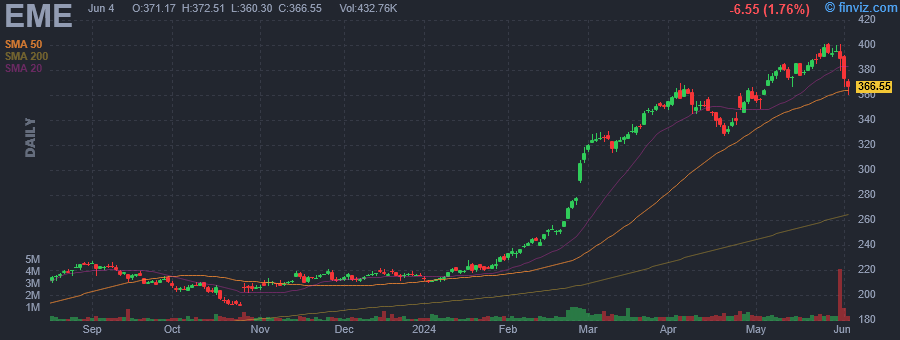
| Avg Volume | 490.20K | 52W Range | 161.49 - 392.61 |
|
|
|
|
EMCOR Group, Inc. engages in the provision of electrical and mechanical construction, and facilities services. It operates through the following segments: United States Electrical Construction and Facilities Services, United States Mechanical Construction and Facilities Services, United States Building Services, United States Industrial Services, and United Kingdom Building Services. The United States Electrical Construction and Facilities Services segment offers systems for electrical power transmission and distribution. The United States Mechanical Construction and Facilities Services segment is involved in systems for heating, ventilation, air conditioning, refrigeration, and clean-room process ventilation. The United States Building Services segment is composed of operations which provide a portfolio of services needed to support the operation and maintenance of customers' facilities. The United States Industrial Services segment covers operations which provide industrial maintenance and services. The United Kingdom Building Services segment consists of commercial and government site-based operations and maintenance, and facility maintenance and services. The company was founded in 1987 and is headquartered in Norwalk, CT. |
| Insider Trading |
Relationship |
Date |
Transaction |
Cost |
#Shares |
Value ($) |
#Shares Total |
SEC Form 4 |
| Mauricio Maxine Lum | CAO, EVP and General Counsel | May 22 '24 | Sale | 389.58 | 4,620 | 1,799,860 | 23,837 | May 23 04:04 PM | | Lind Robert Peter | VP and Controller | May 17 '24 | Sale | 377.85 | 0 | 174 | 5,488 | May 21 04:07 PM | | Nalbandian Jason R | SVP, CFO, Chief Acct. Officer | May 17 '24 | Sale | 377.85 | 0 | 166 | 13,644 | May 21 04:05 PM | | Lind Robert Peter | VP and Controller | Apr 30 '24 | Buy | 357.17 | 2 | 546 | 5,489 | May 21 04:07 PM | | Guzzi Anthony | Chairman, President and CEO | Mar 12 '24 | Sale | 319.65 | 6,000 | 1,917,900 | 219,023 | Mar 12 04:02 PM |
|
|
| |
 |
| Market Cap | 1.09B | EPS (ttm) | -2.05 |
| P/E | - | EPS this Y | 129.59% |
| Forward P/E | 13.91 | EPS next Y | 53.46% |
| PEG | - | EPS past 5Y | - |
| P/S | 0.26 | EPS next 5Y | 10.00% |
| P/B | 0.83 | EPS Q/Q | 131.45% |
| Dividend | - | Sales Q/Q | 35.13% |
| Insider Own | 17.65% | Inst Own | 63.10% |
| Insider Trans | -7.37% | Inst Trans | -0.84% |
| Short Float | 3.61% | Earnings | Apr 25/a |
| Analyst Recom | 2.00 | Target Price | 15.50 |
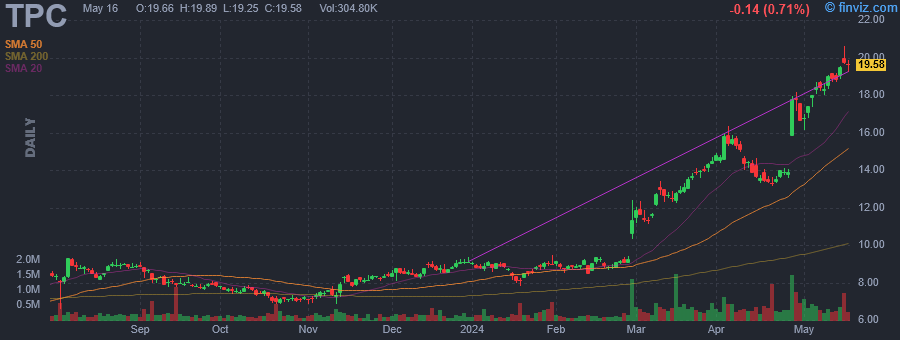
| Avg Volume | 487.85K | 52W Range | 5.24 - 21.01 |
|
|
|
|
Tutor Perini Corp. engages in the provision of construction services. It operates through the following business segments: Civil, Building, and Specialty Contractors. The Civil segment specializes in public works construction and the replacement and reconstruction of infrastructure across the major geographic regions of the United States. The Building segment offers services to a number of specialized building markets for private and public works customers, including hospitality and gaming, transportation, health care, commercial offices, government facilities, sports and entertainment, education, correctional facilities, biotech, pharmaceutical, industrial, and high-tech. The Specialty Contractors segment covers electrical, mechanical, plumbing, HVAC, fire protection systems and pneumatically placed concrete for a full range of civil and building construction projects in the industrial, commercial, hospitality and gaming, and mass-transit end markets. The company was founded by Bonfiglio Perini in 1918 and is headquartered in Sylmar, CA. |
| Insider Trading |
Relationship |
Date |
Transaction |
Cost |
#Shares |
Value ($) |
#Shares Total |
SEC Form 4 |
| KLEIN MICHAEL R | Director | May 16 '24 | Sale | 19.41 | 183,750 | 3,566,588 | 25,226 | May 17 07:32 PM | | KLEIN MICHAEL R | Director | May 15 '24 | Sale | 19.99 | 181,155 | 3,621,288 | 208,976 | May 17 07:32 PM | | SMALLEY GARY G. | President | Mar 20 '24 | Sale | 13.28 | 15,940 | 211,683 | 68,346 | Mar 20 05:50 PM | | SMALLEY GARY G. | President | Mar 19 '24 | Sale | 13.02 | 27,959 | 364,026 | 84,286 | Mar 20 05:50 PM | | SMALLEY GARY G. | President | Mar 18 '24 | Sale | 12.86 | 27,958 | 359,540 | 112,245 | Mar 20 05:50 PM |
|
|
|
 |
| Market Cap | 141.92M | EPS (ttm) | 0.64 |
| P/E | 21.36 | EPS this Y | - |
| Forward P/E | - | EPS next Y | - |
| PEG | - | EPS past 5Y | - |
| P/S | 1.16 | EPS next 5Y | - |
| P/B | 1.49 | EPS Q/Q | 170.87% |
| Dividend | - | Sales Q/Q | 35.18% |
| Insider Own | 50.64% | Inst Own | 15.31% |
| Insider Trans | 0.00% | Inst Trans | -0.20% |
| Short Float | 0.10% | Earnings | - |
| Analyst Recom | - | Target Price | - |
| Avg Volume | 8.88K | 52W Range | 5.46 - 13.75 |
|
|
|
|
TAT Technologies Ltd. provides a variety of services and products to the commercial and military aerospace and ground defense industries. It operates through the following business segments: Original Equipment Manufacturing (OEM) of Heat Transfer Solutions & Aviation Accessories; Maintenance, Repair & Overhaul Services (MRO) Services for Heat Transfer Components & OEM of Heat Transfer Solutions; MRO Services for Aviation Components; and Overhaul and Coating of Jet Engine Components. The OME of Heat Transfer Solutions & Aviation Accessories segment include the design, development and manufacture of broad range of heat transfer solutions, such as pre-coolers heat exchangers and oil/fuel hydraulic heat exchangers, used in mechanical and electronic systems on board commercial, military and business aircraft; environmental control and power electronics cooling systems installed on board aircraft in and ground applications; and a variety of other mechanical aircraft accessories and systems such as pumps, valves, and turbine power units. The MRO Services for Heat Transfer Components & OEM of Heat Transfer Solutions segment include the MRO of heat transfer components and to a lesser extent, the manufacturing of certain heat transfer solutions. The MRO Services for Aviation Components segment includes the MRO of APUs, landing gears and other aircraft components. The Overhaul and Coating of Jet Engine Components segment includes the overhaul and coating of jet engine components, including turbine vanes and blades, fan blades, variable inlet guide vanes and afterburner flaps. The company was founded in April 1985 and is headquartered in Netanya, Israel. |
|
| |
 |
| Market Cap | 481.06M | EPS (ttm) | 0.02 |
| P/E | 831.02 | EPS this Y | -66.67% |
| Forward P/E | 163.18 | EPS next Y | 175.00% |
| PEG | 55.40 | EPS past 5Y | -5.69% |
| P/S | 12.06 | EPS next 5Y | 15.00% |
| P/B | 1.03 | EPS Q/Q | -151.20% |
| Dividend | - | Sales Q/Q | -39.62% |
| Insider Own | 8.33% | Inst Own | 60.36% |
| Insider Trans | 0.00% | Inst Trans | -1.25% |
| Short Float | 0.85% | Earnings | May 07/b |
| Analyst Recom | - | Target Price | - |
| Avg Volume | 69.23K | 52W Range | 14.80 - 18.44 |
|
|
|
|
Tejon Ranch Co. engages in real estate development and agribusiness. It operates through the following segments: Real Estate-Commercial and Industrial, Real Estate-Resort and Residential, Mineral Resources, Farming, and Ranch Operations. The Real Estate-Commercial and Industrial segment's activities include: the entitling, planning, and permitting of land for development, the construction of infrastructure, the construction of pre-leased buildings, the construction of buildings to be leased or sold, and the sale of land to third parties for their own development. The Real Estate-Resort and Residential segment's operations include: land entitlement, land planning and pre-construction engineering, land stewardship and conservation activities. The Mineral Resources segment generates revenues from oil and gas royalty leases, and rock and aggregate mining leases. The Farming segment produces revenue from the sale of wine grapes, almonds, and pistachios. The Ranch Operations segment consist of game management revenue and ancillary land uses such as grazing leases and filming. The company was founded by Edward Fitzgerald Beale in 1843 and is headquartered in Lebec, CA. |
| Insider Trading |
Relationship |
Date |
Transaction |
Cost |
#Shares |
Value ($) |
#Shares Total |
SEC Form 4 |
| TOWERVIEW LLC | 10% Owner | Sep 27 '23 | Buy | 15.83 | 4,888 | 77,377 | 3,845,500 | Sep 27 04:28 PM | | TOWERVIEW LLC | 10% Owner | Sep 26 '23 | Buy | 15.86 | 7,785 | 123,470 | 3,840,612 | Sep 27 04:28 PM | | TOWERVIEW LLC | 10% Owner | May 25 '23 | Buy | 16.56 | 3,609 | 59,768 | 3,832,827 | May 25 04:17 PM |
|
|
|
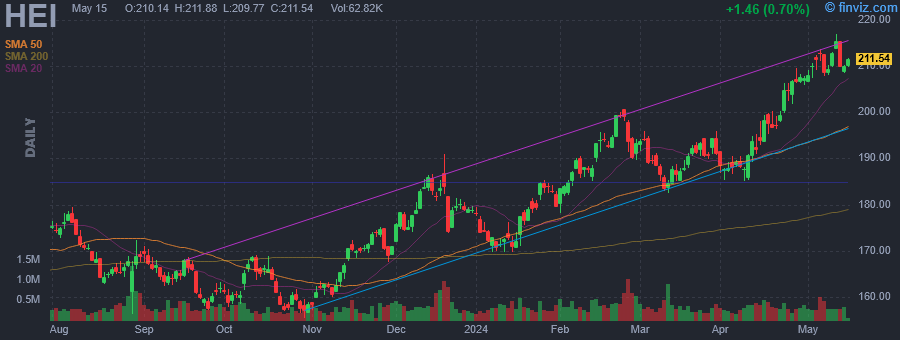 |
| Market Cap | 29.87B | EPS (ttm) | 3.05 |
| P/E | 70.68 | EPS this Y | 20.34% |
| Forward P/E | 51.12 | EPS next Y | 20.58% |
| PEG | 4.17 | EPS past 5Y | 8.91% |
| P/S | 9.21 | EPS next 5Y | 16.95% |
| P/B | 9.14 | EPS Q/Q | 22.14% |
| Dividend | 0.11% | Sales Q/Q | 44.36% |
| Insider Own | 69.51% | Inst Own | 27.95% |
| Insider Trans | -0.03% | Inst Trans | -0.00% |
| Short Float | 3.74% | Earnings | May 28/a |
| Analyst Recom | 1.89 | Target Price | 218.31 |
| Avg Volume | 364.55K | 52W Range | 153.63 - 217.22 |
|
|
|
|
HEICO Corp. engages in the manufacturing of electronic equipment for the aviation, defense, space, medical, telecommunications, and electronics industries. It operates through the Flight Support Group and Electronic Technologies Group segments. The Flight Support Group segment designs, manufactures, repairs, overhauls, and distributes jet engine and aircraft component replacement parts. The Electronic Technologies Group segment focuses on designing and manufacturing electronic, data and microwave, and electro-optical products, including infrared simulation and test equipment, laser rangefinder receivers, electrical power supplies, back-up power supplies, power conversion products, underwater locator beacons, emergency locator transmission beacons, flight deck annunciators, panels and indicators, electromagnetic and radio frequency interference shielding and filters, high power capacitor charging power supplies, amplifiers, traveling wave tube amplifiers, photo detectors, amplifier modules, microwave power modules, flash lamp drivers, laser diode drivers, arc lamp power supplies, custom power supply designs, cable assemblies, high voltage power supplies, high voltage interconnection devices and wire, high voltage energy generators, high frequency power delivery systems, and memory products. The company was founded in 1957 and is headquartered in Hollywood, FL. |
| Insider Trading |
Relationship |
Date |
Transaction |
Cost |
#Shares |
Value ($) |
#Shares Total |
SEC Form 4 |
| Schwitter Frank J | Director | Mar 28 '24 | Sale | 193.70 | 400 | 77,480 | 1,255 | Apr 01 04:11 PM | | SCHRIESHEIM ALAN | Director | Mar 22 '24 | Option Exercise | 0.57 | 35,000 | 19,996 | 181,966 | Mar 25 04:29 PM | | SCHRIESHEIM ALAN | Director | Mar 22 '24 | Sale | 192.18 | 26,000 | 4,996,784 | 155,862 | Mar 25 04:29 PM | | SCHRIESHEIM ALAN | Director | Jan 04 '24 | Option Exercise | 0.57 | 44,000 | 25,137 | 147,111 | Jan 05 06:47 PM | | Schwitter Frank J | Director | Jan 02 '24 | Sale | 178.06 | 550 | 97,930 | 1,655 | Jan 04 02:09 PM |
|
|
| |
 |
| Market Cap | 976.52M | EPS (ttm) | 8.82 |
| P/E | 3.15 | EPS this Y | 14.75% |
| Forward P/E | 3.26 | EPS next Y | -11.04% |
| PEG | 0.26 | EPS past 5Y | - |
| P/S | 1.40 | EPS next 5Y | 12.00% |
| P/B | 0.77 | EPS Q/Q | 26.74% |
| Dividend | 3.60% | Sales Q/Q | 12.73% |
| Insider Own | 7.45% | Inst Own | 48.99% |
| Insider Trans | 0.00% | Inst Trans | -10.95% |
| Short Float | 3.59% | Earnings | May 16/b |
| Analyst Recom | 1.50 | Target Price | 30.75 |
| Avg Volume | 792.95K | 52W Range | 16.80 - 27.74 |
|
|
|
|
Global Ship Lease, Inc. is a holding company, which owns and charters out containerships under long-term and fixed rate charters to container shipping companies. It also focuses on the operation and technical management of each vessel, such as crewing, provision of lubricating oils, maintaining the vessel, periodic dry docking, and performing work required by regulations. The company was founded on May 3, 2007 and is headquartered in London, the United Kingdom. |
|
|
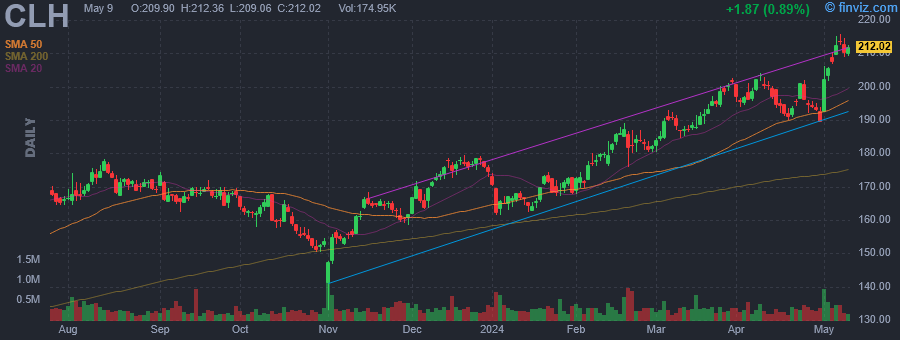 |
| Market Cap | 11.61B | EPS (ttm) | 6.91 |
| P/E | 31.17 | EPS this Y | 7.10% |
| Forward P/E | 24.45 | EPS next Y | 17.60% |
| PEG | 1.04 | EPS past 5Y | 42.93% |
| P/S | 2.12 | EPS next 5Y | 30.00% |
| P/B | 5.02 | EPS Q/Q | -3.21% |
| Dividend | - | Sales Q/Q | 5.30% |
| Insider Own | 5.95% | Inst Own | 90.49% |
| Insider Trans | -3.81% | Inst Trans | 0.84% |
| Short Float | 1.04% | Earnings | May 01/b |
| Analyst Recom | 1.42 | Target Price | 227.55 |
| Avg Volume | 297.79K | 52W Range | 132.92 - 216.73 |
|
|
|
|
Clean Harbors, Inc. engages in the provision of environmental, energy, and industrial services. It operates through the Environmental Services and the Safety-Kleen Sustainability Solutions segments. The Environmental Services segment consists of the technical services, industrial services, field services, and oil, gas, and lodging businesses. The Safety-Kleen Sustainability Solutions segment includes parts washer services, containerized waste services, vac services, used motor oil collection, and sale of base and blended oil products. The company was founded by Alan S. McKim in 1980 and is headquartered in Norwell, MA. |
| Insider Trading |
Relationship |
Date |
Transaction |
Cost |
#Shares |
Value ($) |
#Shares Total |
SEC Form 4 |
| Dugas Eric J. | EVP CHIEF FINANCIAL OFFICER | May 03 '24 | Sale | 208.74 | 6,200 | 1,294,188 | 21,482 | May 06 08:35 AM | | Weber Brian P | EVP (CHESI) | Mar 27 '24 | Sale | 199.07 | 7,996 | 1,591,764 | 62,803 | Mar 28 09:42 AM | | GERSTENBERG ERIC W | CO-CEO | Mar 15 '24 | Sale | 187.71 | 15,276 | 2,867,458 | 67,374 | Mar 18 09:13 AM | | PRESTON JOHN T | Director | Mar 14 '24 | Sale | 188.36 | 1,913 | 360,333 | 4,767 | Mar 15 12:14 PM | | MCKIM ALAN S | EXEC CHAIR, CTO. | Feb 27 '24 | Sale | 182.22 | 35,000 | 6,377,700 | 2,690,852 | Feb 28 04:01 PM |
|
|
|
 |
| Market Cap | 7.45B | EPS (ttm) | 6.22 |
| P/E | 23.45 | EPS this Y | 28.40% |
| Forward P/E | 17.42 | EPS next Y | 3.87% |
| PEG | 1.30 | EPS past 5Y | 41.99% |
| P/S | 1.74 | EPS next 5Y | 18.00% |
| P/B | 7.12 | EPS Q/Q | 296.47% |
| Dividend | - | Sales Q/Q | 21.09% |
| Insider Own | 1.96% | Inst Own | 101.41% |
| Insider Trans | -43.19% | Inst Trans | -5.38% |
| Short Float | 9.28% | Earnings | May 29/b |
| Analyst Recom | 2.50 | Target Price | 144.16 |
| Avg Volume | 1.58M | 52W Range | 22.65 - 146.93 |
|
|
|
|
Abercrombie & Fitch Co. engages in the retail of apparel, personal care products, and accessories. The firm operates through following geographical segments: Americas, EMEA and APAC. The Americas segment includes operations in North America and South America. The EMEA segment includes operations in Europe, the Middle East and Africa. The APAC segment includes operations in the Asia-Pacific region, including Asia and Oceania. The company was founded by David Abercrombie in 1892 and is headquartered in New Albany, OH. |
| Insider Trading |
Relationship |
Date |
Transaction |
Cost |
#Shares |
Value ($) |
#Shares Total |
SEC Form 4 |
| Horowitz Fran | Chief Executive Officer | Apr 18 '24 | Sale | 110.61 | 400,000 | 44,244,000 | 525,520 | Apr 22 06:26 PM | | Scott Kristin A. | President-Global Brands | Mar 25 '24 | Option Exercise | 0.00 | 15,734 | 0 | 62,540 | Mar 26 05:43 PM | | Rust Jay | EVP Human Resources | Mar 25 '24 | Option Exercise | 0.00 | 3,680 | 0 | 5,759 | Mar 26 05:43 PM | | Lipesky Scott D. | EVP, COO and CFO | Mar 25 '24 | Option Exercise | 0.00 | 7,867 | 0 | 101,513 | Mar 26 05:43 PM | | HENCHEL GREGORY J | SVP, Gen Cnsl & Secy | Mar 25 '24 | Option Exercise | 0.00 | 3,147 | 0 | 31,347 | Mar 26 05:43 PM |
|
|
|
