 |
| Market Cap | 3.35B | EPS (ttm) | -2.72 |
| P/E | - | EPS this Y | 7.17% |
| Forward P/E | - | EPS next Y | 3.69% |
| PEG | - | EPS past 5Y | -18.50% |
| P/S | 87.39 | EPS next 5Y | - |
| P/B | 9.59 | EPS Q/Q | 30.85% |
| Dividend | - | Sales Q/Q | -41.56% |
| Insider Own | 23.57% | Inst Own | 74.22% |
| Insider Trans | -0.17% | Inst Trans | -1.84% |
| Short Float | 7.54% | Earnings | May 08/a |
| Analyst Recom | 1.00 | Target Price | 60.85 |
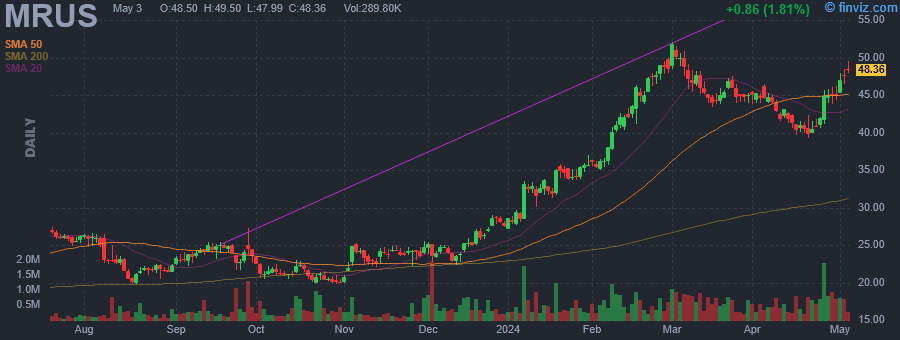
| Avg Volume | 663.05K | 52W Range | 19.81 - 52.03 |
|
|
|
|
Merus NV is a clinical-stage immuno-oncology company, which engages in the discovery and development of bispecific antibody therapeutics. Its pipeline includes Biclonics for solid and hematological tumors. The company was founded by Ton Logtenberg and Hennie Hoogenboom on June 16, 2003 and is headquartered in Utrecht, the Netherlands. |
| Insider Trading |
Relationship |
Date |
Transaction |
Cost |
#Shares |
Value ($) |
#Shares Total |
SEC Form 4 |
| Shuman Harry | VP Controller, PAO | Dec 19 '23 | Sale | 26.68 | 115 | 3,068 | 7,002 | Dec 20 04:05 PM | | Silverman Peter B. | COO & GC | Dec 15 '23 | Sale | 25.00 | 22,386 | 559,650 | 0 | Dec 18 05:15 PM | | Shuman Harry | VP Controller, PAO | Dec 08 '23 | Sale | 24.44 | 250 | 6,110 | 7,117 | Dec 12 04:04 PM | | Shuman Harry | VP Controller, PAO | Dec 01 '23 | Option Exercise | 0.00 | 2,500 | 0 | 7,942 | Dec 04 04:05 PM | | Shuman Harry | VP Controller, PAO | Dec 01 '23 | Sale | 24.58 | 575 | 14,133 | 7,367 | Dec 04 04:05 PM |
|
|
 |
 |
| Market Cap | 26.02B | EPS (ttm) | 29.29 |
| P/E | 34.61 | EPS this Y | 6.27% |
| Forward P/E | 28.46 | EPS next Y | 14.94% |
| PEG | 1.57 | EPS past 5Y | 26.96% |
| P/S | 6.06 | EPS next 5Y | 22.00% |
| P/B | 12.36 | EPS Q/Q | 42.87% |
| Dividend | - | Sales Q/Q | 21.30% |
| Insider Own | 0.97% | Inst Own | 99.47% |
| Insider Trans | -20.76% | Inst Trans | -0.11% |
| Short Float | 3.51% | Earnings | May 23/a |
| Analyst Recom | 1.75 | Target Price | 1034.56 |
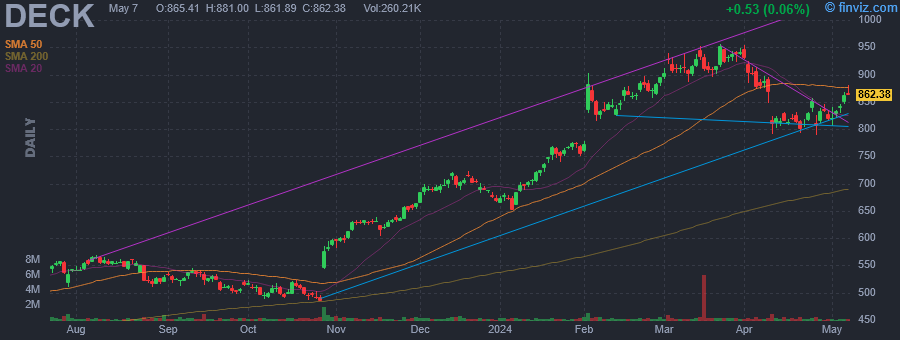
| Avg Volume | 447.67K | 52W Range | 424.36 - 956.17 |
|
|
| Today | Reiterated |
Telsey Advisory Group |
Outperform |
$985 → $1100 |
|
|
Today 09:43AM
|
Maker Of Hoka Shoes Breaks Out To New Record High After Massive Earnings Beat
(Investor's Business Daily) +12.07% |
|
08:17AM
|
Hoka Sales Soar, Boosting Deckers Stock. It Wraps Up An Exceptional Year, Analyst Says.
(Barrons.com) |
|
08:04AM
|
Deckers Outdoor Corporation (NYSE:DECK) Q4 2024 Earnings Call Transcript
(Insider Monkey) |
|
07:22AM
|
These Stocks Are Moving the Most Today: Nvidia, Workday, Intuit, Deckers Outdoor, Lucid, Boeing, and More
(Barrons.com) |
|
12:48AM
|
Deckers stock pops 8% after crushing analyst estimates
(Investing.com) |
|
May-23-24 08:53PM
|
DECK Stock Earnings: Deckers Outdoor Beats EPS, Beats Revenue for Q4 2024
(InvestorPlace) |
|
05:15PM
|
Deckers (DECK) Beats Q4 Earnings and Revenue Estimates
(Zacks) |
|
04:58PM
|
Deckers Wraps Up Fiscal 2024 With Record $4.2B in Sales as Hoka and Ugg Continue to Lead the Way
(Footwear News) |
|
04:54PM
|
Deckers stock moves on 2025 sales forecast, jump in Ugg sales
(Yahoo Finance Video) |
|
04:36PM
|
Maker Of Hoka Shoes Set For Breakout, New Record High After Massive Earnings Beat
(Investor's Business Daily) |
|
Deckers Outdoor Corp. engages in the business of designing, marketing, and distributing footwear, apparel, and accessories developed for both everyday casual lifestyle use and high performance activities. It operates through the following segments: UGG Brand, HOKA Brand, Teva Brand, Sanuk Brand, Other Brands, and Direct-to-Consumer. The UGG Brand segment offers a line of premium footwear, apparel, and accessories. The HOKA Brand segment sells footwear and apparel that offers enhanced cushioning and inherent stability with minimal weight, originally designed for ultra-runners. The Teva Brand segment focuses on the sport sandal and modern outdoor lifestyle category, such as sandals, shoes, and boots. The Sanuk Brand segment originated in Southern California surf culture and has emerged into a lifestyle brand with a presence in the relaxed casual shoe and sandal categories. The Other Brands segment includes the Koolaburra by UGG brand. The Direct-to-Consumer segment consists of retail stores and e-commerce websites. The company was founded by Douglas B. Otto in 1973 and is headquartered in Goleta, CA. |
| Insider Trading |
Relationship |
Date |
Transaction |
Cost |
#Shares |
Value ($) |
#Shares Total |
SEC Form 4 |
| Powers David | President & CEO | Apr 15 '24 | Option Exercise | 69.29 | 5,993 | 415,255 | 104,211 | Apr 16 08:04 PM | | Powers David | President & CEO | Apr 15 '24 | Sale | 824.11 | 5,993 | 4,938,909 | 98,218 | Apr 16 08:04 PM | | Powers David | President & CEO | Mar 15 '24 | Option Exercise | 69.29 | 5,993 | 415,255 | 104,211 | Mar 18 05:17 PM | | Powers David | President & CEO | Mar 15 '24 | Sale | 922.85 | 5,993 | 5,530,618 | 98,218 | Mar 18 05:17 PM | | Stewart Bonita C. | Director | Feb 22 '24 | Sale | 871.11 | 3,500 | 3,048,885 | 8,863 | Feb 23 05:37 PM |
|
|
|
 |
| Market Cap | 14.98M | EPS (ttm) | 0.24 |
| P/E | 8.19 | EPS this Y | - |
| Forward P/E | - | EPS next Y | - |
| PEG | - | EPS past 5Y | 83.41% |
| P/S | 0.83 | EPS next 5Y | - |
| P/B | 0.96 | EPS Q/Q | 277.34% |
| Dividend | - | Sales Q/Q | 21.46% |
| Insider Own | 54.83% | Inst Own | 2.76% |
| Insider Trans | 0.00% | Inst Trans | 1.17% |
| Short Float | 0.19% | Earnings | Dec 22/b |
| Analyst Recom | - | Target Price | - |
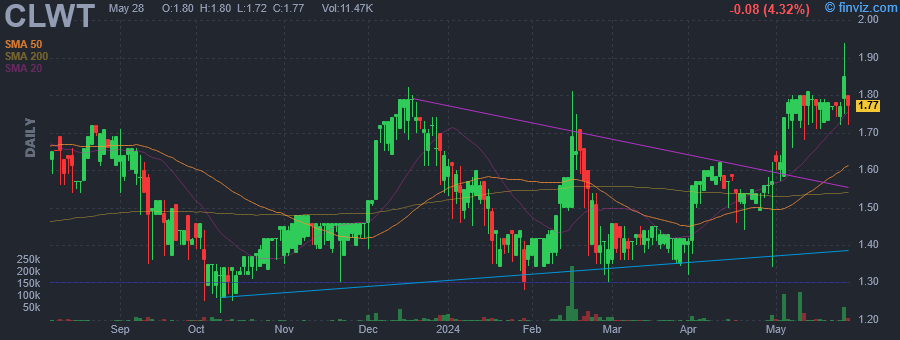
| Avg Volume | 9.39K | 52W Range | 1.22 - 1.82 |
|
|
|
|
Euro Tech Holdings Co. Ltd. is engaged in the manufacture and distribution of water treatment equipment. It operates through the Trading and Manufacturing, and Engineering segments. The Trading and Manufacturing segment offers laboratory instruments, analyzers, test kits, and power generation equipment. The Engineering segment involves water and waste-water treatment engineering and air pollution control business through Pact-Yixing, the firm's wholly owned subsidiary. The company was founded on September 30, 1996 and is headquartered in Hong Kong. |
|
| |
 |
| Market Cap | 187.47M | EPS (ttm) | -0.50 |
| P/E | - | EPS this Y | 65.01% |
| Forward P/E | - | EPS next Y | 50.35% |
| PEG | - | EPS past 5Y | - |
| P/S | 29.02 | EPS next 5Y | - |
| P/B | - | EPS Q/Q | -314.61% |
| Dividend | - | Sales Q/Q | -33.35% |
| Insider Own | 59.60% | Inst Own | 0.25% |
| Insider Trans | 0.00% | Inst Trans | - |
| Short Float | 2.94% | Earnings | - |
| Analyst Recom | 1.00 | Target Price | 8.95 |
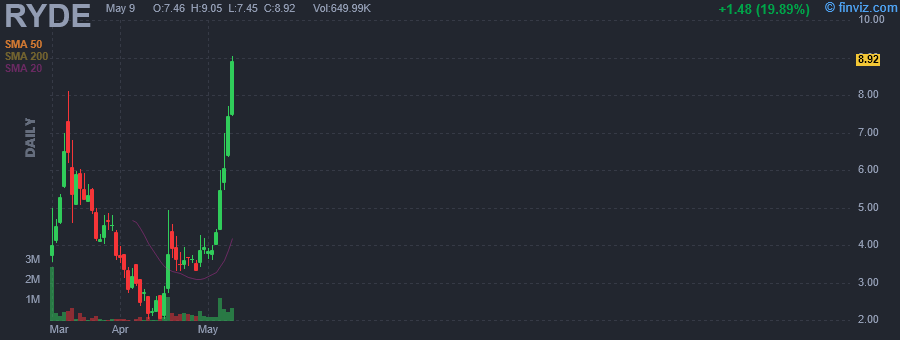
| Avg Volume | 394.13K | 52W Range | 2.02 - 9.27 |
|
|
|
|
Ryde Group Ltd. is an emerging growth company. It operates under the Mobility and Quick Commerce segments. The Mobility segment includes providing on-demand and scheduled carpooling and ride-hailing services, matching riders to driver partners. The Quick Commerce segment focuses on on-demand, scheduled, and multi-stop parcel delivery services. The company was founded on February 21, 2023 and is headquartered in Singapore. |
|
|
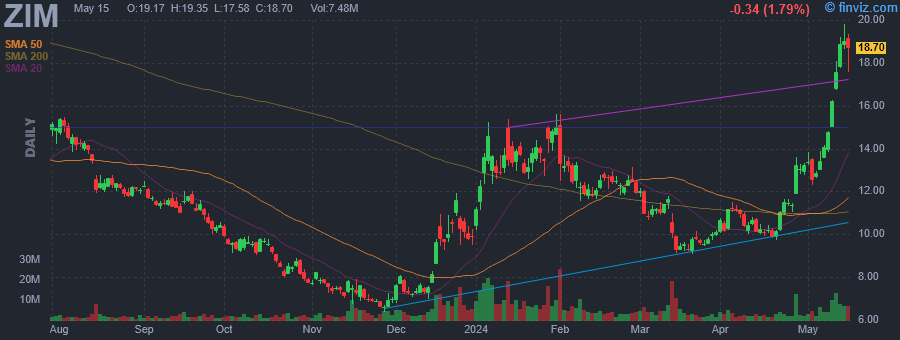 |
| Market Cap | 2.50B | EPS (ttm) | -21.18 |
| P/E | - | EPS this Y | 96.01% |
| Forward P/E | - | EPS next Y | -242.75% |
| PEG | - | EPS past 5Y | - |
| P/S | 0.47 | EPS next 5Y | - |
| P/B | 0.98 | EPS Q/Q | 251.42% |
| Dividend | 1.09% | Sales Q/Q | 13.66% |
| Insider Own | 21.72% | Inst Own | 30.26% |
| Insider Trans | 0.00% | Inst Trans | -12.67% |
| Short Float | 22.55% | Earnings | May 21/b |
| Analyst Recom | 3.43 | Target Price | 10.27 |
| Avg Volume | 4.93M | 52W Range | 6.39 - 19.80 |
|
|
|
|
ZIM Integrated Shipping Services Ltd. engages in the provision of shipping and logistics services. It offers shipping solutions, including the transportation of out-of-gauge cargo, refrigerated cargo, and dangerous and hazardous cargo. The company was founded on June 7, 1945 and is headquartered in Haifa, Israel. |
|
| |
 |
| Market Cap | 28.29B | EPS (ttm) | 9.54 |
| P/E | 27.71 | EPS this Y | 75.23% |
| Forward P/E | 12.75 | EPS next Y | 52.79% |
| PEG | 0.48 | EPS past 5Y | 41.58% |
| P/S | 7.94 | EPS next 5Y | 58.00% |
| P/B | 4.10 | EPS Q/Q | 454.63% |
| Dividend | - | Sales Q/Q | 44.83% |
| Insider Own | 5.68% | Inst Own | 90.24% |
| Insider Trans | -1.53% | Inst Trans | 2.01% |
| Short Float | 4.57% | Earnings | May 01/a |
| Analyst Recom | 1.47 | Target Price | 235.98 |
| Avg Volume | 2.41M | 52W Range | 129.21 - 253.99 |
|
|
|
|
First Solar, Inc. is a solar technology company, which engages in the provision of solar modules. It is involved in the design, manufacture, and sale of cadmium tellurid (CdTe) solar modules, which convert sunlight into electricity. The company was founded by Michael J. Ahearn in 1999 and is headquartered in Tempe, AZ. |
| Insider Trading |
Relationship |
Date |
Transaction |
Cost |
#Shares |
Value ($) |
#Shares Total |
SEC Form 4 |
| STEBBINS PAUL H | Director | May 23 '24 | Sale | 250.35 | 4,000 | 1,001,400 | 20,817 | May 23 06:30 PM | | Chapman Richard D | Director | May 22 '24 | Sale | 248.95 | 7,264 | 1,808,373 | 10,440 | May 23 04:59 PM | | Stockdale Caroline | Chief People and Comm. Officer | May 21 '24 | Sale | 205.00 | 12,406 | 2,543,230 | 22,025 | May 22 07:07 PM | | Chapman Richard D | Director | May 09 '24 | Sale | 190.90 | 3,985 | 760,736 | 17,704 | May 13 08:57 PM | | Chapman Richard D | Director | May 09 '24 | Sale | 190.48 | 3,165 | 602,877 | 1,045 | May 13 08:57 PM |
|
|
|
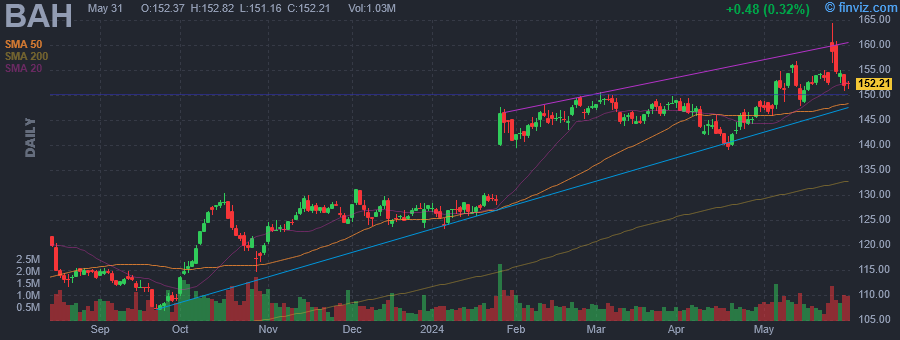 |
| Market Cap | 20.94B | EPS (ttm) | 3.10 |
| P/E | 52.08 | EPS this Y | 18.41% |
| Forward P/E | 27.28 | EPS next Y | 9.57% |
| PEG | 4.13 | EPS past 5Y | 0.02% |
| P/S | 2.03 | EPS next 5Y | 12.60% |
| P/B | 19.31 | EPS Q/Q | 381.47% |
| Dividend | 1.19% | Sales Q/Q | 12.86% |
| Insider Own | 1.67% | Inst Own | 90.65% |
| Insider Trans | -4.85% | Inst Trans | 0.61% |
| Short Float | 0.95% | Earnings | May 24/b |
| Analyst Recom | 2.17 | Target Price | 156.10 |
| Avg Volume | 595.34K | 52W Range | 89.80 - 156.83 |
|
|
|
|
Booz Allen Hamilton Holding Corp. engages in the provision of management and technology consulting services. It offers analytics, digital solutions, engineering, and cyber expertise. The company was founded by Edwin Booz in 1914 and is headquartered in McLean, VA. |
| Insider Trading |
Relationship |
Date |
Transaction |
Cost |
#Shares |
Value ($) |
#Shares Total |
SEC Form 4 |
| ROZANSKI HORACIO | President and CEO | May 21 '24 | Sale | 154.15 | 34,571 | 5,329,120 | 579,025 | May 23 04:40 PM | | Laben Nancy | EVP & Chief Legal Officer | May 21 '24 | Sale | 154.15 | 3,908 | 602,418 | 26,024 | May 23 04:39 PM | | ANDERSON KRISTINE | EVP & Chief Operating Officer | May 21 '24 | Sale | 154.15 | 3,644 | 561,723 | 72,761 | May 23 04:39 PM | | Penfield Susan L | EVP & Chief Technology Officer | May 21 '24 | Sale | 154.15 | 3,211 | 494,976 | 22,149 | May 23 04:40 PM | | Dotson Judith | Executive Vice President | May 21 '24 | Sale | 154.15 | 2,142 | 330,189 | 71,148 | May 23 04:39 PM |
|
|
| |
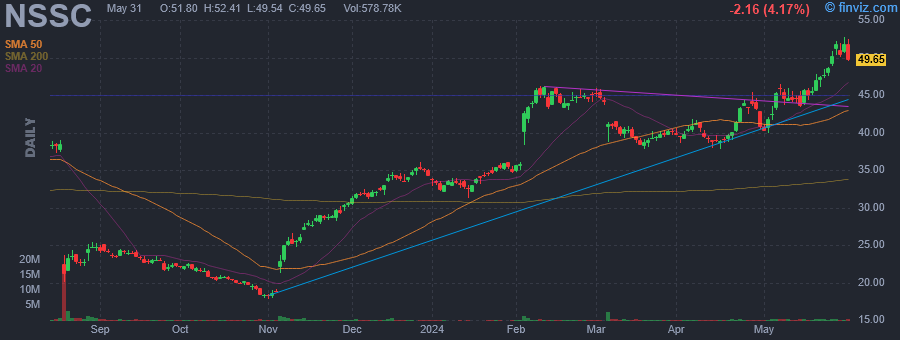 |
| Market Cap | 1.85B | EPS (ttm) | 1.26 |
| P/E | 39.63 | EPS this Y | 82.66% |
| Forward P/E | 32.12 | EPS next Y | 16.89% |
| PEG | 26.42 | EPS past 5Y | 29.03% |
| P/S | 10.08 | EPS next 5Y | 1.50% |
| P/B | 10.97 | EPS Q/Q | 38.06% |
| Dividend | 0.52% | Sales Q/Q | 13.17% |
| Insider Own | 4.34% | Inst Own | 90.38% |
| Insider Trans | -60.01% | Inst Trans | 0.45% |
| Short Float | 10.15% | Earnings | May 06/b |
| Analyst Recom | 1.67 | Target Price | 51.00 |
| Avg Volume | 418.61K | 52W Range | 17.76 - 48.69 |
|
|
| Today | Resumed |
Craig Hallum |
Buy |
$50 → $65 |
|
|
|
Napco Security Technologies, Inc. engages in the development, manufacture, and distribution of security products. Its divisions include NAPCO Security Systems, Alarm Lock, Marks USA Custom Locking, and Napco Access Pro. The company was founded in 1969 and is headquartered in Amityville, NY. |
| Insider Trading |
Relationship |
Date |
Transaction |
Cost |
#Shares |
Value ($) |
#Shares Total |
SEC Form 4 |
| BEEBER PAUL STEPHEN | Director | May 08 '24 | Option Exercise | 17.30 | 3,000 | 51,907 | 4,174 | May 16 01:57 PM | | SOLOWAY RICHARD | CEO, Chairman, Secy | May 08 '24 | Sale | 44.20 | 250,000 | 11,050,450 | 1,406,010 | May 08 04:15 PM | | SOLOWAY RICHARD | Pres, CEO, Chairman, Secy | Apr 08 '24 | Sale | 40.75 | 50,000 | 2,037,500 | 1,656,010 | Apr 10 05:15 PM | | BUCHEL KEVIN S | Executive Vice President | Mar 12 '24 | Sale | 40.36 | 50,000 | 2,018,050 | 62,739 | Mar 14 04:23 PM | | SOLOWAY RICHARD | Pres, CEO, Chairman, Secy | Mar 08 '24 | Sale | 40.75 | 2,000,000 | 81,500,000 | 1,706,010 | Mar 12 04:36 PM |
|
|
|
 |
| Market Cap | 147.40M | EPS (ttm) | 0.64 |
| P/E | 22.19 | EPS this Y | - |
| Forward P/E | - | EPS next Y | - |
| PEG | - | EPS past 5Y | - |
| P/S | 1.20 | EPS next 5Y | - |
| P/B | 1.55 | EPS Q/Q | 170.87% |
| Dividend | - | Sales Q/Q | 35.18% |
| Insider Own | 50.64% | Inst Own | 15.31% |
| Insider Trans | 0.00% | Inst Trans | -0.20% |
| Short Float | 0.10% | Earnings | - |
| Analyst Recom | - | Target Price | - |
| Avg Volume | 9.22K | 52W Range | 5.46 - 13.89 |
|
|
|
|
TAT Technologies Ltd. provides a variety of services and products to the commercial and military aerospace and ground defense industries. It operates through the following business segments: Original Equipment Manufacturing (OEM) of Heat Transfer Solutions & Aviation Accessories; Maintenance, Repair & Overhaul Services (MRO) Services for Heat Transfer Components & OEM of Heat Transfer Solutions; MRO Services for Aviation Components; and Overhaul and Coating of Jet Engine Components. The OME of Heat Transfer Solutions & Aviation Accessories segment include the design, development and manufacture of broad range of heat transfer solutions, such as pre-coolers heat exchangers and oil/fuel hydraulic heat exchangers, used in mechanical and electronic systems on board commercial, military and business aircraft; environmental control and power electronics cooling systems installed on board aircraft in and ground applications; and a variety of other mechanical aircraft accessories and systems such as pumps, valves, and turbine power units. The MRO Services for Heat Transfer Components & OEM of Heat Transfer Solutions segment include the MRO of heat transfer components and to a lesser extent, the manufacturing of certain heat transfer solutions. The MRO Services for Aviation Components segment includes the MRO of APUs, landing gears and other aircraft components. The Overhaul and Coating of Jet Engine Components segment includes the overhaul and coating of jet engine components, including turbine vanes and blades, fan blades, variable inlet guide vanes and afterburner flaps. The company was founded in April 1985 and is headquartered in Netanya, Israel. |
|
|
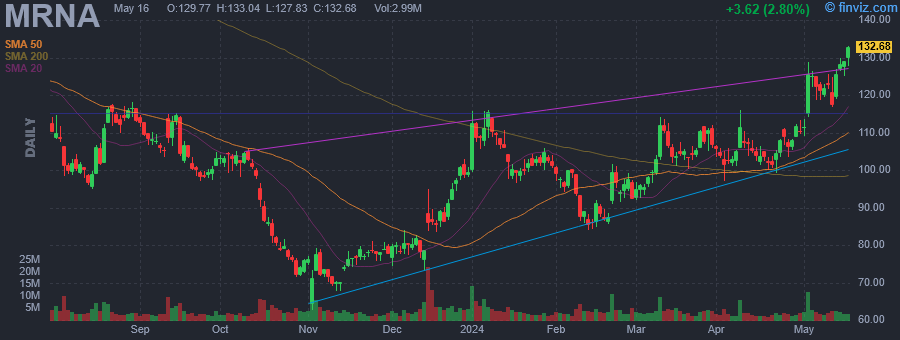 |
| Market Cap | 63.78B | EPS (ttm) | -15.68 |
| P/E | - | EPS this Y | 42.93% |
| Forward P/E | - | EPS next Y | 25.87% |
| PEG | - | EPS past 5Y | -20.02% |
| P/S | 12.40 | EPS next 5Y | - |
| P/B | 4.97 | EPS Q/Q | -1676.58% |
| Dividend | - | Sales Q/Q | -91.07% |
| Insider Own | 12.12% | Inst Own | 67.34% |
| Insider Trans | -0.68% | Inst Trans | 0.89% |
| Short Float | 6.26% | Earnings | May 02/b |
| Analyst Recom | 2.38 | Target Price | 136.25 |
| Avg Volume | 3.92M | 52W Range | 62.55 - 165.14 |
|
|
|
|
Moderna, Inc. engages in the development of transformative medicines based on messenger ribonucleic acid (mRNA). Its product pipeline includes the following modalities: prophylactic vaccines, cancer vaccines, intratumoral immuno-oncology, localized regenerative therapeutics, systemic secreted therapeutics, and systemic intracellular therapeutics. The company was founded by Noubar B. Afeyan, Robert S. Langer, Jr., Derrick J. Rose and Kenneth R. Chien in 2010 and is headquartered in Cambridge, MA. |
| Insider Trading |
Relationship |
Date |
Transaction |
Cost |
#Shares |
Value ($) |
#Shares Total |
SEC Form 4 |
| Hoge Stephen | President | May 15 '24 | Sale | 127.49 | 15,000 | 1,912,350 | 1,471,508 | May 17 04:04 PM | | AFEYAN NOUBAR | Director | May 15 '24 | Sale | 127.32 | 15,000 | 1,909,863 | 1,996,931 | May 17 07:00 PM | | Hoge Stephen | President | May 10 '24 | Sale | 120.96 | 255 | 30,844 | 1,486,508 | May 13 04:03 PM | | AFEYAN NOUBAR | Director | May 08 '24 | Sale | 121.68 | 15,000 | 1,825,220 | 2,011,931 | May 10 07:00 PM | | AFEYAN NOUBAR | Director | May 01 '24 | Sale | 110.92 | 15,000 | 1,663,855 | 2,026,931 | May 03 07:00 PM |
|
|
|
