 |
| Market Cap | 137.98M | EPS (ttm) | 0.74 |
| P/E | 6.59 | EPS this Y | -22.24% |
| Forward P/E | 3.27 | EPS next Y | 176.78% |
| PEG | - | EPS past 5Y | - |
| P/S | 0.50 | EPS next 5Y | - |
| P/B | - | EPS Q/Q | 79.90% |
| Dividend | - | Sales Q/Q | 55.70% |
| Insider Own | 38.43% | Inst Own | 51.56% |
| Insider Trans | 0.46% | Inst Trans | -11.00% |
| Short Float | 3.33% | Earnings | May 09/a |
| Analyst Recom | 1.40 | Target Price | 8.60 |
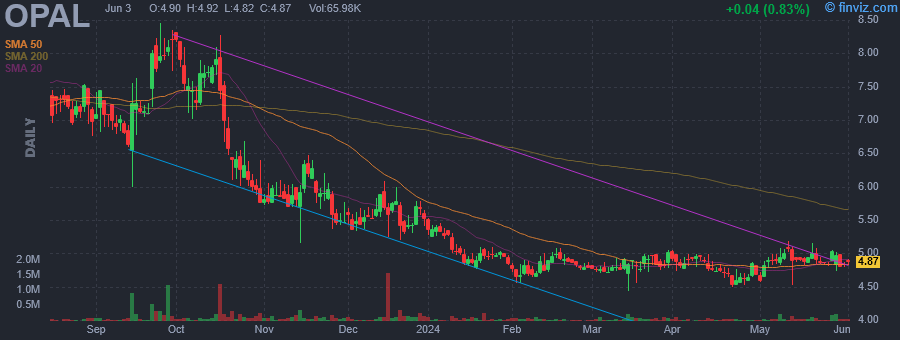
| Avg Volume | 66.77K | 52W Range | 4.43 - 8.46 |
|
|
|
|
OPAL Fuels, Inc. engages in the production and distribution of low-carbon intensity renewable natural gas. It operates as a vertical waste-to-energy model that combines the upstream production and downstream marketing and distribution of RNG. The company operates under the following segments: RNG Fuel, Fuel Station Services, Renewable Power Portfolio, and Corporate. The RNG Fuel segment relates to all RNG supply and dispensing activities directly related to the generation and sale of brown gas. The Fuel Station Services provides construction and maintenance services to third-party owners of vehicle fueling stations. The Renewable Power Portfolio segment generates renewable power which is then sold to public utilities. The Corporate segment consists of activities managed and maintained at the company corporate level. The company is Founded in 1998 and is headquartered in White Plains, NY. |
| Insider Trading |
Relationship |
Date |
Transaction |
Cost |
#Shares |
Value ($) |
#Shares Total |
SEC Form 4 |
| Falbo Anthony | Chief Operating Officer | May 21 '24 | Sale | 4.89 | 9,621 | 47,047 | 0 | May 22 04:46 PM | | Dols Scott V. | Director | May 20 '24 | Buy | 5.06 | 11,192 | 56,596 | 34,823 | May 22 04:48 PM | | Dols Scott V. | Director | May 17 '24 | Buy | 4.93 | 6,000 | 29,580 | 7,601 | May 20 04:09 PM | | Dols Scott V. | Director | May 16 '24 | Buy | 4.88 | 2,808 | 13,703 | 23,631 | May 20 04:09 PM | | Nisar Nadeem | Director | Dec 13 '23 | Buy | 5.63 | 5,000 | 28,175 | 40,125 | Dec 14 04:06 PM |
|
|
 |
 |
| Market Cap | 2.74B | EPS (ttm) | 3.30 |
| P/E | 17.80 | EPS this Y | -1.16% |
| Forward P/E | 13.74 | EPS next Y | 22.10% |
| PEG | 2.23 | EPS past 5Y | -9.39% |
| P/S | 1.50 | EPS next 5Y | 8.00% |
| P/B | 0.96 | EPS Q/Q | -34.89% |
| Dividend | - | Sales Q/Q | 8.14% |
| Insider Own | 2.42% | Inst Own | 101.16% |
| Insider Trans | 9.19% | Inst Trans | -3.90% |
| Short Float | 4.50% | Earnings | Apr 18/b |
| Analyst Recom | 2.93 | Target Price | 63.04 |
| Avg Volume | 397.82K | 52W Range | 46.54 - 66.18 |
|
|
|
|
Texas Capital Bancshares, Inc. is a holding company, which engages in the provision of financial services and customized solutions to businesses, entrepreneurs, and individual customers. The company was founded by George F. Jones, Jr. and Joseph M. Grant in November 1996 and is headquartered in Dallas, TX. |
| Insider Trading |
Relationship |
Date |
Transaction |
Cost |
#Shares |
Value ($) |
#Shares Total |
SEC Form 4 |
| STALLINGS ROBERT W | Director | May 21 '24 | Buy | 19.48 | 3,000 | 58,440 | 166,706 | May 22 04:34 PM | | STALLINGS ROBERT W | Director | May 20 '24 | Buy | 19.52 | 6,000 | 117,120 | 163,706 | May 22 04:34 PM | | STALLINGS ROBERT W | Director | May 17 '24 | Buy | 19.53 | 996 | 19,452 | 157,706 | May 20 04:21 PM | | STALLINGS ROBERT W | Director | May 16 '24 | Buy | 19.40 | 4 | 78 | 156,710 | May 20 04:21 PM | | STALLINGS ROBERT W | Director | May 10 '24 | Buy | 19.50 | 3,000 | 58,500 | 156,706 | May 14 05:05 PM |
|
|
|
 |
| Market Cap | 306.15M | EPS (ttm) | -0.21 |
| P/E | - | EPS this Y | 89.86% |
| Forward P/E | 45.43 | EPS next Y | 300.00% |
| PEG | - | EPS past 5Y | - |
| P/S | 2.09 | EPS next 5Y | - |
| P/B | 1.53 | EPS Q/Q | 30.48% |
| Dividend | - | Sales Q/Q | 20.51% |
| Insider Own | 21.25% | Inst Own | 26.83% |
| Insider Trans | 0.08% | Inst Trans | 6.91% |
| Short Float | 0.36% | Earnings | May 07/b |
| Analyst Recom | 1.67 | Target Price | 2.73 |
| Avg Volume | 305.15K | 52W Range | 0.89 - 2.58 |
|
|
|
|
Innovid Corp. engages in the operation of a software platform of technology infrastructure for the creation, delivery, and measurement of TV/video ads across CTV, linear TV, and mobile and desktop TV environments. The company was founded by Zvika Netter and Tal Chalozin in 2007 and is headquartered in New York, NY. |
| Insider Trading |
Relationship |
Date |
Transaction |
Cost |
#Shares |
Value ($) |
#Shares Total |
SEC Form 4 |
| Helmreich David | Chief Commercial Officer | May 22 '24 | Sale | 2.09 | 50,000 | 104,720 | 1,045,380 | May 23 04:17 PM | | Netter Zvika | Chief Executive Officer | May 21 '24 | Buy | 2.07 | 20,000 | 41,490 | 4,960,733 | May 22 04:34 PM | | Callini Anthony | Chief Financial Officer | Feb 29 '24 | Buy | 1.82 | 11,000 | 20,061 | 499,000 | Mar 01 05:21 PM | | Netter Zvika | Chief Executive Officer | Feb 28 '24 | Buy | 1.84 | 25,000 | 45,970 | 4,085,733 | Feb 29 04:36 PM | | Callini Anthony | Chief Financial Officer | Nov 22 '23 | Buy | 1.34 | 18,000 | 24,077 | 488,000 | Nov 24 01:18 PM |
|
|
| |
 |
| Market Cap | 72.48M | EPS (ttm) | -18.34 |
| P/E | - | EPS this Y | - |
| Forward P/E | - | EPS next Y | - |
| PEG | - | EPS past 5Y | 10.66% |
| P/S | 233.81 | EPS next 5Y | - |
| P/B | 6.67 | EPS Q/Q | 80.39% |
| Dividend | - | Sales Q/Q | 315.73% |
| Insider Own | 18.32% | Inst Own | 14.08% |
| Insider Trans | 3.68% | Inst Trans | -41.48% |
| Short Float | 4.87% | Earnings | May 15/a |
| Analyst Recom | - | Target Price | - |
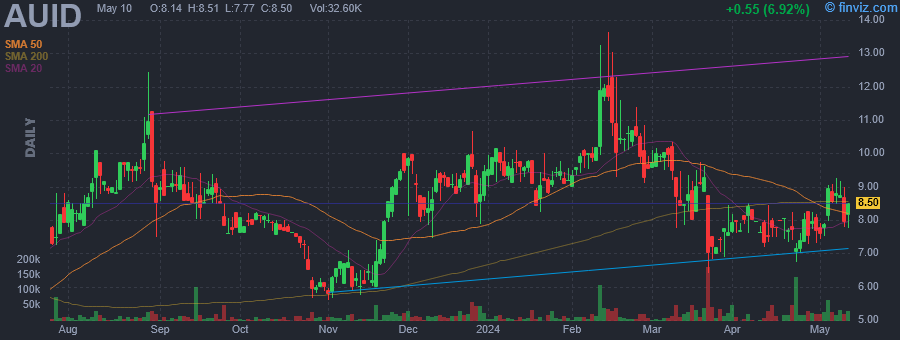
| Avg Volume | 26.29K | 52W Range | 3.53 - 13.63 |
|
|
|
|
authID, Inc. engages in the delivery of secure, mobile, and biometric identity solutions. It operates through the Verified Authentication Business segment. The company was founded by Thomas R Snoke on September 21, 2011 and is headquartered in Denver, CO. |
| Insider Trading |
Relationship |
Date |
Transaction |
Cost |
#Shares |
Value ($) |
#Shares Total |
SEC Form 4 |
| Jisser Ken | Director | May 20 '24 | Buy | 7.64 | 5,500 | 42,020 | 43,475 | May 22 04:30 PM | | Garchik Stephen Jeffrey | 10% Owner | Apr 23 '24 | Buy | 6.85 | 12,000 | 82,200 | 1,163,096 | Apr 25 08:00 AM | | Garchik Stephen Jeffrey | 10% Owner | Apr 12 '24 | Buy | 7.69 | 10,500 | 80,745 | 1,151,096 | Apr 15 05:15 PM | | Garchik Stephen Jeffrey | 10% Owner | Jan 31 '24 | Buy | 9.40 | 5,700 | 53,580 | 1,140,596 | Feb 01 07:00 PM | | Garchik Stephen Jeffrey | 10% Owner | Jan 30 '24 | Buy | 9.10 | 2,500 | 22,750 | 1,134,896 | Jan 30 08:25 PM |
|
|
|
 |
| Market Cap | 1.98B | EPS (ttm) | 2.61 |
| P/E | 8.18 | EPS this Y | -2.10% |
| Forward P/E | 9.57 | EPS next Y | -3.50% |
| PEG | 4.09 | EPS past 5Y | 3.77% |
| P/S | 4.52 | EPS next 5Y | 2.00% |
| P/B | 1.25 | EPS Q/Q | 10.60% |
| Dividend | 8.58% | Sales Q/Q | 19.40% |
| Insider Own | 0.41% | Inst Own | 46.76% |
| Insider Trans | 2.02% | Inst Trans | - |
| Short Float | 1.36% | Earnings | May 01/a |
| Analyst Recom | 2.10 | Target Price | 22.65 |
| Avg Volume | 439.66K | 52W Range | 17.54 - 22.27 |
|
|
|
|
Sixth Street Specialty Lending, Inc. (NYSE: TSLX) is a business development company. The fund provides senior secured loans (first-lien, second-lien, and unitranche), unsecured loans, mezzanine debt, and investments in corporate bonds and equity securities and structured products, non-control structured equity, and common equity with a focus on co-investments for organic growth, acquisitions, market or product expansion, restructuring initiatives, recapitalizations, and refinancing. The fund invests in business services, software & technology, healthcare, energy, consumer & retail, manufacturing, industrials, royalty related businesses, education, and specialty finance. It seeks to finance and lending to middle market companies principally located in the United States. The fund invests in companies with enterprise value between $50 million and $1 billion or more and EBITDA between $10 million and $250 million. The transaction size is between $15 million and $350 million. The fund invests across the spectrum of the capital structure and can arrange syndicated transactions of up to $500 million and hold sizeable positions within its credits. |
| Insider Trading |
Relationship |
Date |
Transaction |
Cost |
#Shares |
Value ($) |
#Shares Total |
SEC Form 4 |
| Covington P Emery | Director | May 21 '24 | Buy | 21.50 | 7,500 | 161,280 | 7,500 | May 22 04:30 PM |
|
|
| |
 |
| Market Cap | 171.51B | EPS (ttm) | 22.15 |
| P/E | 15.83 | EPS this Y | 2.43% |
| Forward P/E | 15.37 | EPS next Y | 5.04% |
| PEG | 2.29 | EPS past 5Y | 14.42% |
| P/S | 2.56 | EPS next 5Y | 6.92% |
| P/B | 9.73 | EPS Q/Q | 53.65% |
| Dividend | 1.54% | Sales Q/Q | -0.40% |
| Insider Own | 0.19% | Inst Own | 72.69% |
| Insider Trans | -8.71% | Inst Trans | -1.95% |
| Short Float | 2.22% | Earnings | Apr 25/b |
| Analyst Recom | 2.38 | Target Price | 353.61 |
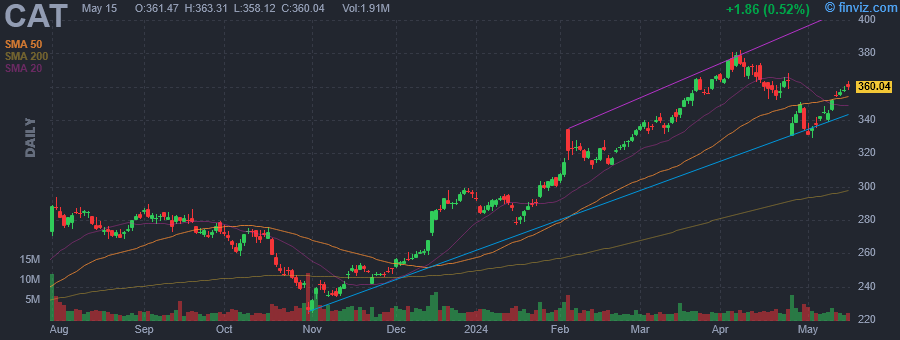
| Avg Volume | 2.31M | 52W Range | 205.60 - 382.01 |
|
|
|
|
Caterpillar, Inc. engages in the business of manufacturing construction and mining equipment, off-highway diesel and natural gas engines, industrial gas turbines, and diesel-electric locomotives. It operates through the following segments: Construction Industries, Resource Industries, Energy and Transportation, Financial Products, and All Other. The Construction Industries segment is involved in supporting customers using machinery in infrastructure and building construction applications. The Resource Industries segment offers machinery in mining, heavy construction, quarry, and aggregates. The Energy and Transportation segment focuses on reciprocating engines, turbines, diesel-electric locomotives, and related services across industries serving oil and gas, power generation, industrial, and transportation applications including marine- and rail-related businesses. The Financial Products segment provides financing alternatives to customers and dealers for Caterpillar products and services, as well as financing for power generation facilities. The All Other segment includes activities such as the business strategy, product management, and development, and manufacturing filters and fluids, undercarriage, tires and rims, engaging tools, and fluid transfers. The company was founded on April 15, 1925 and is headquartered in Irving, TX. |
| Insider Trading |
Relationship |
Date |
Transaction |
Cost |
#Shares |
Value ($) |
#Shares Total |
SEC Form 4 |
| Johnson Gerald | Director | May 20 '24 | Buy | 356.40 | 100 | 35,640 | 2,213 | May 22 04:26 PM | | De Lange Bob | Group President | May 13 '24 | Option Exercise | 95.17 | 30,551 | 2,907,531 | 100,949 | May 14 01:14 PM | | De Lange Bob | Group President | May 13 '24 | Sale | 356.90 | 21,847 | 7,797,194 | 71,115 | May 14 01:14 PM | | MacLennan David | Director | May 03 '24 | Buy | 337.39 | 500 | 168,695 | 5,738 | May 06 09:24 AM | | BONFIELD ANDREW R J | Chief Financial Officer | Mar 07 '24 | Option Exercise | 208.70 | 29,579 | 6,173,152 | 75,755 | Mar 08 01:45 PM |
|
|
|
 |
| Market Cap | 3.40B | EPS (ttm) | -0.02 |
| P/E | - | EPS this Y | 253.25% |
| Forward P/E | 37.02 | EPS next Y | 153.69% |
| PEG | - | EPS past 5Y | - |
| P/S | 3.54 | EPS next 5Y | - |
| P/B | 9.85 | EPS Q/Q | 199.79% |
| Dividend | - | Sales Q/Q | 45.81% |
| Insider Own | 32.05% | Inst Own | 47.20% |
| Insider Trans | -4.12% | Inst Trans | 4.52% |
| Short Float | 12.60% | Earnings | May 06/a |
| Analyst Recom | 2.08 | Target Price | 17.17 |
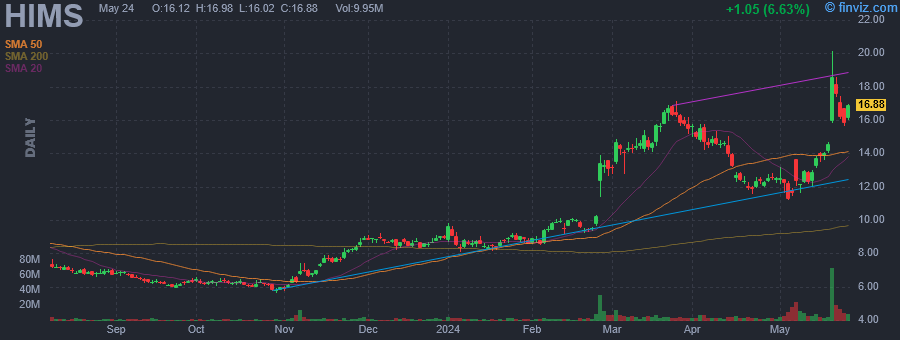
| Avg Volume | 8.22M | 52W Range | 5.65 - 20.11 |
|
|
|
|
Hims & Hers Health, Inc. operates a telehealth consultation platform. It connects consumers to healthcare professionals, enabling them to access medical care for mental health, sexual health, dermatology and primary care. The company was founded in 2017 and is headquartered in San Francisco, CA. |
| Insider Trading |
Relationship |
Date |
Transaction |
Cost |
#Shares |
Value ($) |
#Shares Total |
SEC Form 4 |
| Okupe Oluyemi | Chief Financial Officer | May 21 '24 | Option Exercise | 5.01 | 28,084 | 140,701 | 189,811 | May 22 04:16 PM | | Payne Christopher D | Director | May 21 '24 | Buy | 17.74 | 110,000 | 1,951,763 | 110,000 | May 22 04:16 PM | | Okupe Oluyemi | Chief Financial Officer | May 21 '24 | Sale | 17.88 | 38,131 | 681,689 | 151,680 | May 22 04:16 PM | | Boughton Soleil | Chief Legal Officer | May 20 '24 | Option Exercise | 5.01 | 4,915 | 24,624 | 164,272 | May 21 04:40 PM | | Okupe Oluyemi | Chief Financial Officer | May 20 '24 | Sale | 20.01 | 6,900 | 138,043 | 161,727 | May 22 04:16 PM |
|
|
| |
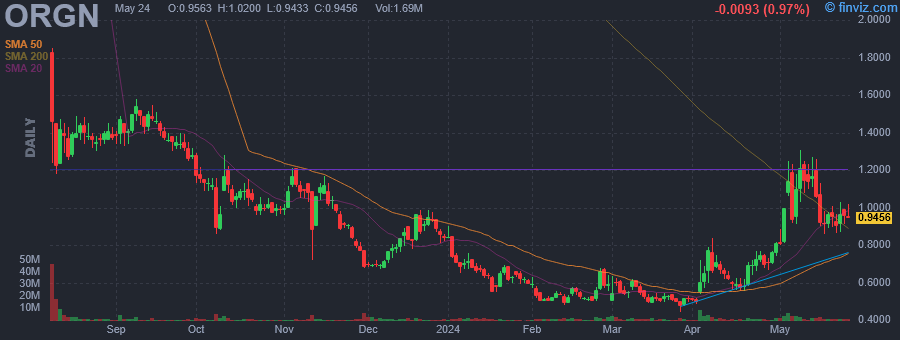 |
| Market Cap | 140.39M | EPS (ttm) | -0.00 |
| P/E | - | EPS this Y | -35.48% |
| Forward P/E | - | EPS next Y | 9.09% |
| PEG | - | EPS past 5Y | - |
| P/S | 4.14 | EPS next 5Y | - |
| P/B | 0.34 | EPS Q/Q | -243.00% |
| Dividend | - | Sales Q/Q | 300.53% |
| Insider Own | 16.30% | Inst Own | 23.20% |
| Insider Trans | -0.10% | Inst Trans | -2.35% |
| Short Float | 9.37% | Earnings | May 14/a |
| Analyst Recom | 2.00 | Target Price | 3.17 |
| Avg Volume | 2.21M | 52W Range | 0.44 - 5.04 |
|
|
|
|
Origin Materials, Inc. is a carbon negative materials company engaged in providing sustainable materials by replacing petroleum-based materials with decarbonized materials. The firm, using its platform technology, converts sustainable feedstock, such as sustainably harvested wood, agricultural waste, wood waste, and even corrugated cardboard, into materials and products that are made from fossil feedstock, such as petroleum and natural gas. Its products include food and beverage packaging, clothing, textiles, plastics, car parts, carpeting, tires, adhesives, and soil amendments. The company was founded by John Bissell and Ryan Smith in November 2008 and is headquartered in West Sacramento, CA. |
| Insider Trading |
Relationship |
Date |
Transaction |
Cost |
#Shares |
Value ($) |
#Shares Total |
SEC Form 4 |
| Heidenmark Cook Pia Johanna | Director | May 20 '24 | Buy | 0.97 | 34,000 | 32,980 | 123,198 | May 22 04:10 PM | | Riley Richard J. | CO-CEO AND DIRECTOR | Mar 05 '24 | Option Exercise | 0.14 | 400,000 | 56,000 | 1,318,070 | Mar 07 04:19 PM | | Bissell John | Co-CEO and Director | Dec 13 '23 | Sale | 0.78 | 40,000 | 31,224 | 1,173,828 | Dec 15 06:25 PM | | Lee Joshua C. | General Counsel | Dec 13 '23 | Sale | 0.77 | 17,500 | 13,556 | 261,194 | Dec 15 06:27 PM | | Lee Joshua C. | General Counsel | Nov 13 '23 | Sale | 0.92 | 12,400 | 11,353 | 278,694 | Nov 15 04:33 PM |
|
|
|
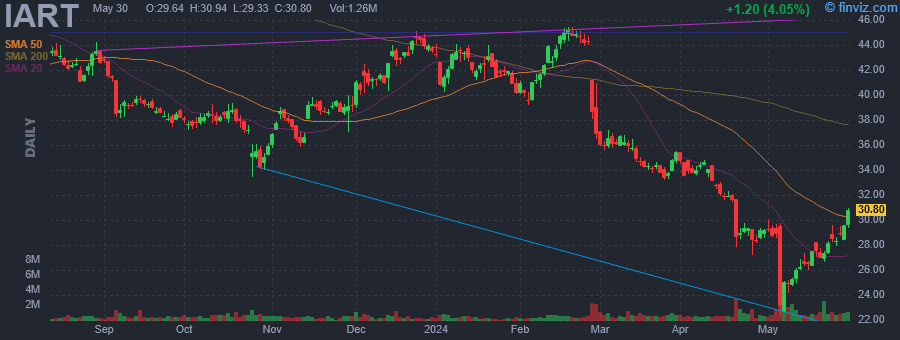 |
| Market Cap | 2.25B | EPS (ttm) | 0.51 |
| P/E | 56.24 | EPS this Y | -1.66% |
| Forward P/E | 8.54 | EPS next Y | 9.48% |
| PEG | 8.93 | EPS past 5Y | 3.10% |
| P/S | 1.47 | EPS next 5Y | 6.30% |
| P/B | 1.41 | EPS Q/Q | -114.34% |
| Dividend | - | Sales Q/Q | -3.14% |
| Insider Own | 15.90% | Inst Own | 82.80% |
| Insider Trans | 0.22% | Inst Trans | 1.28% |
| Short Float | 3.70% | Earnings | May 06/b |
| Analyst Recom | 3.00 | Target Price | 34.20 |
| Avg Volume | 1.08M | 52W Range | 22.36 - 46.75 |
|
|
|
|
Integra LifeSciences Holdings Corp. engages in the provision of regenerative tissue technologies and neurological solutions dedicated to limiting uncertainty for clinicians. It operates under the Codman Specialty Surgical (CSS) and Tissue Technologies (TT) segments. The CSS segment includes technologies and instrumentation used for neurosurgery, neurocritical care, and otolaryngology. The TT segment focuses on complex wound surgery, surgical reconstruction, and peripheral nerve repair. The company was founded by Richard E. Caruso in 1989 and is headquartered in Princeton, NJ. |
| Insider Trading |
Relationship |
Date |
Transaction |
Cost |
#Shares |
Value ($) |
#Shares Total |
SEC Form 4 |
| HILL BARBARA B | Director | May 21 '24 | Buy | 27.40 | 36,350 | 995,816 | 36,350 | May 22 04:09 PM | | De Witte Jan | President & CEO | Mar 11 '24 | Option Exercise | 0.00 | 205 | 0 | 18,555 | Mar 13 04:30 PM | | Singh Harvinder | EVP & PRESIDENT, INTERNATIONAL | Mar 10 '24 | Option Exercise | 0.00 | 1,179 | 0 | 1,179 | Mar 12 05:10 PM | | De Witte Jan | President & CEO | Mar 10 '24 | Option Exercise | 0.00 | 346 | 0 | 18,696 | Mar 12 05:12 PM | | DAVIS ROBERT T. JR. | EVP & President, TT | Mar 06 '24 | Option Exercise | 32.59 | 8,736 | 284,663 | 58,241 | Mar 08 04:22 PM |
|
|
|
 |
| Market Cap | 54.21M | EPS (ttm) | -2.02 |
| P/E | - | EPS this Y | - |
| Forward P/E | - | EPS next Y | - |
| PEG | - | EPS past 5Y | - |
| P/S | 0.29 | EPS next 5Y | - |
| P/B | 1.09 | EPS Q/Q | -199.11% |
| Dividend | 4.98% | Sales Q/Q | 0.86% |
| Insider Own | 50.58% | Inst Own | 16.92% |
| Insider Trans | 2.17% | Inst Trans | 6.84% |
| Short Float | 0.91% | Earnings | May 14/b |
| Analyst Recom | - | Target Price | - |
| Avg Volume | 3.09K | 52W Range | 10.27 - 18.75 |
|
|
|
|
Ark Restaurants Corp. engages in the operation of restaurants and bars, fast food concepts, and catering operations. It operates in New York City, Florida, Washington, D.C, Las Vegas, NV, and the gulf coast of Alabama. The company was founded on January 4, 1983 and is headquartered in New York, NY. |
| Insider Trading |
Relationship |
Date |
Transaction |
Cost |
#Shares |
Value ($) |
#Shares Total |
SEC Form 4 |
| SATTERFIELD THOMAS A JR | 10% Owner | May 21 '24 | Buy | 15.73 | 3,301 | 51,925 | 57,301 | May 22 04:05 PM | | SATTERFIELD THOMAS A JR | 10% Owner | May 20 '24 | Buy | 15.28 | 14,000 | 213,900 | 200,000 | May 22 04:05 PM | | SATTERFIELD THOMAS A JR | 10% Owner | May 20 '24 | Buy | 14.56 | 1,578 | 22,976 | 57,500 | May 22 04:05 PM | | SATTERFIELD THOMAS A JR | 10% Owner | May 15 '24 | Buy | 15.30 | 3,322 | 50,827 | 55,922 | May 16 06:00 PM | | SATTERFIELD THOMAS A JR | 10% Owner | May 15 '24 | Buy | 15.00 | 1,549 | 23,235 | 150,000 | May 16 06:00 PM |
|
|
|
