 |
| Market Cap | 143.62B | EPS (ttm) | 5.54 |
| P/E | 73.06 | EPS this Y | 10.02% |
| Forward P/E | 54.94 | EPS next Y | 17.30% |
| PEG | 5.81 | EPS past 5Y | 9.71% |
| P/S | 19.62 | EPS next 5Y | 12.56% |
| P/B | 10.29 | EPS Q/Q | 51.45% |
| Dividend | - | Sales Q/Q | 11.46% |
| Insider Own | 0.69% | Inst Own | 86.16% |
| Insider Trans | -10.14% | Inst Trans | -0.44% |
| Short Float | 1.04% | Earnings | Apr 18/a |
| Analyst Recom | 1.97 | Target Price | 428.53 |
| Avg Volume | 1.41M | 52W Range | 254.85 - 408.43 |
|
|
| Today | Initiated |
Goldman |
Buy |
$500 |
|
|
|
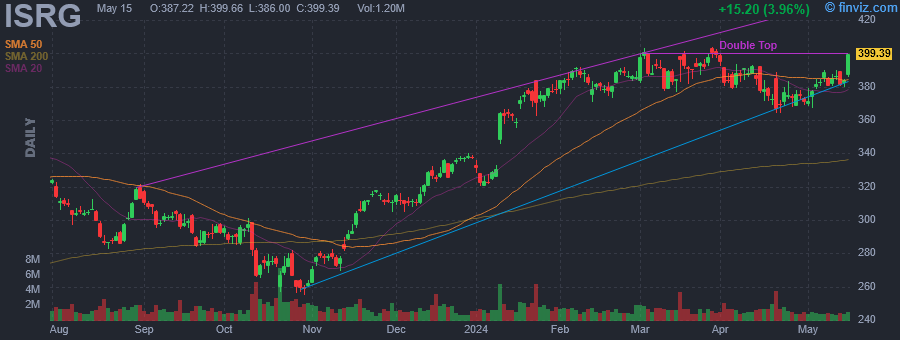
Intuitive Surgical, Inc. engages in the provision of robotic-assisted surgical solutions and invasive care through a comprehensive ecosystem of products and services. Its products include Da Vinci Surgical and Ion Endoluminal systems. The company was founded by Frederic H. Moll, John Gordon Freund, and Robert G. Younge in November 1995 and is headquartered in Sunnyvale, CA. |
| Insider Trading |
Relationship |
Date |
Transaction |
Cost |
#Shares |
Value ($) |
#Shares Total |
SEC Form 4 |
| Brosius Mark | SVP & Chief Mfg and Supply Cha | May 17 '24 | Sale | 396.19 | 63 | 24,960 | 295 | May 17 06:05 PM | | Miller Brian Edward | EVP & Chief Digital Officer | May 16 '24 | Sale | 400.00 | 2,553 | 1,021,200 | 9,619 | May 17 04:33 PM | | Brosius Mark | SVP & Chief Mfg and Supply Cha | May 16 '24 | Sale | 398.28 | 175 | 69,699 | 358 | May 17 06:05 PM | | Brosius Mark | SVP & Chief Mfg and Supply Cha | May 15 '24 | Sale | 387.22 | 175 | 67,764 | 533 | May 15 05:39 PM | | Brosius Mark | SVP & Chief Mfg and Supply Cha | May 14 '24 | Sale | 380.85 | 175 | 66,649 | 708 | May 15 05:39 PM |
|
|
 |
 |
| Market Cap | 151.78B | EPS (ttm) | 7.94 |
| P/E | 13.58 | EPS this Y | -1.17% |
| Forward P/E | 12.09 | EPS next Y | 7.46% |
| PEG | 2.87 | EPS past 5Y | 3.64% |
| P/S | 1.68 | EPS next 5Y | 4.73% |
| P/B | 1.87 | EPS Q/Q | 9.05% |
| Dividend | 3.81% | Sales Q/Q | 16.68% |
| Insider Own | 0.01% | Inst Own | 48.78% |
| Insider Trans | 0.00% | Inst Trans | -0.94% |
| Short Float | 1.28% | Earnings | May 30/b |
| Analyst Recom | 2.40 | Target Price | 96.19 |
| Avg Volume | 1.07M | 52W Range | 77.90 - 107.19 |
|
|
|
|
Royal Bank of Canada engages in the provision of banking and financial services. It operates through the following segments: Personal and Commercial Banking, Wealth Management, Insurance, Capital Markets, and Corporate Support. The Personal and Commercial Banking segment deals with a broad suite of financial products and services in both individual and business clients in Canada, the Caribbean, and the U.S. The Wealth Management segment offers a suite of wealth, investment, trust, banking, credit, and other advice-based solutions. It also offers other wealth management solutions to institutional and individual clients through its distribution channels and third-party distributors. The Insurance segment refers to a suite of advice and solutions for individual and business clients including life, health, wealth, property and casualty, travel, group benefits, annuities, and reinsurance. The Capital Markets segment is involved in the provision of advisory and origination, sales and trading, lending and financing and transaction banking to corporations, institutional clients, asset managers, private equity firms and governments globally. The Corporate Support segment consists of technology and operations services. The company was founded by J. W. Merkell, Edward Kenny, T. C. Kinnear, James B. Duffus, William Cunard, John Tobin, George P. Mitchell and Jeremiah Northup in 1864 and is headquartered in Toronto, Canada. |
|
|
 |
| Market Cap | 9.25B | EPS (ttm) | 0.31 |
| P/E | 75.04 | EPS this Y | 15.25% |
| Forward P/E | 15.87 | EPS next Y | 15.27% |
| PEG | 5.44 | EPS past 5Y | -3.14% |
| P/S | 1.53 | EPS next 5Y | 13.80% |
| P/B | 4.67 | EPS Q/Q | -109.28% |
| Dividend | 2.25% | Sales Q/Q | -7.59% |
| Insider Own | 77.80% | Inst Own | 20.87% |
| Insider Trans | -0.43% | Inst Trans | 0.93% |
| Short Float | 10.17% | Earnings | Apr 03/a |
| Analyst Recom | 2.14 | Target Price | 21.98 |
| Avg Volume | 2.67M | 52W Range | 12.41 - 23.00 |
|
|
|
|
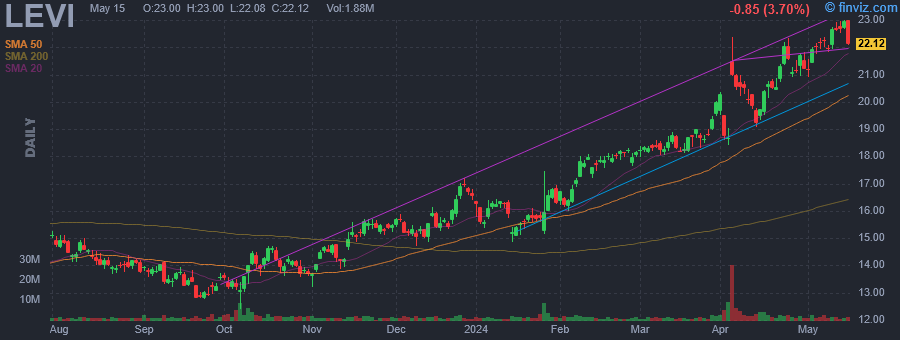
Levi Strauss & Co. engages in the design, marketing, and sale of apparel products. The company offers jeans, casual and dress pants, tops, shorts, skirts, jackets, footwear, and related accessories. It operates through the following geographical segments: Americas, Europe, and Asia. The company was founded by Levi Strauss in 1853 and is headquartered in San Francisco, CA. |
| Insider Trading |
Relationship |
Date |
Transaction |
Cost |
#Shares |
Value ($) |
#Shares Total |
SEC Form 4 |
| Peter E. Haas Jr. Family Fund | 10% Owner | May 17 '24 | Sale | 21.96 | 56,743 | 1,246,258 | 0 | May 17 07:32 PM | | Peter E. Haas Jr. Family Fund | 10% Owner | May 16 '24 | Sale | 22.17 | 140,839 | 3,122,330 | 0 | May 17 07:32 PM | | Peter E. Haas Jr. Family Fund | 10% Owner | May 15 '24 | Sale | 22.33 | 102,418 | 2,286,963 | 0 | May 17 07:32 PM | | Haas Margaret E. | 10% Owner | May 15 '24 | Sale | 22.40 | 100,000 | 2,240,080 | 0 | May 17 04:31 PM | | Singh Harmit J | EVP & Chief Fin. & Growth Ofc. | May 08 '24 | Sale | 21.97 | 282,445 | 6,205,119 | 242,892 | May 09 04:10 PM |
|
|
| |
 |
| Market Cap | 2.15B | EPS (ttm) | 0.04 |
| P/E | 54.89 | EPS this Y | -135.60% |
| Forward P/E | - | EPS next Y | 53.19% |
| PEG | - | EPS past 5Y | - |
| P/S | 281.22 | EPS next 5Y | - |
| P/B | 4.68 | EPS Q/Q | -223.53% |
| Dividend | - | Sales Q/Q | -71.87% |
| Insider Own | 0.85% | Inst Own | 45.58% |
| Insider Trans | 0.00% | Inst Trans | -8.39% |
| Short Float | 4.84% | Earnings | May 08/a |
| Analyst Recom | 1.43 | Target Price | 3.09 |
| Avg Volume | 16.10M | 52W Range | 1.00 - 2.42 |
|
|
|
|
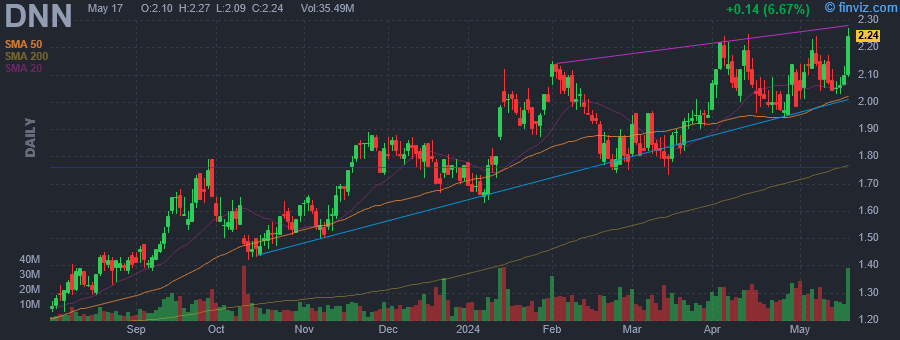
Denison Mines Corp. engages in the exploration and development of uranium. The firm has interests in the Athabasca Basin, Wheeler River, Midwest Project, McClean Lake, and Waterbury Lake. The company was founded on May 9, 1997 and is headquartered in Toronto, Canada. |
|
|
 |
| Market Cap | 8.30B | EPS (ttm) | 1.51 |
| P/E | 33.37 | EPS this Y | 8.60% |
| Forward P/E | 26.06 | EPS next Y | 9.44% |
| PEG | 3.39 | EPS past 5Y | 13.25% |
| P/S | 3.37 | EPS next 5Y | 9.85% |
| P/B | 4.75 | EPS Q/Q | 80.87% |
| Dividend | 1.02% | Sales Q/Q | 5.93% |
| Insider Own | 2.63% | Inst Own | 90.50% |
| Insider Trans | -0.95% | Inst Trans | 0.81% |
| Short Float | 3.53% | Earnings | May 08/b |
| Analyst Recom | 2.09 | Target Price | 49.37 |
| Avg Volume | 1.19M | 52W Range | 35.06 - 50.26 |
|
|
|
|
The New York Times Co. is a media organization, which engages in creating, collecting, and distributing news and information. It offers news products and other interest-specific products, and related content and services. It offers newspapers, print, and digital products and investments. The firm also manages The New York Times, NYTimes.com, and mobile applications. The company was founded by Henry Jarvis Raymond and George Jones on September 18, 1851, and is headquartered in New York, NY. |
| Insider Trading |
Relationship |
Date |
Transaction |
Cost |
#Shares |
Value ($) |
#Shares Total |
SEC Form 4 |
| BENTEN R ANTHONY | SVP, Treasurer & CAO | May 21 '24 | Sale | 48.98 | 5,171 | 253,283 | 38,576 | May 23 05:25 PM | | KOPIT LEVIEN MEREDITH A. | PRESIDENT & CEO | May 10 '24 | Sale | 47.72 | 12,548 | 598,841 | 120,072 | May 14 05:05 PM | | Brayton Diane | EVP, GENERAL COUNSEL | Feb 22 '24 | Sale | 42.84 | 7,000 | 299,880 | 39,312 | Feb 23 05:25 PM | | KOPIT LEVIEN MEREDITH A. | PRESIDENT & CEO | Feb 16 '24 | Sale | 44.11 | 13,543 | 597,382 | 90,759 | Feb 21 05:19 PM | | Perpich David S. | Director | Feb 14 '24 | Sale | 44.03 | 3,014 | 132,706 | 20,813 | Feb 15 04:21 PM |
|
|
| |
 |
| Market Cap | 199.42B | EPS (ttm) | 7.35 |
| P/E | 23.15 | EPS this Y | 31.68% |
| Forward P/E | 15.14 | EPS next Y | 23.14% |
| PEG | 0.90 | EPS past 5Y | 15.59% |
| P/S | 2.54 | EPS next 5Y | 25.78% |
| P/B | 3.23 | EPS Q/Q | 26.03% |
| Dividend | 1.56% | Sales Q/Q | -0.19% |
| Insider Own | 62.37% | Inst Own | 38.98% |
| Insider Trans | -2.63% | Inst Trans | -1.05% |
| Short Float | 5.31% | Earnings | Apr 25/a |
| Analyst Recom | 1.50 | Target Price | 186.24 |
| Avg Volume | 4.39M | 52W Range | 124.92 - 169.11 |
|
|
|
|
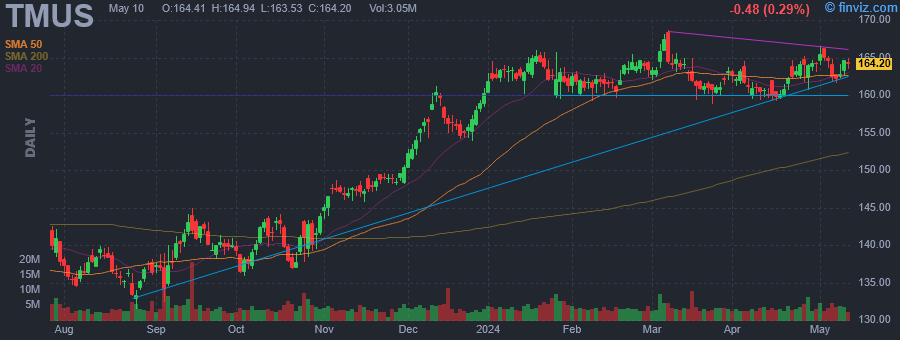
T-Mobile US, Inc. engages in the provision of wireless communications services under the T-Mobile and MetroPCS brands. It offers postpaid and prepaid wireless voice, messaging and data services, and wholesale wireless services. The company was founded in 1994 and is headquartered in Bellevue, WA. |
| Insider Trading |
Relationship |
Date |
Transaction |
Cost |
#Shares |
Value ($) |
#Shares Total |
SEC Form 4 |
| DEUTSCHE TELEKOM AG | Director | May 24 '28 | Sale | 165.66 | 189,670 | 31,421,035 | 674,313,641 | May 28 07:30 PM | | DEUTSCHE TELEKOM AG | Director | May 28 '24 | Sale | 167.13 | 189,670 | 31,699,768 | 674,123,971 | May 28 07:30 PM | | DEUTSCHE TELEKOM AG | Director | May 23 '24 | Sale | 164.98 | 189,670 | 31,291,014 | 674,503,311 | May 23 09:52 PM | | Freier Jon | President, Consumer Group | May 23 '24 | Sale | 164.38 | 20,000 | 3,287,600 | 172,628 | May 28 05:01 PM | | DEUTSCHE TELEKOM AG | Director | May 22 '24 | Sale | 165.06 | 189,670 | 31,307,408 | 674,692,981 | May 23 09:52 PM |
|
|
|
 |
| Market Cap | 289.85M | EPS (ttm) | -0.24 |
| P/E | - | EPS this Y | -366.67% |
| Forward P/E | - | EPS next Y | 50.00% |
| PEG | - | EPS past 5Y | - |
| P/S | 4.03 | EPS next 5Y | 22.40% |
| P/B | 1.83 | EPS Q/Q | -81.39% |
| Dividend | - | Sales Q/Q | -51.60% |
| Insider Own | 38.05% | Inst Own | 14.01% |
| Insider Trans | 0.00% | Inst Trans | -2.83% |
| Short Float | 0.22% | Earnings | May 08/b |
| Analyst Recom | 1.00 | Target Price | 3.67 |
| Avg Volume | 334.75K | 52W Range | 1.91 - 2.78 |
|
|
|
|
Valens Semiconductor Ltd. engages in the provision of semiconductor products. It operates through the Audio-Video and Automotive segments. The Audio-Video segment delivers plug-and-play convergence and distributes interfaces through a single long-distance category cable. The Automotive segment pertains to Valens Automotive products, which enables in-vehicle connectivity for car architectures. The company was founded by Dror Jerushalmi, Massad Eyal, Eyran Lida, Gaby Gur-Cohen, Nadav Banet, and Alon Benzaray on October 26, 2006 and is headquartered in Hod Hasharon, Israel. |
|
| |
 |
| Market Cap | 27.70B | EPS (ttm) | 29.29 |
| P/E | 37.17 | EPS this Y | 6.50% |
| Forward P/E | 30.51 | EPS next Y | 14.90% |
| PEG | 3.66 | EPS past 5Y | 26.96% |
| P/S | 6.45 | EPS next 5Y | 10.15% |
| P/B | 13.27 | EPS Q/Q | 42.87% |
| Dividend | - | Sales Q/Q | 21.30% |
| Insider Own | 0.97% | Inst Own | 100.37% |
| Insider Trans | -22.40% | Inst Trans | -0.11% |
| Short Float | 3.64% | Earnings | May 23/a |
| Analyst Recom | 1.77 | Target Price | 1063.60 |
| Avg Volume | 465.29K | 52W Range | 464.25 - 1083.71 |
|
|
|
|
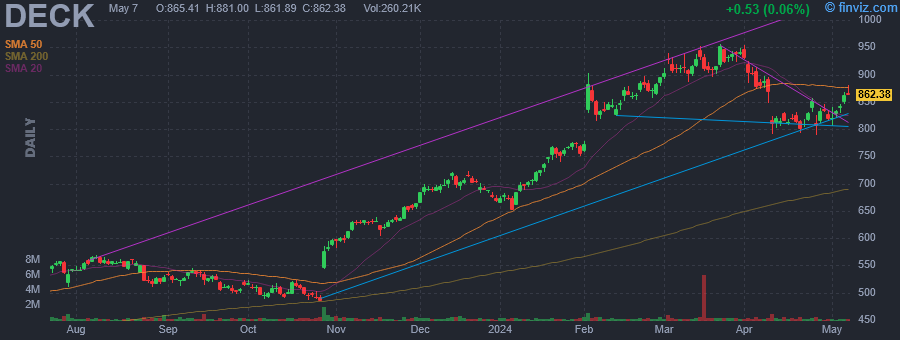
Deckers Outdoor Corp. engages in the business of designing, marketing, and distributing footwear, apparel, and accessories developed for both everyday casual lifestyle use and high performance activities. It operates through the following segments: UGG Brand, HOKA Brand, Teva Brand, Sanuk Brand, Other Brands, and Direct-to-Consumer. The UGG Brand segment offers a line of premium footwear, apparel, and accessories. The HOKA Brand segment sells footwear and apparel that offers enhanced cushioning and inherent stability with minimal weight, originally designed for ultra-runners. The Teva Brand segment focuses on the sport sandal and modern outdoor lifestyle category, such as sandals, shoes, and boots. The Sanuk Brand segment originated in Southern California surf culture and has emerged into a lifestyle brand with a presence in the relaxed casual shoe and sandal categories. The Other Brands segment includes the Koolaburra by UGG brand. The Direct-to-Consumer segment consists of retail stores and e-commerce websites. The company was founded by Douglas B. Otto in 1973 and is headquartered in Goleta, CA. |
| Insider Trading |
Relationship |
Date |
Transaction |
Cost |
#Shares |
Value ($) |
#Shares Total |
SEC Form 4 |
| Garcia Thomas | Chief Administrative Officer | May 29 '24 | Sale | 1074.86 | 4,000 | 4,299,440 | 11,654 | May 29 07:26 PM | | DEVINE MICHAEL F III | Director | May 29 '24 | Sale | 1077.00 | 2,000 | 2,154,000 | 6,204 | May 29 05:20 PM | | Powers David | President & CEO | Apr 15 '24 | Option Exercise | 69.29 | 5,993 | 415,255 | 104,211 | Apr 16 08:04 PM | | Powers David | President & CEO | Apr 15 '24 | Sale | 824.11 | 5,993 | 4,938,909 | 98,218 | Apr 16 08:04 PM | | Powers David | President & CEO | Mar 15 '24 | Option Exercise | 69.29 | 5,993 | 415,255 | 104,211 | Mar 18 05:17 PM |
|
|
|
 |
| Market Cap | 4.44B | EPS (ttm) | 1.49 |
| P/E | 5.88 | EPS this Y | 4.25% |
| Forward P/E | 6.82 | EPS next Y | -21.12% |
| PEG | - | EPS past 5Y | - |
| P/S | 1.85 | EPS next 5Y | - |
| P/B | 1.89 | EPS Q/Q | -14.54% |
| Dividend | 15.96% | Sales Q/Q | 31.45% |
| Insider Own | 44.81% | Inst Own | 31.88% |
| Insider Trans | 0.00% | Inst Trans | - |
| Short Float | 0.02% | Earnings | May 15/b |
| Analyst Recom | 1.00 | Target Price | 9.91 |
| Avg Volume | 165.73K | 52W Range | 4.50 - 8.72 |
|
|
|
|
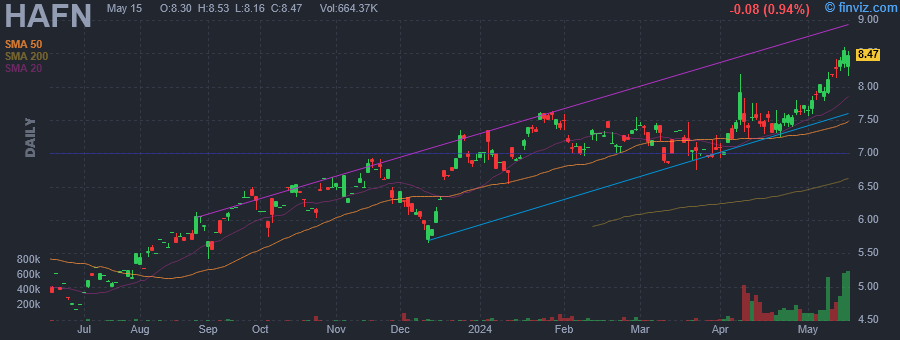
Hafnia Ltd. engages in the provision of offshore oil and gas transportation services. It operates through the following segments: Long Range II (LR2), Long Range I (LR1), Medium Range (MR), Handy Size (Handy), Chemical Handy Size (Chemical-Handy), Chemical Medium Range (Chemical-MR), and Chemical Stainless (Chemical-Stainless). The LR2 segment consists of vessels between 85,000 DWT and 124,999 DWT in size and provides transportation of clean petroleum oil products. The LR1 segment refers to the vessels between 55,000 DWT and 84,999 DWT in size and provides transportation of clean and dirty petroleum products. The MR and Chemical-MR segment is involved in vessels between 40,000 DWT and 54,999 DWT in size and provides transportation of clean and dirty oil products, vegetable oil, and easy chemicals. The Handy and Chemical-Handy segment focuses on the vessels between 25,000 DWT and 39,999 DWT in size and provides transportation of clean and dirty oil products, vegetable oil, and easy chemicals. The company was founded by Soren Steenberg Jensen on April 29, 2014 and is headquartered in Singapore. |
|
|
 |
| Market Cap | 13.16B | EPS (ttm) | 25.87 |
| P/E | 5.21 | EPS this Y | 24.60% |
| Forward P/E | 14.76 | EPS next Y | 4.95% |
| PEG | 0.79 | EPS past 5Y | 40.40% |
| P/S | 0.63 | EPS next 5Y | 6.62% |
| P/B | 3.81 | EPS Q/Q | 1485.03% |
| Dividend | - | Sales Q/Q | 6.91% |
| Insider Own | 2.55% | Inst Own | 96.78% |
| Insider Trans | -2.80% | Inst Trans | 2.79% |
| Short Float | 4.90% | Earnings | Apr 30/b |
| Analyst Recom | 1.48 | Target Price | 138.32 |
| Avg Volume | 1.28M | 52W Range | 51.04 - 134.89 |
|
|
| Today | Initiated |
Robert W. Baird |
Outperform |
$153 |
|
|
|
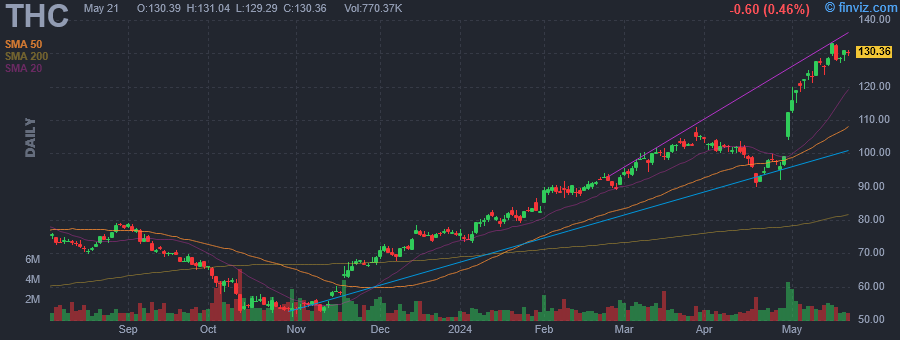
Tenet Healthcare Corp. engages in the provision of healthcare services. It operates through the Hospital Operations and Other, and Ambulatory Care segments. The Hospital Operations and Other segment is composed of acute care hospitals, ancillary outpatient facilities, urgent care centers, micro hospitals and physician practices. The Ambulatory Care segment includes the operations of the USPI joint venture and the company's nine Aspen facilities in the United Kingdom. The company was founded in 1969 and is headquartered in Dallas, TX. |
| Insider Trading |
Relationship |
Date |
Transaction |
Cost |
#Shares |
Value ($) |
#Shares Total |
SEC Form 4 |
| West Nadja | Director | May 09 '24 | Sale | 126.41 | 1,782 | 225,263 | 29,680 | May 10 08:00 PM | | FISHER RICHARD W | Director | May 07 '24 | Sale | 123.20 | 2,500 | 308,000 | 17,627 | May 09 08:00 PM | | Arnst Thomas W | EVP, Chief Admin. Officer & GC | May 01 '24 | Sale | 116.10 | 8,148 | 945,994 | 0 | May 03 08:00 PM | | MARK RICHARD J | Director | Mar 12 '24 | Sale | 98.98 | 14,000 | 1,385,720 | 33,303 | Mar 14 08:00 PM | | Arbour Paola M | EVP, Chief Information Officer | Mar 06 '24 | Sale | 96.96 | 18,168 | 1,761,569 | 29,803 | Mar 08 08:00 PM |
|
|
|
