 |
| Market Cap | 42.63B | EPS (ttm) | 4.20 |
| P/E | 34.66 | EPS this Y | 1.12% |
| Forward P/E | 23.84 | EPS next Y | 10.95% |
| PEG | 4.88 | EPS past 5Y | 33.93% |
| P/S | 6.33 | EPS next 5Y | 7.10% |
| P/B | 6.89 | EPS Q/Q | -0.13% |
| Dividend | 0.65% | Sales Q/Q | -5.58% |
| Insider Own | 0.42% | Inst Own | 91.92% |
| Insider Trans | -11.35% | Inst Trans | -3.29% |
| Short Float | 1.45% | Earnings | May 29/a |
| Analyst Recom | 2.38 | Target Price | 147.60 |
| Avg Volume | 1.51M | 52W Range | 96.80 - 155.35 |
|
|
|
|
Agilent Technologies, Inc. engages in the provision of application focused solutions for life sciences, diagnostics, and applied chemical markets. It operates through the following segments: Life Sciences and Applied Markets, Diagnostics and Genomics, and Agilent CrossLab. The Life Sciences and Applied Markets segment offers application-focused solutions that include instruments and software that identify, quantify, and analyze the physical and biological properties of substances and products, as well as the clinical and life sciences research areas to interrogate samples at the molecular and cellular level. The Diagnostics and Genomics segment consists of activity providing active pharmaceutical ingredients for oligo-based therapeutics, as well as solutions that include reagents, instruments, software and consumables. The Agilent CrossLab segment includes startup, operational, training and compliance support, software as a service, and asset management and consultative services. The company was founded in May 1999 and is headquartered in Santa Clara, CA. |
| Insider Trading |
Relationship |
Date |
Transaction |
Cost |
#Shares |
Value ($) |
#Shares Total |
SEC Form 4 |
| Binns Philip | Senior Vice President | Mar 25 '24 | Sale | 147.54 | 2,827 | 417,096 | 9,997 | Mar 27 01:29 PM | | McMullen Michael R. | CEO and President | Mar 08 '24 | Sale | 150.00 | 52,297 | 7,844,550 | 253,909 | Mar 12 02:37 PM | | Gonsalves Rodney | V.P., Corporate Controller | Mar 07 '24 | Sale | 149.00 | 4,828 | 719,348 | 21,329 | Mar 08 12:05 PM | | FIELDS HEIDI | Director | Mar 05 '24 | Sale | 144.34 | 1,658 | 239,316 | 54,976 | Mar 07 10:38 AM | | Binns Philip | Senior Vice President | Dec 27 '23 | Sale | 139.78 | 2,880 | 402,566 | 12,824 | Dec 28 01:46 PM |
|
|
 |
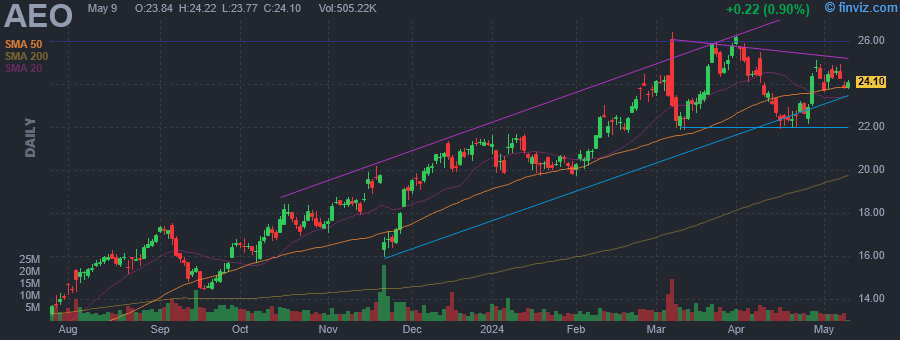 |
| Market Cap | 4.72B | EPS (ttm) | 0.86 |
| P/E | 27.94 | EPS this Y | 14.96% |
| Forward P/E | 12.51 | EPS next Y | 10.06% |
| PEG | 2.20 | EPS past 5Y | -10.10% |
| P/S | 0.90 | EPS next 5Y | 12.70% |
| P/B | 2.73 | EPS Q/Q | -88.55% |
| Dividend | 1.98% | Sales Q/Q | 12.22% |
| Insider Own | 8.41% | Inst Own | 99.75% |
| Insider Trans | -1.40% | Inst Trans | -2.40% |
| Short Float | 13.03% | Earnings | May 29/a |
| Analyst Recom | 2.82 | Target Price | 26.40 |
| Avg Volume | 4.51M | 52W Range | 10.05 - 26.44 |
|
|
|
|
American Eagle Outfitters, Inc. is a multi-brand specialty retailer, which offers an assortment of apparel and accessories for men and women under the American Eagle Outfitters brand, and intimates, apparel and personal care products for women under the Aerie brand. The firm operates stores in the United States, Canada, Mexico, Hong Kong, China and the United Kingdom. It also acquired two emerging brands to complement its existing brands, Tailgate, a vintage sports-inspired apparel brand, and Todd Snyder New York, a premium menswear brand. The company was founded in 1977 and is headquartered in Pittsburgh, PA. |
| Insider Trading |
Relationship |
Date |
Transaction |
Cost |
#Shares |
Value ($) |
#Shares Total |
SEC Form 4 |
| SCHOTTENSTEIN JAY L | Exec Chairman & CEO | Apr 09 '24 | Option Exercise | 0.00 | 15,384 | 0 | 1,778,044 | Apr 11 05:02 PM | | Mathias Michael A. | EVP and CFO | Apr 09 '24 | Option Exercise | 0.00 | 2,822 | 0 | 91,219 | Apr 11 05:02 PM | | Keefer James H JR | SVP, Controller & CAO | Apr 09 '24 | Option Exercise | 0.00 | 1,100 | 0 | 18,385 | Apr 11 05:02 PM | | Foyle Jennifer M. | Global Brand President-aerie | Apr 09 '24 | Option Exercise | 0.00 | 8,792 | 0 | 235,289 | Apr 11 05:01 PM | | MCMILLAN CARY D | Director | Apr 05 '24 | Sale | 24.59 | 1,908 | 46,927 | 0 | Apr 08 05:06 PM |
|
|
|
 |
| Market Cap | 2.92B | EPS (ttm) | -2.32 |
| P/E | - | EPS this Y | 15.05% |
| Forward P/E | - | EPS next Y | 81.83% |
| PEG | - | EPS past 5Y | -62.57% |
| P/S | 9.85 | EPS next 5Y | - |
| P/B | 3.25 | EPS Q/Q | -5.68% |
| Dividend | - | Sales Q/Q | 17.60% |
| Insider Own | 13.58% | Inst Own | 40.56% |
| Insider Trans | -0.37% | Inst Trans | -3.01% |
| Short Float | 32.69% | Earnings | May 29/a |
| Analyst Recom | 3.13 | Target Price | 29.28 |
| Avg Volume | 6.05M | 52W Range | 20.23 - 48.87 |
|
|
|
|
C3.ai, Inc. engages in the provision of enterprise artificial intelligence software for digital transformation. It delivers the C3 AI suite for developing, deploying, and operating large-scale AI, predictive analytics, and Internet of Things applications in addition to a portfolio of turn-key AI applications. The company was founded by Thomas M. Siebel, Patricia A. House and Stephen Maurice Ward, Jr. on January 8, 2009 and is headquartered in Redwood City, CA. |
| Insider Trading |
Relationship |
Date |
Transaction |
Cost |
#Shares |
Value ($) |
#Shares Total |
SEC Form 4 |
| Davis Lisa Ann | Director | Dec 27 '23 | Option Exercise | 13.49 | 2,000 | 26,980 | 27,945 | Dec 29 04:58 PM | | Parkkinen Juho | SVP & Chief Financial Officer | Dec 26 '23 | Sale | 28.80 | 407 | 11,722 | 295,815 | Dec 26 09:02 PM | | Parkkinen Juho | SVP & Chief Financial Officer | Dec 20 '23 | Sale | 32.16 | 685 | 22,030 | 296,222 | Dec 20 06:43 PM | | ABBO EDWARD Y | Chief Technology Officer | Dec 18 '23 | Sale | 30.73 | 45,548 | 1,399,690 | 727,373 | Dec 19 07:02 PM | | Parkkinen Juho | SVP & Chief Financial Officer | Dec 18 '23 | Sale | 30.56 | 5,513 | 168,477 | 296,907 | Dec 20 06:43 PM |
|
|
| |
 |
| Market Cap | 570.65M | EPS (ttm) | -0.58 |
| P/E | - | EPS this Y | - |
| Forward P/E | - | EPS next Y | - |
| PEG | - | EPS past 5Y | 6.17% |
| P/S | 4.22 | EPS next 5Y | 25.00% |
| P/B | 6.18 | EPS Q/Q | 83.45% |
| Dividend | - | Sales Q/Q | 64.79% |
| Insider Own | 4.39% | Inst Own | 64.10% |
| Insider Trans | -3.03% | Inst Trans | 1.14% |
| Short Float | 5.36% | Earnings | May 29/a |
| Analyst Recom | 1.00 | Target Price | 15.67 |
| Avg Volume | 421.78K | 52W Range | 4.02 - 17.37 |
|
|
|
|
American Superconductor Corp. engages in the provision of megawatt-scale power solutions, which improve the performance of the power grid and lower the cost of wind power. It operates through the Grid and Wind segments. The Grid segment enables electric utilities and renewable energy project developers to connect, transmit, and distribute power with efficiency, reliability, security, and affordability. The Wind segment permits the manufacturers to field wind turbines with power output, reliability, and affordability. The company was founded by Yet Ming Chiang, David A. Rudman, John B. Vander Sande, and Gregory J. Yurek on April 9, 1987 and is headquartered in Ayer, MA. |
| Insider Trading |
Relationship |
Date |
Transaction |
Cost |
#Shares |
Value ($) |
#Shares Total |
SEC Form 4 |
| Kosiba John W JR | SVP, CFO & Treasurer | May 21 '24 | Sale | 14.82 | 29,000 | 429,814 | 348,136 | May 23 04:33 PM | | McGahn Daniel P | Chairman, President and CEO | May 21 '24 | Sale | 14.82 | 20,559 | 304,741 | 1,057,121 | May 23 04:29 PM | | McGahn Daniel P | Chairman, President and CEO | Jun 22 '23 | Sale | 5.95 | 36,902 | 219,596 | 1,077,680 | Jun 23 04:19 PM | | Kosiba John W JR | SVP, CFO & Treasurer | Jun 22 '23 | Sale | 5.95 | 29,878 | 177,816 | 377,136 | Jun 23 04:15 PM | | McGahn Daniel P | Chairman, President and CEO | Jun 21 '23 | Sale | 6.14 | 73,802 | 453,351 | 1,114,582 | Jun 23 04:19 PM |
|
|
|
 |
| Market Cap | 92.59M | EPS (ttm) | 0.03 |
| P/E | 264.67 | EPS this Y | - |
| Forward P/E | 5.88 | EPS next Y | 10.70% |
| PEG | - | EPS past 5Y | - |
| P/S | - | EPS next 5Y | - |
| P/B | - | EPS Q/Q | - |
| Dividend | 13.16% | Sales Q/Q | - |
| Insider Own | 0.19% | Inst Own | 96.90% |
| Insider Trans | 370.13% | Inst Trans | - |
| Short Float | 0.90% | Earnings | May 29/a |
| Analyst Recom | 1.00 | Target Price | 8.50 |
| Avg Volume | 82.65K | 52W Range | 7.18 - 9.19 |
|
|
|
|
Carlyle Credit Income Fund is a close ended fixed income mutual fund launched and managed by Vertical Capital Asset Management, LLC. The fund is co - managed by Behringer Advisors, LLC. The Fund invests mainly in fixed-income securities. The fund invests in stocks of companies operating across diversified sectors. It seeks to benchmark the performance of its portfolio against the Barclays Capital U.S. Mortgage Backed Securities Index. Carlyle Credit Income Fund was formed on December 30, 2011 and is domiciled in the United States. |
| Insider Trading |
Relationship |
Date |
Transaction |
Cost |
#Shares |
Value ($) |
#Shares Total |
SEC Form 4 |
| Joseph Nelson | PFO, PAO & Treasurer | Dec 21 '23 | Buy | 7.80 | 2,500 | 19,500 | 2,500 | Dec 21 06:43 PM | | Lefkowitz Joshua | CCO, CLO & Secretary | Dec 21 '23 | Buy | 7.81 | 650 | 5,076 | 1,118 | Dec 21 06:48 PM | | Lefkowitz Joshua | CCO, CLO & Secretary | Dec 20 '23 | Buy | 7.87 | 468 | 3,683 | 468 | Dec 21 06:48 PM | | Basmadjian Lauren Michelle | Principal Executive Officer | Dec 19 '23 | Buy | 7.79 | 4,000 | 31,160 | 13,550 | Dec 20 04:46 PM | | Basmadjian Lauren Michelle | Principal Executive Officer | Dec 18 '23 | Buy | 7.85 | 9,550 | 74,968 | 9,550 | Dec 20 04:46 PM |
|
|
| |
 |
| Market Cap | 3.98B | EPS (ttm) | 1.78 |
| P/E | 19.16 | EPS this Y | 22.19% |
| Forward P/E | 7.15 | EPS next Y | 11.78% |
| PEG | 0.61 | EPS past 5Y | 3.40% |
| P/S | 0.75 | EPS next 5Y | 31.57% |
| P/B | 2.05 | EPS Q/Q | -48.51% |
| Dividend | - | Sales Q/Q | -5.62% |
| Insider Own | 2.45% | Inst Own | 85.12% |
| Insider Trans | 0.00% | Inst Trans | -3.78% |
| Short Float | 8.17% | Earnings | May 29/a |
| Analyst Recom | 3.00 | Target Price | 52.50 |
| Avg Volume | 1.43M | 52W Range | 33.76 - 54.52 |
|
|
|
|
Capri Holdings Ltd. operates as a global fashion luxury group. It engages in the design and distribution of sportswear, accessories, footwear and apparel of branded women's apparel, and accessories and men's apparel. The firm operates through the following segments: Versace, Jimmy Choo, and Michael Kors. The Versace segment sells Versace luxury ready-to-wear, accessories, footwear, and home furnishings through directly operated Versace boutiques. The Jimmy Choo segment sells Jimmy Choo luxury goods to end clients through directly operated Jimmy Choo stores. The Michael Kors segment sells Michael Kors products through four primary Michael Kors retail store formats such as Collection, Lifestyle, outlet stores, and e-commerce. The company was founded by Michael David Kors on December 13, 2002 and is headquartered in London, the United Kingdom. |
| Insider Trading |
Relationship |
Date |
Transaction |
Cost |
#Shares |
Value ($) |
#Shares Total |
SEC Form 4 |
| Hendricks Jenna | SVP, Chief People Officer | Dec 18 '23 | Option Exercise | 0.00 | 20,333 | 0 | 63,725 | Dec 20 06:00 PM | | IDOL JOHN D | Chairman & CEO | Dec 18 '23 | Option Exercise | 0.00 | 5,288 | 0 | 1,098,356 | Dec 20 06:02 PM | | Hendricks Jenna | SVP, Chief People Officer | Aug 01 '23 | Option Exercise | 0.00 | 736 | 0 | 43,800 | Aug 03 08:42 PM | | McDonough Krista A | SVP, GC & Chf Sustain Off | Jun 20 '23 | Option Exercise | 0.00 | 3,691 | 0 | 67,749 | Jun 22 03:34 PM | | Hendricks Jenna | SVP, Chief People Officer | Jun 20 '23 | Option Exercise | 0.00 | 1,845 | 0 | 44,085 | Jun 22 03:32 PM |
|
|
|
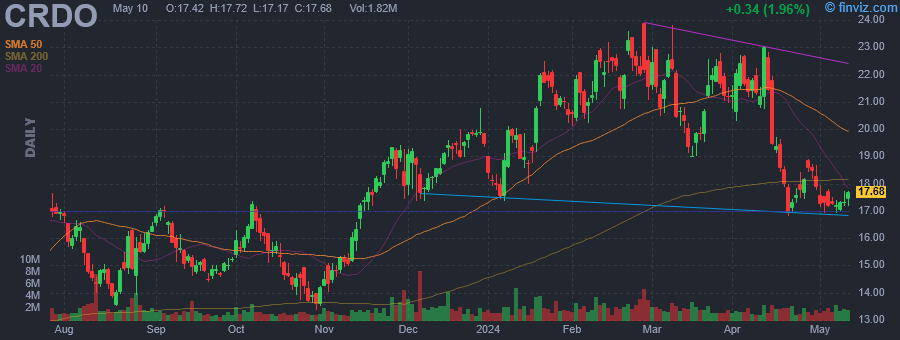 |
| Market Cap | 3.30B | EPS (ttm) | -0.23 |
| P/E | - | EPS this Y | 280.66% |
| Forward P/E | 30.07 | EPS next Y | 96.28% |
| PEG | - | EPS past 5Y | - |
| P/S | 20.10 | EPS next 5Y | 20.00% |
| P/B | 6.17 | EPS Q/Q | -85.56% |
| Dividend | - | Sales Q/Q | -2.23% |
| Insider Own | 22.29% | Inst Own | 73.46% |
| Insider Trans | -14.77% | Inst Trans | 54.35% |
| Short Float | 9.37% | Earnings | May 29/a |
| Analyst Recom | 1.50 | Target Price | 27.14 |
| Avg Volume | 1.83M | 52W Range | 13.06 - 23.90 |
|
|
|
|
Credo Technology Group Holding Ltd. engages in the development of connectivity solutions and products for the data infrastructure market. Its products include integrated circuits, active electrical cables, and SerDes chiplets. The company was founded by Chi Fung Cheng and Yat Tung Lam in September 2014 and is headquartered in George Town, Cayman Islands. |
| Insider Trading |
Relationship |
Date |
Transaction |
Cost |
#Shares |
Value ($) |
#Shares Total |
SEC Form 4 |
| Brennan William Joseph | Pres & Chief Executive Officer | Nov 17 '27 | Sale | 17.71 | 15,000 | 265,662 | 3,867,421 | Nov 17 08:52 PM | | Brennan William Joseph | Pres & Chief Executive Officer | Oct 24 '24 | Sale | 14.45 | 15,000 | 216,762 | 3,927,421 | Oct 24 05:51 PM | | Cheng Chi Fung | Chief Technology Officer | May 20 '24 | Sale | 19.07 | 55,000 | 1,048,998 | 9,663,602 | May 22 05:56 PM | | Brennan William Joseph | Pres & Chief Executive Officer | May 17 '24 | Sale | 19.21 | 15,000 | 288,104 | 2,917,500 | May 20 05:36 PM | | Brennan William Joseph | Pres & Chief Executive Officer | May 16 '24 | Sale | 18.87 | 15,000 | 283,076 | 2,932,500 | May 20 05:36 PM |
|
|
| |
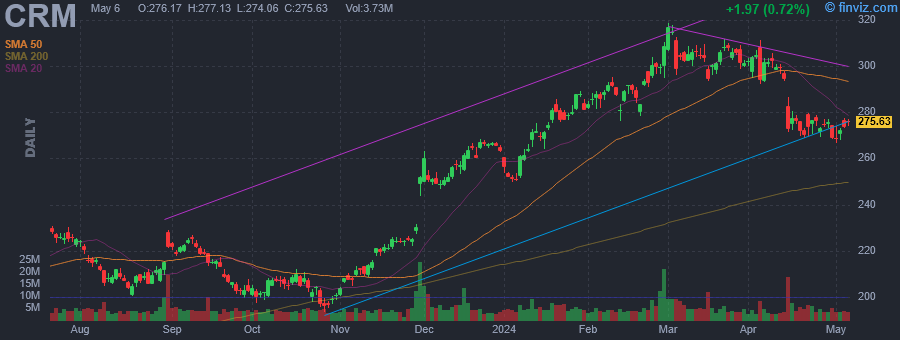 |
| Market Cap | 263.81B | EPS (ttm) | 4.21 |
| P/E | 64.59 | EPS this Y | 19.18% |
| Forward P/E | 24.55 | EPS next Y | 12.93% |
| PEG | 3.98 | EPS past 5Y | 24.06% |
| P/S | 7.57 | EPS next 5Y | 16.22% |
| P/B | 4.42 | EPS Q/Q | 1576.91% |
| Dividend | 0.13% | Sales Q/Q | 10.77% |
| Insider Own | 2.65% | Inst Own | 82.25% |
| Insider Trans | -11.51% | Inst Trans | -0.96% |
| Short Float | 1.02% | Earnings | May 29/a |
| Analyst Recom | 1.66 | Target Price | 336.34 |
| Avg Volume | 5.46M | 52W Range | 193.68 - 318.71 |
|
|
|
|
Salesforce, Inc. engages in the design and development of cloud-based enterprise software for customer relationship management. Its solutions include sales force automation, customer service and support, marketing automation, digital commerce, community management, collaboration, industry-specific solutions, and salesforce platform. The firm also provides guidance, support, training, and advisory services. The company was founded by Marc Russell Benioff and Parker Harris in 1999 and is headquartered in San Francisco, CA. |
| Insider Trading |
Relationship |
Date |
Transaction |
Cost |
#Shares |
Value ($) |
#Shares Total |
SEC Form 4 |
| Harris Parker | Co-Founder and CTO, Slack | May 28 '24 | Option Exercise | 118.04 | 4,200 | 495,768 | 119,962 | May 29 04:26 PM | | Benioff Marc | Chair and CEO | May 28 '24 | Sale | 269.32 | 15,000 | 4,039,789 | 12,437,327 | May 29 04:20 PM | | Harris Parker | Co-Founder and CTO, Slack | May 28 '24 | Sale | 269.26 | 4,200 | 1,130,888 | 115,762 | May 29 04:26 PM | | Benioff Marc | Chair and CEO | May 24 '24 | Sale | 271.73 | 15,000 | 4,075,924 | 12,452,327 | May 28 04:57 PM | | Benioff Marc | Chair and CEO | May 23 '24 | Sale | 280.06 | 15,000 | 4,200,857 | 12,467,327 | May 24 04:49 PM |
|
|
|
 |
| Market Cap | 8.33B | EPS (ttm) | 1.33 |
| P/E | 73.11 | EPS this Y | 29.20% |
| Forward P/E | 48.49 | EPS next Y | 16.26% |
| PEG | 3.61 | EPS past 5Y | 26.81% |
| P/S | 14.55 | EPS next 5Y | 20.25% |
| P/B | 6.72 | EPS Q/Q | 6.58% |
| Dividend | - | Sales Q/Q | 18.45% |
| Insider Own | 0.39% | Inst Own | 80.89% |
| Insider Trans | 0.00% | Inst Trans | 2.35% |
| Short Float | 0.73% | Earnings | May 29/a |
| Analyst Recom | 2.20 | Target Price | 100.13 |
| Avg Volume | 185.96K | 52W Range | 69.59 - 100.69 |
|
|
|
|
The Descartes Systems Group, Inc. engages in the provision of on-demand, software-as-a-service solutions focused on improving the productivity, performance and security of logistics-intensive businesses. It uses modular, software-as-a-service solutions to route, schedule, track and measure delivery resources; plan, allocate and execute shipments; rate, audit and pay transportation invoices; access global trade data; file customs and security documents for imports and exports; and complete numerous other logistics processes by participating in the world's largest, collaborative multimodal logistics community. The company was founded on May 22, 1981 and is headquartered in Waterloo, Canada. |
|
|
 |
| Market Cap | 32.09B | EPS (ttm) | 3.42 |
| P/E | 9.58 | EPS this Y | 4.31% |
| Forward P/E | 8.83 | EPS next Y | 8.53% |
| PEG | 2.52 | EPS past 5Y | 0.02% |
| P/S | 0.60 | EPS next 5Y | 3.80% |
| P/B | - | EPS Q/Q | 26.95% |
| Dividend | 3.37% | Sales Q/Q | -3.39% |
| Insider Own | 0.22% | Inst Own | 78.74% |
| Insider Trans | -10.46% | Inst Trans | -5.50% |
| Short Float | 2.15% | Earnings | May 29/a |
| Analyst Recom | 2.22 | Target Price | 33.68 |
| Avg Volume | 7.50M | 52W Range | 25.22 - 33.90 |
|
|
|
|
HP Inc. engages in the provision of personal computing and other access devices, imaging and printing products, and related technologies, solutions, and services. It operates through the following business segments: Personal Systems, Printing, and Corporate Investments. The Personal Systems segment offers commercial and consumer desktop and notebook personal computers, workstations, thin clients, commercial tablets and mobility devices, retail point-of-sale systems, displays and other related accessories, software, support, and services for the commercial and consumer markets. The Printing segment provides consumer and commercial printer hardware, supplies, solutions and services, and scanning devices. The Corporate Investments segment includes HP Labs and certain business incubation projects. The company was founded by William R. Hewlett and David Packard in 1939 and is headquartered in Palo Alto, CA. |
| Insider Trading |
Relationship |
Date |
Transaction |
Cost |
#Shares |
Value ($) |
#Shares Total |
SEC Form 4 |
| Bergh Charles V | Director | Apr 01 '24 | Option Exercise | 0.00 | 6,470 | 0 | 27,155 | Apr 03 05:01 PM | | BENNETT ROBERT R | Director | Mar 21 '24 | Sale | 30.01 | 67,000 | 2,010,670 | 60,216 | Mar 22 05:08 PM | | Liebman Stephanie | Global Controller | Mar 08 '24 | Sale | 30.93 | 8,708 | 269,338 | 0 | Mar 12 05:02 PM | | McQuarrie David P. | Chief Commercial Officer | Mar 05 '24 | Sale | 29.19 | 51,111 | 1,491,930 | 5,449 | Mar 07 05:18 PM | | Ludgate Kristen M | Chief People Officer | Mar 05 '24 | Sale | 29.24 | 41,015 | 1,199,279 | 56,169 | Mar 07 05:23 PM |
|
|
|
