 |
| Market Cap | 17.82M | EPS (ttm) | -2.61 |
| P/E | - | EPS this Y | 70.40% |
| Forward P/E | - | EPS next Y | 50.00% |
| PEG | - | EPS past 5Y | - |
| P/S | 0.03 | EPS next 5Y | - |
| P/B | - | EPS Q/Q | 82.41% |
| Dividend | - | Sales Q/Q | 2.81% |
| Insider Own | 40.33% | Inst Own | 16.52% |
| Insider Trans | -1.29% | Inst Trans | 23.64% |
| Short Float | 1.10% | Earnings | May 20/a |
| Analyst Recom | 1.00 | Target Price | 1.60 |
| Avg Volume | 561.41K | 52W Range | 0.19 - 13.84 |
|
|
|
|
Rubicon Technologies, Inc. engages in the operation of a digital marketplace that provides a suite of software products for waste, recycling, and smart city solutions. It operates through the following segments: Collection, Transfer, Landfill, Recycling, and Waste and Recycling Brokerage. The Collection segment is involved in collecting and transporting waste and recyclable materials from either commercial or residential communities to transfer stations, material recovery facilities or disposal sites. The Transfer segment focuses on reducing volume and making the transport to disposal sites more efficient. The Landfill segment includes municipal solid waste facilities that collect and bury whatever isn't sent to MRFs and are the main depositories for solid waste in North America. The Recycling segment offers facilities that extract reusable commodities out of waste to be repurposed for future use. The Waste and Recycling Brokerage segment engages in third parties that work on behalf of businesses to pair them with suitable waste hauling and recycling services. The company was founded by Nathaniel Morris in 2008 and is headquartered in Atlanta, GA. |
| Insider Trading |
Relationship |
Date |
Transaction |
Cost |
#Shares |
Value ($) |
#Shares Total |
SEC Form 4 |
| Palantir Technologies Inc. | Former 10% Owner | Apr 24 '24 | Sale | 0.37 | 18,621 | 6,972 | 5,233,625 | Apr 24 08:25 PM | | Palantir Technologies Inc. | Former 10% Owner | Apr 23 '24 | Sale | 0.37 | 18,471 | 6,792 | 5,252,246 | Apr 24 08:25 PM | | Palantir Technologies Inc. | Former 10% Owner | Apr 22 '24 | Sale | 0.34 | 3,200 | 1,089 | 5,270,717 | Apr 24 08:25 PM | | Palantir Technologies Inc. | 10% Owner | Apr 19 '24 | Sale | 0.34 | 12,086 | 4,143 | 5,273,917 | Apr 19 09:09 PM | | Palantir Technologies Inc. | 10% Owner | Apr 18 '24 | Sale | 0.33 | 16,140 | 5,283 | 5,286,003 | Apr 19 09:09 PM |
|
|
 |
 |
| Market Cap | 1.88M | EPS (ttm) | -5.52 |
| P/E | - | EPS this Y | - |
| Forward P/E | - | EPS next Y | - |
| PEG | - | EPS past 5Y | - |
| P/S | 0.14 | EPS next 5Y | - |
| P/B | 0.22 | EPS Q/Q | 75.38% |
| Dividend | - | Sales Q/Q | -20.16% |
| Insider Own | 16.09% | Inst Own | 6.38% |
| Insider Trans | 0.02% | Inst Trans | -92.28% |
| Short Float | 1.21% | Earnings | May 20/a |
| Analyst Recom | 1.00 | Target Price | 7.00 |
| Avg Volume | 1.56M | 52W Range | 0.24 - 5.20 |
|
|
|
May-20-24 08:52PM
|
RELI Stock Earnings: Reliance Global Group Reported Results for Q1 2024
(InvestorPlace) +5.50% |
|
04:05PM
|
Reliance Global Group Reports First Quarter 2024 Results and Provides Business Update
(GlobeNewswire) |
|
May-16-24 08:00AM
|
Reliance Global Group Schedules First Quarter 2024 Financial Results and Business Update Conference Call
(GlobeNewswire) -21.60% |
|
May-15-24 08:30AM
|
Reliance Global Group Announces Game-Changing Acquisition of Spetner Associates; Projected to Double Company's Revenue
(GlobeNewswire) +36.54% |
|
Apr-23-24 07:30AM
|
Reliance Global Group Inc.: Invitation to EF Hutton Annual Global Conference
(Newsfile) |
|
Apr-04-24 01:52PM
|
RELI Stock Earnings: Reliance Global Group Reported Results for Q4 2023
(InvestorPlace) +43.24% |
|
09:30AM
|
New to The Street TV Announces its Next Two Shows Broadcastings with Five Business Guest Interviews, Episode 566 Airs on Bloomberg TV as A Sponsored Programming Tonight, Thursday, April 4, 2024, at 9:30 PM PT, and Episode 567 Airs on The FOX Business Network, Monday, April 8, 2024, at 10:30 PM PT
(GlobeNewswire) |
|
08:00AM
|
Reliance Global Group's Revenue Grows by 17% and 40% in 2023 Compared to 2022 and 2021, respectively
(GlobeNewswire) |
|
Apr-03-24 08:30AM
|
Reliance Global Group Schedules Fourth Quarter 2023 Financial Results and Business Update Conference Call
(GlobeNewswire) |
|
Jan-30-24 08:30AM
|
RELI Exchange Launches the Client Referral Portal into its Proprietary InsurTech Platform
(GlobeNewswire) -7.88% |
|
Reliance Global Group, Inc. is a diversified company, which engages in the business of insurance market and other relates sectors. It focuses on acquisition strategy, wholesale, and retail insurance agencies. The company was founded on August 2, 2013 and is headquartered in Lakewood, NJ. |
|
|
 |
| Market Cap | 13.50M | EPS (ttm) | -8.92 |
| P/E | - | EPS this Y | 87.02% |
| Forward P/E | - | EPS next Y | 6.00% |
| PEG | - | EPS past 5Y | -18.45% |
| P/S | 2.27 | EPS next 5Y | - |
| P/B | 0.49 | EPS Q/Q | -1314.15% |
| Dividend | - | Sales Q/Q | -42.34% |
| Insider Own | 18.51% | Inst Own | 7.58% |
| Insider Trans | 0.00% | Inst Trans | 77.89% |
| Short Float | 7.84% | Earnings | May 20/a |
| Analyst Recom | 1.00 | Target Price | 10.00 |
| Avg Volume | 848.13K | 52W Range | 2.94 - 26.00 |
|
|
|
|
Sidus Space, Inc. is a space-as-a-service company. The firm focuses on commercial satellite design, manufacture, launch planning, mission operations and in-orbit support, and data collection with a vision to demonstrate space operations for new technologies, and deliver data and predictive analytics to both domestic and global customers. The company was founded by Carol M. Craig on July 17, 2012 and is headquartered in Merritt Island, FL. |
|
| |
 |
| Market Cap | 1.59B | EPS (ttm) | 1.22 |
| P/E | 34.89 | EPS this Y | - |
| Forward P/E | - | EPS next Y | - |
| PEG | - | EPS past 5Y | -33.64% |
| P/S | 2.61 | EPS next 5Y | -12.95% |
| P/B | 0.90 | EPS Q/Q | 178.17% |
| Dividend | - | Sales Q/Q | 12.89% |
| Insider Own | 78.48% | Inst Own | 12.76% |
| Insider Trans | 0.00% | Inst Trans | 0.49% |
| Short Float | 0.68% | Earnings | May 20/a |
| Analyst Recom | 3.00 | Target Price | 43.00 |
| Avg Volume | 39.40K | 52W Range | 28.10 - 45.76 |
|
|
|
|
Taro Pharmaceutical Industries Ltd. engages in the development, manufacturing and marketing of prescribed and over-the-counter pharmaceutical products in the U.S., Canada and Israel. Its products include semi-solids formulations, such as creams and ointments and other dosage forms such as liquids, capsules and tablets, in the dermatological and topical, cardiovascular, neuropsychiatric and anti-inflammatory therapeutic categories. The company was founded in 1950 and is headquartered in Haifa Bay, Israel. |
|
|
 |
| Market Cap | 36.75B | EPS (ttm) | 2.08 |
| P/E | 27.43 | EPS this Y | -2.63% |
| Forward P/E | 18.53 | EPS next Y | 17.29% |
| PEG | 0.41 | EPS past 5Y | -3.22% |
| P/S | 5.86 | EPS next 5Y | 66.78% |
| P/B | 2.13 | EPS Q/Q | -38.82% |
| Dividend | 0.07% | Sales Q/Q | 102.20% |
| Insider Own | 0.01% | Inst Own | 38.17% |
| Insider Trans | 0.00% | Inst Trans | -2.59% |
| Short Float | 1.53% | Earnings | May 20/a |
| Analyst Recom | 1.25 | Target Price | 56.48 |
| Avg Volume | 3.95M | 52W Range | 30.70 - 57.90 |
|
|
|
|
Trip.com Group Ltd. engages in the provision of travel-related services. It provides hotel accommodations, airline tickets, packaged tours, corporate travel management services, property management systems and advertising services. The company was founded by Jian Zhang Liang, Min Fan, Nan Peng Shen and Qi Ji in June 1999 and is headquartered in Shanghai, China. |
|
| |
 |
| Market Cap | 1.10B | EPS (ttm) | 1.30 |
| P/E | 95.76 | EPS this Y | 10.59% |
| Forward P/E | 43.86 | EPS next Y | 8.43% |
| PEG | 3.83 | EPS past 5Y | 11.53% |
| P/S | 4.37 | EPS next 5Y | 25.00% |
| P/B | 5.02 | EPS Q/Q | 83.19% |
| Dividend | - | Sales Q/Q | 13.53% |
| Insider Own | 2.98% | Inst Own | 89.61% |
| Insider Trans | -4.73% | Inst Trans | 2.83% |
| Short Float | 2.02% | Earnings | May 20/a |
| Analyst Recom | 1.00 | Target Price | 123.20 |
| Avg Volume | 37.70K | 52W Range | 81.26 - 123.16 |
|
|
|
|
Transcat, Inc. engages in the provision of calibration and laboratory instrument services. It operates through the Service and Distribution segments. The Service segment offers calibration, repair, inspection, analytical qualifications, preventive maintenance, consulting, and other related services. The Distribution segment distributes professional grade tests, measurement, and control instrumentation. The company was founded in 1964 and is headquartered in Rochester, NY. |
| Insider Trading |
Relationship |
Date |
Transaction |
Cost |
#Shares |
Value ($) |
#Shares Total |
SEC Form 4 |
| Doheny Mark A. | Chief Operating Officer | Mar 30 '24 | Option Exercise | 0.00 | 1,681 | 0 | 6,462 | Apr 02 04:32 PM | | Rudow Lee D. | President and CEO | Mar 30 '24 | Option Exercise | 0.00 | 4,138 | 0 | 107,626 | Apr 02 04:31 PM | | Jenkins James M. | Chief Legal & Corp Dev Officer | Mar 30 '24 | Option Exercise | 0.00 | 1,411 | 0 | 6,760 | Apr 02 04:34 PM | | Conroy Theresa A. | Sr. VP, Human Resources | Mar 30 '24 | Option Exercise | 0.00 | 342 | 0 | 429 | Apr 02 04:33 PM | | DEVERELL SCOTT | Principal Accounting Officer | Mar 30 '24 | Option Exercise | 0.00 | 325 | 0 | 2,080 | Apr 02 04:32 PM |
|
|
|
 |
| Market Cap | 1.05B | EPS (ttm) | -0.11 |
| P/E | - | EPS this Y | 66.67% |
| Forward P/E | 35.83 | EPS next Y | 20.00% |
| PEG | - | EPS past 5Y | 4.71% |
| P/S | 4.56 | EPS next 5Y | -1.30% |
| P/B | 1.08 | EPS Q/Q | 52.68% |
| Dividend | - | Sales Q/Q | 42.23% |
| Insider Own | 0.98% | Inst Own | 6.39% |
| Insider Trans | 0.00% | Inst Trans | -70.93% |
| Short Float | 0.19% | Earnings | May 20/a |
| Analyst Recom | 1.00 | Target Price | 2.90 |
| Avg Volume | 245.71K | 52W Range | 1.40 - 2.50 |
|
|
|
|
Tuya, Inc. engages in developing smart cloud service and IoT-related software and hardware solutions. It specializes in product, protocol, region, and supplier agnostics. The company was founded by Liao Han Chen, Alex Yang, Ruixin Zhou, and Xue Ji Wang on June 16, 2014 and is headquartered in Hangzhou, China. |
|
| |
 |
| Market Cap | 16.15M | EPS (ttm) | -1.07 |
| P/E | - | EPS this Y | 52.42% |
| Forward P/E | 11.46 | EPS next Y | 120.34% |
| PEG | - | EPS past 5Y | - |
| P/S | 0.91 | EPS next 5Y | 10.00% |
| P/B | 0.27 | EPS Q/Q | -12.96% |
| Dividend | - | Sales Q/Q | -43.75% |
| Insider Own | 38.38% | Inst Own | 22.45% |
| Insider Trans | 3.74% | Inst Trans | 6.19% |
| Short Float | 0.36% | Earnings | May 20/a |
| Analyst Recom | 1.00 | Target Price | 3.00 |
| Avg Volume | 44.47K | 52W Range | 0.67 - 2.10 |
|
|
|
May-20-24 09:53PM
|
XELB Stock Earnings: Xcel Brands Beats EPS, Misses Revenue for Q1 2024
(InvestorPlace) -8.95% |
|
05:43PM
|
XCel Brands: Q1 Earnings Snapshot
(Associated Press Finance) |
|
05:33PM
|
Xcel Brands, Inc. Announces First Quarter 2024 Results
(GlobeNewswire) |
|
May-16-24 08:01AM
|
Xcel Brands to Host First Quarter 2024 Earnings Call on May 20
(GlobeNewswire) |
|
Apr-29-24 09:00AM
|
Keynotes, Educational Panels and 96 Companies to Present at the Planet MicroCap Showcase: VEGAS on April 30 - May 2, 2024 at the Paris Hotel & Casino in Las Vegas, NV
(ACCESSWIRE) +9.80% |
|
Apr-22-24 10:00AM
|
Home Collectible Brand Longaberger Weaves Two Iconic American Brands Together with its Newest Crayola Collaboration
(GlobeNewswire) |
|
Apr-16-24 09:53PM
|
XELB Stock Earnings: Xcel Brands Beats EPS, Misses Revenue for Q4 2023
(InvestorPlace) |
|
04:53PM
|
XCel Brands: Q4 Earnings Snapshot
(Associated Press Finance) |
|
04:33PM
|
Xcel Brands, Inc. Announces Fourth Quarter and Fiscal Year 2023 Results
(GlobeNewswire) |
|
08:00AM
|
Xcel Brands to Present at the Planet MicroCap Showcase: VEGAS 2024 on Wednesday, May 1, 2024 & 1x1 Meetings on Thursday, May 2, 2024
(ACCESSWIRE) |
|
XCel Brands, Inc. engages in the design, production, marketing, wholesale, and direct-to-consumer sales of branded apparel, footwear, accessories, jewelry, home goods and other consumer products. It owns and manages Isaac Mizrahi, Judith Ripka, Halston, C Wonder, Longaberger, and Lori Goldstein brands. The company was founded by Robert W. D'Loren on August 31, 1989 and is headquartered in New York, NY. |
| Insider Trading |
Relationship |
Date |
Transaction |
Cost |
#Shares |
Value ($) |
#Shares Total |
SEC Form 4 |
| DiSanto Mark | Director | Mar 15 '24 | Buy | 0.65 | 146,250 | 95,062 | 1,174,263 | Mar 19 09:26 PM | | D LOREN ROBERT W | CEO & Chairman | Mar 15 '24 | Buy | 0.65 | 146,250 | 95,062 | 1,885,240 | Mar 19 08:49 PM | | Burroughs Seth | EVP of BD Treasurer Secretary | Mar 15 '24 | Buy | 0.65 | 32,500 | 21,125 | 343,049 | Mar 19 08:48 PM |
|
|
|
 |
| Market Cap | 654.33M | EPS (ttm) | 0.65 |
| P/E | 7.57 | EPS this Y | -33.08% |
| Forward P/E | 6.43 | EPS next Y | 74.71% |
| PEG | - | EPS past 5Y | - |
| P/S | 2.05 | EPS next 5Y | - |
| P/B | 1.37 | EPS Q/Q | 82.10% |
| Dividend | - | Sales Q/Q | 7.74% |
| Insider Own | - | Inst Own | 5.93% |
| Insider Trans | - | Inst Trans | 4.18% |
| Short Float | 0.41% | Earnings | May 20/a |
| Analyst Recom | 2.00 | Target Price | 6.70 |
| Avg Volume | 236.68K | 52W Range | 3.90 - 6.44 |
|
|
|
|
Yalla Group Ltd. is a holding company, which engages in the development of voice-centric social networking and entertainment platform. It offers Yalla, a mobile application that features live voice chat rooms. The company was founded by Jin Tao Yang, Jian Feng Xu, and Xue Cai Feng on February 7, 2018 and is headquartered in Dubai, the United Arab Emirates. |
|
|
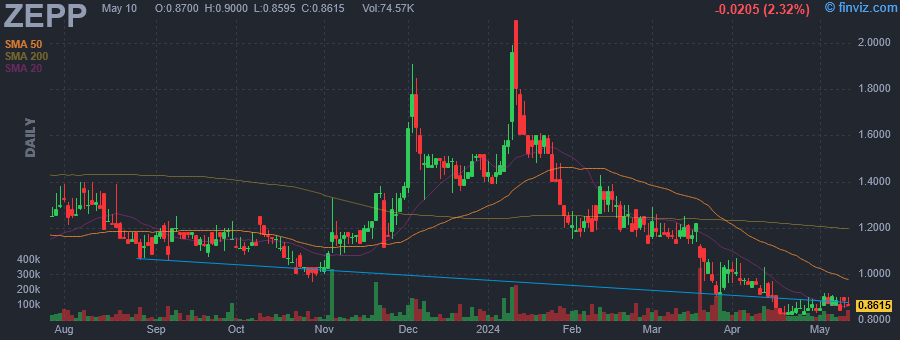 |
| Market Cap | 28.89M | EPS (ttm) | -0.50 |
| P/E | - | EPS this Y | 38.05% |
| Forward P/E | - | EPS next Y | 14.81% |
| PEG | - | EPS past 5Y | - |
| P/S | 0.08 | EPS next 5Y | 8.71% |
| P/B | 0.08 | EPS Q/Q | 88.87% |
| Dividend | - | Sales Q/Q | -44.91% |
| Insider Own | 0.59% | Inst Own | 28.66% |
| Insider Trans | 0.00% | Inst Trans | -2.53% |
| Short Float | 0.06% | Earnings | May 20/a |
| Analyst Recom | 1.00 | Target Price | 4.93 |
| Avg Volume | 65.77K | 52W Range | 0.82 - 2.10 |
|
|
|
|
Zepp Health Corp. engages in the development, manufacture, and sale of smart wearable technology devices. It operates through the Xiaomi Wearable Products, and Self-branded Products and Others segments. The Xiaomi Wearable Products segment is composed of sales of Xiaomi-branded products. The Self-branded Products and Others segment includes self-branded products. The company was founded by Huang Wang on December 27, 2013 and is headquartered in Hefei, China. |
|
|
