 |
| Market Cap | 248.07M | EPS (ttm) | -0.26 |
| P/E | - | EPS this Y | 111.43% |
| Forward P/E | 7.87 | EPS next Y | 13.96% |
| PEG | - | EPS past 5Y | - |
| P/S | 2.59 | EPS next 5Y | - |
| P/B | 0.92 | EPS Q/Q | 254.14% |
| Dividend | 4.67% | Sales Q/Q | 263.69% |
| Insider Own | 33.64% | Inst Own | 29.20% |
| Insider Trans | 1.77% | Inst Trans | 47.91% |
| Short Float | 0.15% | Earnings | Apr 29/a |
| Analyst Recom | 2.33 | Target Price | 8.17 |
| Avg Volume | 30.95K | 52W Range | 4.80 - 8.29 |
|
|
|
Today 05:30PM
|
Linkbancorp Insider Bought Shares Worth $1,912,500, According to a Recent SEC Filing
(MT Newswires) |
|
05:26PM
|
Linkbancorp Insider Sold Shares Worth $1,912,500, According to a Recent SEC Filing
(MT Newswires) |
|
May-09-24 04:10PM
|
LINKBANCORP, INC. Announces Sale of New Jersey Operations
(PR Newswire) |
|
May-07-24 04:15PM
|
LINKBANCORP Appoints Chief Risk Officer
(PR Newswire) |
|
Apr-29-24 10:53PM
|
LNKB Stock Earnings: Linkbancorp Misses EPS, Misses Revenue for Q1 2024
(InvestorPlace) |
|
05:54PM
|
Linkbancorp Inc (LNKB) Reports First Quarter Earnings for 2024
(GuruFocus.com) |
|
05:50PM
|
LINKBANCORP, Inc. (LNKB) Misses Q1 Earnings and Revenue Estimates
(Zacks) |
|
04:30PM
|
LINKBANCORP, Inc. Announces Record First Quarter Earnings
(PR Newswire) |
|
Apr-08-24 12:00PM
|
LINKBANCORP, Inc. (LNKB) Upgraded to Strong Buy: Here's What You Should Know
(Zacks) |
|
Feb-23-24 09:35AM
|
Down -10.16% in 4 Weeks, Here's Why LINKBANCORP, Inc. (LNKB) Looks Ripe for a Turnaround
(Zacks) |
|
LINKBANCORP, Inc. operates as bank holding company. It provides banking services through its subsidiaries. The company was founded in 2018 and is headquartered in Camp Hill, PA. |
| Insider Trading |
Relationship |
Date |
Transaction |
Cost |
#Shares |
Value ($) |
#Shares Total |
SEC Form 4 |
| Parmer George | Director | May 16 '24 | Buy | 8.50 | 225,000 | 1,912,500 | 563,722 | May 16 05:21 PM | | Parmer George | Director | May 16 '24 | Buy | 8.50 | 225,000 | 1,912,500 | 563,722 | May 16 05:20 PM | | Jones William Lloyd | Director | May 16 '24 | Buy | 6.50 | 2,500 | 16,250 | 12,377 | May 16 05:15 PM | | SAMUEL ANDREW S | CEO | May 16 '24 | Sale | 8.50 | 197,500 | 1,678,750 | 20,439 | May 16 05:24 PM | | SAMUEL ANDREW S | CEO | May 16 '24 | Sale | 8.50 | 27,500 | 233,750 | 0 | May 16 05:24 PM |
|
|
 |
 |
| Market Cap | 96.37B | EPS (ttm) | 12.18 |
| P/E | 27.85 | EPS this Y | 13.59% |
| Forward P/E | 10.60 | EPS next Y | 12.36% |
| PEG | 2.33 | EPS past 5Y | 10.54% |
| P/S | 0.47 | EPS next 5Y | 11.97% |
| P/B | 2.34 | EPS Q/Q | -122.82% |
| Dividend | 1.97% | Sales Q/Q | 19.28% |
| Insider Own | 1.82% | Inst Own | 89.88% |
| Insider Trans | -3.36% | Inst Trans | -1.59% |
| Short Float | 1.21% | Earnings | May 02/b |
| Analyst Recom | 1.54 | Target Price | 395.00 |
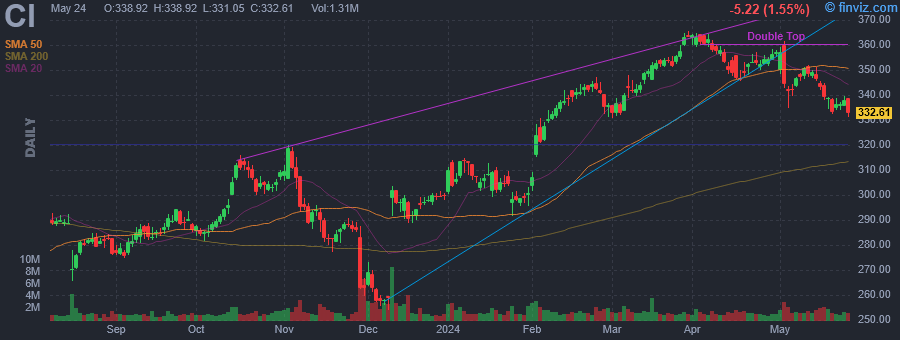
| Avg Volume | 1.52M | 52W Range | 240.50 - 365.71 |
|
|
|
|
The Cigna Group is a global health company, which engages in the provision of global health services. It operates through the following segments: Evernorth Health Services, Cigna Healthcare, Other Operations, and Corporate. The Evernorth Health Services segment partners with health plans, employers, governmental organizations, and health care providers to solve challenges in the areas of pharmacy benefits, home delivery pharmacy, specialty pharmacy, specialty distribution, and care delivery and management solutions. The Cigna Healthcare segment includes the U.S. Healthcare and International Health operating segments, which provide comprehensive medical and coordinated solutions to clients and customers. The Other Operations segment consists of the remainder of business operations, which includes certain ongoing businesses and exited businesses. The Corporate segment refers to net interest expense, certain litigation matters, expense associated with frozen pension plans, charitable contributions, operating severance, certain overhead and enterprise-wide project costs, and eliminations for products and services sold between segments. The company was founded in 1792 and is headquartered in Bloomfield, CT. |
| Insider Trading |
Relationship |
Date |
Transaction |
Cost |
#Shares |
Value ($) |
#Shares Total |
SEC Form 4 |
| Eder Noelle K | See Remarks | May 15 '24 | Option Exercise | 171.38 | 875 | 149,962 | 16,699 | May 16 05:22 PM | | Eder Noelle K | See Remarks | May 14 '24 | Option Exercise | 171.38 | 5,533 | 948,273 | 26,524 | May 16 05:22 PM | | Agoglia Hoeltzel Mary T | SVP Tax & Chief Acct. Officer | May 14 '24 | Option Exercise | 120.89 | 5,946 | 718,842 | 8,541 | May 16 05:22 PM | | Eder Noelle K | See Remarks | May 14 '24 | Sale | 348.47 | 10,700 | 3,728,629 | 15,824 | May 16 05:22 PM | | Agoglia Hoeltzel Mary T | SVP Tax & Chief Acct. Officer | May 14 '24 | Sale | 348.71 | 5,946 | 2,073,449 | 2,595 | May 16 05:22 PM |
|
|
|
 |
| Market Cap | 1.95B | EPS (ttm) | -1.79 |
| P/E | - | EPS this Y | 12.04% |
| Forward P/E | 18.16 | EPS next Y | 22.73% |
| PEG | - | EPS past 5Y | - |
| P/S | 1.19 | EPS next 5Y | 14.00% |
| P/B | 1.46 | EPS Q/Q | 370.64% |
| Dividend | - | Sales Q/Q | -1.02% |
| Insider Own | 2.22% | Inst Own | 98.81% |
| Insider Trans | 0.55% | Inst Trans | -3.28% |
| Short Float | 3.44% | Earnings | May 01/a |
| Analyst Recom | 2.00 | Target Price | 19.83 |
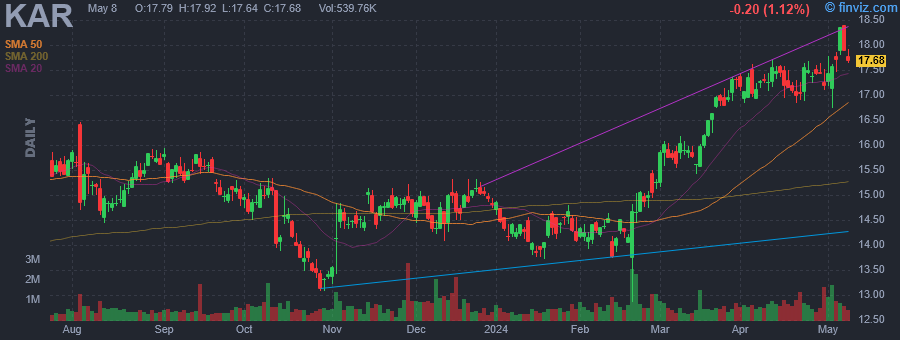
| Avg Volume | 832.58K | 52W Range | 12.86 - 18.41 |
|
|
|
|
OPENLANE, Inc. provides sellers and buyers across the global wholesale used vehicle industry with innovative, technology-driven remarketing solutions. The company's end-to-end platform supports whole car, financing, logistics and other ancillary and related services. It operates through the following segments: Marketplace and Finance. The Marketplace segment serves a domestic and international customer base through digital marketplaces and vehicle logistics center locations across Canada. The Finance segment provides short-term, inventory-secured financing, known as floorplan financing, primarily to independent dealer customers throughout the United States and Canada. The company was founded on November 9, 2006 and is headquartered in Carmel, IN. |
| Insider Trading |
Relationship |
Date |
Transaction |
Cost |
#Shares |
Value ($) |
#Shares Total |
SEC Form 4 |
| Coyle James P | EVP, President NA Marketplaces | May 15 '24 | Sale | 18.09 | 6,000 | 108,540 | 23,885 | May 16 05:20 PM | | Subrahmanyam Sriram | EVP Ops, Pres Svcs & Intl Mkts | May 09 '24 | Option Exercise | 0.00 | 20,000 | 0 | 60,855 | May 13 04:06 PM | | Kelly Peter J | Chief Executive Officer | May 09 '24 | Option Exercise | 0.00 | 49,025 | 0 | 396,380 | May 13 04:07 PM | | Coleman Charles S. | EVP, CLO & Secretary | May 09 '24 | Option Exercise | 0.00 | 15,000 | 0 | 42,578 | May 13 04:07 PM | | HALLETT JAMES P | Director | May 09 '24 | Option Exercise | 0.00 | 48,364 | 0 | 762,314 | May 13 04:07 PM |
|
|
| |
 |
| Market Cap | 652.04M | EPS (ttm) | -1.83 |
| P/E | - | EPS this Y | -25.99% |
| Forward P/E | - | EPS next Y | -34.37% |
| PEG | - | EPS past 5Y | 29.57% |
| P/S | 13.04 | EPS next 5Y | - |
| P/B | 2.50 | EPS Q/Q | 1.98% |
| Dividend | - | Sales Q/Q | 52.08% |
| Insider Own | 6.15% | Inst Own | 104.35% |
| Insider Trans | -29.39% | Inst Trans | -0.28% |
| Short Float | 13.51% | Earnings | May 08/b |
| Analyst Recom | 1.20 | Target Price | 38.78 |
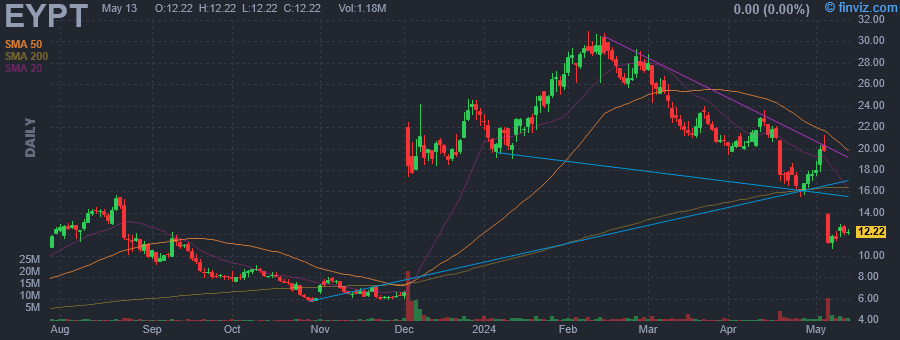
| Avg Volume | 1.18M | 52W Range | 5.67 - 30.99 |
|
|
|
|
EyePoint Pharmaceuticals, Inc. is a biopharmaceutical company, which engages in the development and commercialization of therapeutics that treat eye disorders. It offers FDA-approved sustained-release treatments in ophthalmology under the DEXYCU, ILUVIEN, Verisome, Retisert, and Durasert brands. The company was founded in 1987 and is headquartered in Watertown, MA. |
| Insider Trading |
Relationship |
Date |
Transaction |
Cost |
#Shares |
Value ($) |
#Shares Total |
SEC Form 4 |
| GUYER DAVID R | Director | May 14 '24 | Option Exercise | 3.34 | 9,775 | 32,646 | 17,175 | May 16 05:19 PM | | GUYER DAVID R | Director | May 14 '24 | Sale | 12.65 | 11,625 | 147,045 | 5,550 | May 16 05:19 PM | | Cormorant Asset Management, LP | 10% Owner | May 06 '24 | Buy | 11.86 | 850,000 | 10,081,721 | 8,325,000 | May 08 04:23 PM | | Cormorant Asset Management, LP | 10% Owner | Apr 18 '24 | Buy | 18.03 | 581,765 | 10,489,446 | 7,475,000 | Apr 22 04:00 PM | | Paggiarino Dario A. | Chief Medical Officer | Mar 30 '24 | Option Exercise | 0.00 | 50,404 | 0 | 92,626 | Apr 02 05:27 PM |
|
|
|
 |
| Market Cap | 215.69B | EPS (ttm) | 7.44 |
| P/E | 25.97 | EPS this Y | 17.96% |
| Forward P/E | 17.06 | EPS next Y | 13.91% |
| PEG | 2.30 | EPS past 5Y | - |
| P/S | 5.92 | EPS next 5Y | 11.29% |
| P/B | 8.83 | EPS Q/Q | 35.65% |
| Dividend | 1.74% | Sales Q/Q | 1.23% |
| Insider Own | 0.20% | Inst Own | 77.75% |
| Insider Trans | -4.26% | Inst Trans | -0.30% |
| Short Float | 1.84% | Earnings | May 01/a |
| Analyst Recom | 1.95 | Target Price | 190.43 |
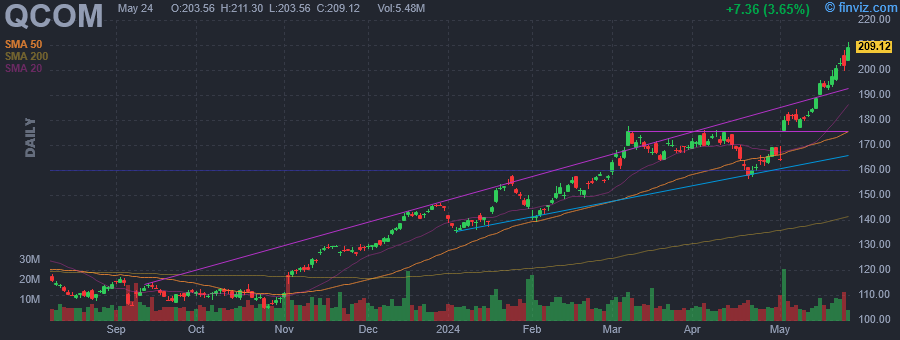
| Avg Volume | 8.15M | 52W Range | 101.47 - 196.08 |
|
|
|
|
QUALCOMM, Inc. engages in developing and commercializing foundational technologies and products used in mobile devices and other wireless products. It operates through the following segments: Qualcomm CDMA Technologies (QCT), Qualcomm Technology Licensing (QTL), and Qualcomm Strategic Initiatives (QSI). The QCT segment develops and supplies integrated circuits and system software based on technologies for use in voice and data communications, networking, application processing, multimedia, and global positioning system products. The QTL segment grants licenses and provides rights to use portions of the firm's intellectual property portfolio. The QSI segment focuses on opening new or expanding opportunities for its technologies and supporting the design and introduction of new products and services for voice and data communications. The company was founded by Franklin P. Antonio, Adelia A. Coffman, Andrew Cohen, Klein Gilhousen, Irwin Mark Jacobs, Andrew J. Viterbi, and Harvey P. White in July 1985 and is headquartered in San Diego, CA. |
| Insider Trading |
Relationship |
Date |
Transaction |
Cost |
#Shares |
Value ($) |
#Shares Total |
SEC Form 4 |
| AMON CRISTIANO R | President & CEO | May 15 '24 | Sale | 190.01 | 8,100 | 1,539,081 | 0 | May 16 05:19 PM | | ACEVEDO SYLVIA | Director | May 10 '24 | Sale | 181.52 | 744 | 135,074 | 0 | May 13 04:53 PM | | AMON CRISTIANO R | President & CEO | May 09 '24 | Sale | 181.00 | 8,100 | 1,466,100 | 8,100 | May 10 04:29 PM | | Palkhiwala Akash J. | CFO & COO | May 09 '24 | Sale | 180.69 | 3,000 | 542,055 | 66,343 | May 10 04:29 PM | | THOMPSON JAMES H | Chief Technology Officer | May 03 '24 | Sale | 182.00 | 8,000 | 1,456,000 | 253,893 | May 03 05:54 PM |
|
|
| |
 |
| Market Cap | 6.61B | EPS (ttm) | 3.98 |
| P/E | 11.23 | EPS this Y | -0.67% |
| Forward P/E | 9.60 | EPS next Y | 7.89% |
| PEG | - | EPS past 5Y | 1.26% |
| P/S | 1.39 | EPS next 5Y | -8.32% |
| P/B | 1.23 | EPS Q/Q | -28.08% |
| Dividend | 3.71% | Sales Q/Q | 11.63% |
| Insider Own | 1.65% | Inst Own | 77.39% |
| Insider Trans | -0.79% | Inst Trans | 2.23% |
| Short Float | 6.55% | Earnings | Apr 22/b |
| Analyst Recom | 3.00 | Target Price | 45.45 |
| Avg Volume | 2.66M | 52W Range | 23.68 - 46.15 |
|
|
|
|
Zions Bancorporation NA is a bank holding company, which engages in the provision of full banking and related services. It operates through the following segments: Zions Bank, Amegy Bank, California Bank & Trust, National Bank of Arizona, Nevada State Bank, Vectra Bank Colorado, and The Commerce Bank of Washington. The company was founded on February 17, 1961, and is headquartered in Salt Lake City, UT. |
| Insider Trading |
Relationship |
Date |
Transaction |
Cost |
#Shares |
Value ($) |
#Shares Total |
SEC Form 4 |
| Arbuckle Jason D. | SVP - Controller | May 16 '24 | Sale | 44.83 | 358 | 16,050 | 1,681 | May 16 05:19 PM | | Richards Robert Ryan | Controller | May 03 '24 | Option Exercise | 0.00 | 2,350 | 0 | 21,971 | May 06 04:35 PM | | Robinson Rebecca K | Executive Vice President | May 03 '24 | Sale | 43.66 | 5,291 | 231,005 | 22,238 | May 06 04:35 PM | | Forney Alan M | Exec VP & Division CEO | May 03 '24 | Sale | 43.68 | 1,500 | 65,520 | 22,181 | May 03 04:47 PM | | SIMMONS HARRIS H | Chairman & CEO | Feb 27 '24 | Buy | 38.54 | 4,000 | 154,160 | 1,312,987 | Feb 28 05:18 PM |
|
|
|
 |
| Market Cap | 34.70B | EPS (ttm) | 19.06 |
| P/E | 73.70 | EPS this Y | 19.77% |
| Forward P/E | 48.32 | EPS next Y | 23.13% |
| PEG | 3.00 | EPS past 5Y | 33.07% |
| P/S | 21.63 | EPS next 5Y | 24.55% |
| P/B | - | EPS Q/Q | 29.17% |
| Dividend | - | Sales Q/Q | 14.08% |
| Insider Own | 2.71% | Inst Own | 87.39% |
| Insider Trans | -7.21% | Inst Trans | -0.60% |
| Short Float | 2.51% | Earnings | Apr 25/a |
| Analyst Recom | 2.71 | Target Price | 1285.82 |
| Avg Volume | 181.72K | 52W Range | 745.45 - 1397.79 |
|
|
|
|
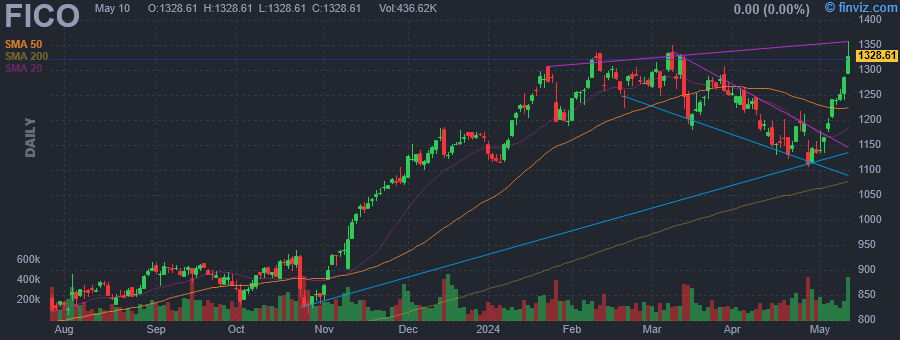
Fair Isaac Corp. engages in the provision of decision management solutions. It operates through the Software and Scores segments. The Software segment includes pre-configured analytic and decision management solutions designed for a specific type of business need or process. The Scores segment focuses on business-to-business scoring solutions and services, business-to-consumer scoring solutions and services including myFICO solutions for consumers and associated professional services. The company was founded by Bill Fair and Earl Isaac in 1956 and is headquartered in San Jose, CA. |
| Insider Trading |
Relationship |
Date |
Transaction |
Cost |
#Shares |
Value ($) |
#Shares Total |
SEC Form 4 |
| Rees Joanna | Director | May 14 '24 | Sale | 1350.00 | 500 | 675,000 | 20,618 | May 16 05:17 PM | | Rees Joanna | Director | May 09 '24 | Sale | 1255.00 | 1,000 | 1,255,000 | 21,118 | May 13 04:47 PM | | LANSING WILLIAM J | President and CEO | Apr 16 '24 | Sale | 1140.55 | 8,000 | 9,124,370 | 12,638 | Apr 18 07:23 PM | | LANSING WILLIAM J | President and CEO | Mar 19 '24 | Sale | 1225.93 | 8,000 | 9,807,459 | 20,638 | Mar 21 05:54 PM | | LANSING WILLIAM J | President and CEO | Feb 20 '24 | Sale | 1259.91 | 8,000 | 10,079,255 | 28,638 | Feb 22 05:41 PM |
|
|
| |
 |
| Market Cap | 1.63B | EPS (ttm) | 2.23 |
| P/E | 16.23 | EPS this Y | 24.02% |
| Forward P/E | 12.82 | EPS next Y | 38.84% |
| PEG | - | EPS past 5Y | 5.71% |
| P/S | 1.90 | EPS next 5Y | - |
| P/B | 1.75 | EPS Q/Q | 6768.18% |
| Dividend | 0.33% | Sales Q/Q | 25.72% |
| Insider Own | 24.91% | Inst Own | 64.71% |
| Insider Trans | -0.68% | Inst Trans | -14.48% |
| Short Float | 3.01% | Earnings | Apr 24/a |
| Analyst Recom | 2.20 | Target Price | 42.25 |
| Avg Volume | 153.54K | 52W Range | 21.49 - 47.22 |
|
|
|
|
Live Oak Bancshares, Inc. is a bank holding company for Live Oak Banking Company, which operates as a national online platform for small business lending. It operates through the following segments: Banking, Fintech, and Other. The Banking segment provides financing services to small businesses nationwide in targeted industries and deposit-related services to small businesses, consumers, and other customers nationwide. The Fintech segment focuses on making strategic investments in emerging financial technology companies. The company was founded by James S. Mahan III on December 18, 2018 and is headquartered in Wilmington, NC. |
| Insider Trading |
Relationship |
Date |
Transaction |
Cost |
#Shares |
Value ($) |
#Shares Total |
SEC Form 4 |
| Bradford Tonya Williams | Director | May 15 '24 | Sale | 35.97 | 2,600 | 93,522 | 5,870 | May 16 05:16 PM | | Davis Micah S | Chief Marketing & Comm Officer | Mar 11 '24 | Sale | 39.87 | 8,613 | 343,421 | 43,864 | Mar 13 05:04 PM | | SUTHERLAND JOHN W. | Chief Accounting Officer | Mar 07 '24 | Sale | 40.66 | 10,500 | 426,891 | 46,603 | Mar 11 04:50 PM | | Petty Miltom Emmett | Director | Feb 29 '24 | Option Exercise | 4.40 | 30,000 | 132,000 | 131,941 | Mar 04 05:26 PM | | Petty Miltom Emmett | Director | Feb 29 '24 | Sale | 39.73 | 10,000 | 397,252 | 121,941 | Mar 04 05:26 PM |
|
|
|
 |
| Market Cap | 6.36B | EPS (ttm) | 7.00 |
| P/E | 8.59 | EPS this Y | 13.30% |
| Forward P/E | 6.95 | EPS next Y | 9.39% |
| PEG | - | EPS past 5Y | 30.73% |
| P/S | 0.85 | EPS next 5Y | -6.80% |
| P/B | 1.18 | EPS Q/Q | 0.96% |
| Dividend | - | Sales Q/Q | 2.28% |
| Insider Own | 2.76% | Inst Own | 98.59% |
| Insider Trans | -28.33% | Inst Trans | -3.20% |
| Short Float | 2.42% | Earnings | Apr 30/b |
| Analyst Recom | 2.56 | Target Price | 65.98 |
| Avg Volume | 762.48K | 52W Range | 37.23 - 62.64 |
|
|
|
|
Taylor Morrison Home Corp. engages in the business of residential homebuilding and the development of lifestyle communities. It operates through the following segments: East, Central, West, and Financial Services. The East segment includes operations in Atlanta, Charlotte, Chicago, Orlando, Raleigh, Southwest Florida, and Tampa regions. The Central segment consists of Austin, Dallas, Denver, and Houston. The West segment covers Bay Area, Phoenix, Sacramento, and Southern California. The Financial Services segment provides a number of finance-related services through mortgage lending operations. The company was founded on November 15, 2012 and is headquartered in Scottsdale, AZ. |
| Insider Trading |
Relationship |
Date |
Transaction |
Cost |
#Shares |
Value ($) |
#Shares Total |
SEC Form 4 |
| Palmer Sheryl | Chairman, President and CEO | May 15 '24 | Sale | 61.70 | 100,000 | 6,170,000 | 19,211 | May 16 05:14 PM | | LYON WILLIAM H | Director | Mar 28 '24 | Sale | 62.32 | 153,000 | 9,535,590 | 40,570 | Mar 29 07:35 PM | | LYON WILLIAM H | Director | Mar 22 '24 | Sale | 60.33 | 164,000 | 9,894,120 | 43,570 | Mar 25 04:18 PM | | Palmer Sheryl | Chairman, President and CEO | Mar 15 '24 | Sale | 56.61 | 100,000 | 5,661,000 | 119,211 | Mar 19 04:03 PM | | LYON WILLIAM H | Director | Mar 07 '24 | Sale | 58.16 | 46,668 | 2,714,211 | 2,577,316 | Mar 07 08:37 PM |
|
|
|
 |
| Market Cap | 1.60B | EPS (ttm) | 1.23 |
| P/E | 86.48 | EPS this Y | 12.98% |
| Forward P/E | 33.50 | EPS next Y | 9.66% |
| PEG | 9.50 | EPS past 5Y | -0.50% |
| P/S | 2.62 | EPS next 5Y | 9.10% |
| P/B | 3.34 | EPS Q/Q | -19.32% |
| Dividend | 1.66% | Sales Q/Q | 4.83% |
| Insider Own | 1.66% | Inst Own | 104.68% |
| Insider Trans | -7.65% | Inst Trans | -3.15% |
| Short Float | 4.77% | Earnings | May 07/a |
| Analyst Recom | 1.33 | Target Price | 120.50 |
| Avg Volume | 73.21K | 52W Range | 78.08 - 124.11 |
|
|
|
|
U.S. Physical Therapy, Inc. operates outpatient physical therapy clinics, which provide pre-and post-operative care and treatment for orthopedic-related disorders, sports-related injuries, preventative care, rehabilitation of injured workers and neurological-related injuries. It operates through the Physical Therapy Operations and Industrial Injury Prevention Services segments. The Physical Therapy Operations segment consists of physical therapy and occupational therapy clinics that provide pre-and postoperative care and treatment for orthopedic related disorders, sports-related injuries, preventive care, rehabilitation of injured workers and neurological injuries. The Industrial Injury Prevention Services segment includes onsite injury prevention and rehabilitation, performance optimization and ergonomic assessments. The company was founded in 1990 and is headquartered in Houston, TX. |
| Insider Trading |
Relationship |
Date |
Transaction |
Cost |
#Shares |
Value ($) |
#Shares Total |
SEC Form 4 |
| KUNTZ EDWARD L | Director | May 15 '24 | Sale | 107.57 | 2,500 | 268,925 | 3,280 | May 16 05:14 PM | | Williams Eric Joseph | Co-Chief Operations Officer | May 10 '24 | Sale | 104.22 | 2,500 | 260,550 | 16,814 | May 14 06:19 PM | | REEVE GRAHAM D. | COO | May 10 '24 | Sale | 105.46 | 1,724 | 181,813 | 6,970 | May 14 06:15 PM | | Binstein Richard | EVP Gen'l Counsel & Secretary | Mar 13 '24 | Sale | 106.55 | 2,000 | 213,100 | 15,006 | Mar 14 05:11 PM | | HENDRICKSON CAREY P | Chief Financial Officer | Mar 13 '24 | Sale | 107.28 | 1,800 | 193,103 | 21,186 | Mar 14 05:23 PM |
|
|
|
