 |
| Market Cap | 1.07B | EPS (ttm) | 2.00 |
| P/E | 8.25 | EPS this Y | -5.46% |
| Forward P/E | 8.38 | EPS next Y | -4.85% |
| PEG | - | EPS past 5Y | 22.91% |
| P/S | 3.94 | EPS next 5Y | -5.70% |
| P/B | 0.93 | EPS Q/Q | 19.84% |
| Dividend | 10.55% | Sales Q/Q | 27.08% |
| Insider Own | 0.64% | Inst Own | 49.80% |
| Insider Trans | 0.00% | Inst Trans | 1.52% |
| Short Float | 0.26% | Earnings | May 06/a |
| Analyst Recom | 2.33 | Target Price | 16.83 |
| Avg Volume | 327.94K | 52W Range | 12.16 - 16.94 |
|
|
| May-29-24 | Upgrade |
Wells Fargo |
Equal Weight → Overweight |
$16 → $17 |
|
|
|
Bain Capital Specialty Finance, Inc. is a closed-end, non-diversified management investment company. It engages in the business of capitalizing on opportunities within advisor's senior direct lending strategy, which seeks to provide risk-adjusted returns and current income to its stockholders by investing primarily in middle-market companies. The company was founded on October 5, 2015 and is headquartered in Boston, MA. |
|
 |
 |
| Market Cap | 871.58B | EPS (ttm) | 33.88 |
| P/E | 11.93 | EPS this Y | 10.48% |
| Forward P/E | 20.63 | EPS next Y | 3.19% |
| PEG | 0.51 | EPS past 5Y | 93.53% |
| P/S | 2.36 | EPS next 5Y | 23.30% |
| P/B | 1.52 | EPS Q/Q | -63.80% |
| Dividend | - | Sales Q/Q | 5.24% |
| Insider Own | 39.44% | Inst Own | 39.95% |
| Insider Trans | 0.00% | Inst Trans | - |
| Short Float | 0.82% | Earnings | May 06/b |
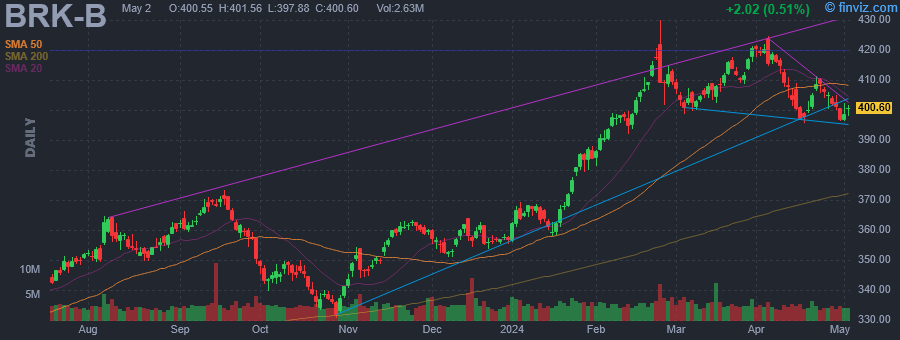
| Analyst Recom | 2.00 | Target Price | 465.11 |
| Avg Volume | 3.19M | 52W Range | 319.00 - 430.00 |
|
|
| May-29-24 | Upgrade |
Argus |
Hold → Buy |
$450 |
|
|
|
Berkshire Hathaway, Inc. is a holding company, which engages in the provision of property and casualty insurance and reinsurance, utilities and energy, freight rail transportation, finance, manufacturing, and retailing services. It operates through the following segments: Insurance, Burlington Northern Santa Fe, LLC (BNSF), Berkshire Hathaway Energy (BHE), Pilot Travel Centers (PTC), Manufacturing, McLane, and Service and Retailing. The Insurance segment includes the underwriting of GEICO, Berkshire Hathaway Primary Group, and Berkshire Hathaway Reinsurance Group. The BNSF segment involves the operation of railroad systems. The BHE segment focuses on regulated electric and gas utility, power generation and distribution, and real estate brokerage activities. The PTC segment consists of managing travel centers and marketing of wholesale fuel. The Manufacturing segment refers to industrial, consumer and building products, home building, and related financial services. The McLane segment covers the wholesale distribution of groceries and non-food items. The Service and Retailing segment relates to the provision of shared aircraft ownership programs, aviation pilot training, electronic components distribution, retailing businesses, automobile dealerships and trailer, and furniture leasing services. The company was founded by Oliver Chace in 1839 and is headquartered in Omaha, NE. |
| Insider Trading |
Relationship |
Date |
Transaction |
Cost |
#Shares |
Value ($) |
#Shares Total |
SEC Form 4 |
| BERKSHIRE HATHAWAY INC | 10% Owner | Apr 29 '24 | Buy | 25.47 | 311,637 | 7,936,272 | 70,002,897 | May 01 07:03 PM | | BERKSHIRE HATHAWAY INC | 10% Owner | Apr 26 '24 | Buy | 24.34 | 277,248 | 6,747,856 | 69,691,260 | Apr 26 08:20 PM | | BERKSHIRE HATHAWAY INC | 10% Owner | Apr 26 '24 | Buy | 24.46 | 219,303 | 5,364,327 | 35,182,219 | Apr 26 08:22 PM | | BERKSHIRE HATHAWAY INC | 10% Owner | Apr 25 '24 | Buy | 24.36 | 227,469 | 5,541,645 | 69,414,012 | Apr 26 08:20 PM | | BERKSHIRE HATHAWAY INC | 10% Owner | Apr 25 '24 | Buy | 24.43 | 157,309 | 3,842,681 | 34,962,916 | Apr 26 08:22 PM |
|
|
|
 |
| Market Cap | 929.79M | EPS (ttm) | 0.11 |
| P/E | 49.67 | EPS this Y | 124.87% |
| Forward P/E | 20.69 | EPS next Y | 56.40% |
| PEG | - | EPS past 5Y | - |
| P/S | 1.66 | EPS next 5Y | - |
| P/B | - | EPS Q/Q | 2497.75% |
| Dividend | - | Sales Q/Q | 48.60% |
| Insider Own | 11.33% | Inst Own | 27.84% |
| Insider Trans | 1.95% | Inst Trans | - |
| Short Float | 4.68% | Earnings | May 08/a |
| Analyst Recom | 1.00 | Target Price | 7.17 |
| Avg Volume | 3.61M | 52W Range | 2.61 - 6.10 |
|
|
| May-29-24 | Upgrade |
BTIG Research |
Neutral → Buy |
|
|
|
|
Core Scientific, Inc. engages in the business of operating a purpose-built facility for digital asset mining and provision of blockchain infrastructure, software solutions, and services. It operates under the Mining and Hosting segments. The Mining segment focuses on bitcoin mining for the company's own account. The Hosting segment includes blockchain infrastructure and third-party hosting business. The company was founded by Michael Jeffrey Levitt and Darin Feinstein on December 13, 2017 and is headquartered in Dover, DE. |
| Insider Trading |
Relationship |
Date |
Transaction |
Cost |
#Shares |
Value ($) |
#Shares Total |
SEC Form 4 |
| Sterling Denise Marie Brucia | Chief Financial Officer | May 13 '24 | Sale | 3.66 | 4,261 | 15,595 | 130,969 | May 15 04:02 PM | | Becker Todd A | Director | Mar 15 '24 | Buy | 3.16 | 130,000 | 410,163 | 134,250 | Mar 19 04:17 PM | | Patten Jarrod M | Director | Mar 15 '24 | Buy | 3.32 | 100,000 | 332,220 | 100,000 | Mar 19 04:17 PM | | Rozov Yadin | Director | Mar 15 '24 | Buy | 3.07 | 80,000 | 245,968 | 80,000 | Mar 18 07:45 PM | | Sullivan Adam Taylor | Chief Executive Officer | Mar 15 '24 | Buy | 3.06 | 65,300 | 199,962 | 93,753 | Mar 18 07:46 PM |
|
|
| |
 |
| Market Cap | 18.49B | EPS (ttm) | 12.07 |
| P/E | 18.73 | EPS this Y | 5.87% |
| Forward P/E | 15.43 | EPS next Y | 7.18% |
| PEG | 2.71 | EPS past 5Y | 30.34% |
| P/S | 1.40 | EPS next 5Y | 6.90% |
| P/B | 6.94 | EPS Q/Q | -2.88% |
| Dividend | 1.95% | Sales Q/Q | 6.20% |
| Insider Own | 31.56% | Inst Own | 69.65% |
| Insider Trans | -1.29% | Inst Trans | -2.16% |
| Short Float | 10.64% | Earnings | May 29/b |
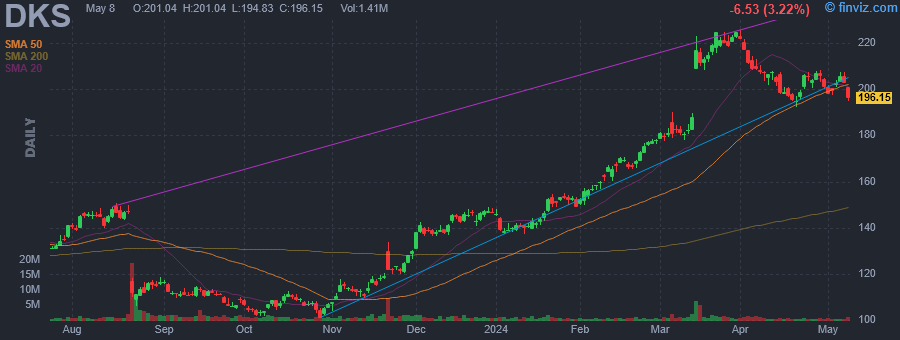
| Analyst Recom | 2.28 | Target Price | 242.76 |
| Avg Volume | 1.22M | 52W Range | 100.98 - 225.79 |
|
|
| May-29-24 | Upgrade |
BofA Securities |
Neutral → Buy |
$240 |
|
|
|
Dick's Sporting Goods, Inc. engages in the retailing of an extensive assortment of authentic sports equipment, apparel, footwear, and accessories. It also offers its products both online and through mobile applications. The company was founded by Richard T. Stack in 1948 and is headquartered in Coraopolis, PA. |
| Insider Trading |
Relationship |
Date |
Transaction |
Cost |
#Shares |
Value ($) |
#Shares Total |
SEC Form 4 |
| Gupta Navdeep | EVP, Chief Financial Officer | Mar 22 '24 | Option Exercise | 11.31 | 16,211 | 183,346 | 103,839 | Mar 22 07:06 PM | | Baran Elizabeth H. | SVP, General Counsel | Mar 22 '24 | Option Exercise | 11.31 | 2,175 | 24,599 | 13,226 | Mar 22 07:09 PM | | Gupta Navdeep | EVP, Chief Financial Officer | Mar 22 '24 | Sale | 222.00 | 16,211 | 3,598,891 | 87,628 | Mar 22 07:06 PM | | Baran Elizabeth H. | SVP, General Counsel | Mar 22 '24 | Sale | 221.78 | 2,175 | 482,372 | 11,051 | Mar 22 07:09 PM | | STACK EDWARD W | Executive Chairman | Mar 21 '24 | Option Exercise | 43.57 | 151,210 | 6,588,220 | 11,050,320 | Mar 22 04:15 PM |
|
|
|
 |
| Market Cap | 3.28B | EPS (ttm) | 0.57 |
| P/E | 28.22 | EPS this Y | 92.77% |
| Forward P/E | 13.27 | EPS next Y | 10.25% |
| PEG | - | EPS past 5Y | - |
| P/S | 3.16 | EPS next 5Y | - |
| P/B | 0.91 | EPS Q/Q | 50.36% |
| Dividend | - | Sales Q/Q | 11.65% |
| Insider Own | 0.94% | Inst Own | 77.26% |
| Insider Trans | 0.00% | Inst Trans | 3.27% |
| Short Float | 2.62% | Earnings | Apr 25/a |
| Analyst Recom | 2.00 | Target Price | 17.46 |
| Avg Volume | 1.66M | 52W Range | 8.30 - 16.69 |
|
|
| May-29-24 | Upgrade |
RBC Capital Mkts |
Sector Perform → Outperform |
$14 → $20 |
|
|
|
Eldorado Gold Corp. engages in the mining, development, and exploration of gold. It operates through the following segment: Turkey, Canada, and Greece. The company was founded by Richard J. Barclay, Marco Antonio Romero, and Gary D. Nordin on April 2, 1992 and is headquartered in Vancouver, Canada. |
|
| |
 |
| Market Cap | 5.64B | EPS (ttm) | 2.48 |
| P/E | 8.12 | EPS this Y | -10.00% |
| Forward P/E | 7.77 | EPS next Y | -7.50% |
| PEG | - | EPS past 5Y | 0.63% |
| P/S | 3.08 | EPS next 5Y | -0.90% |
| P/B | 0.82 | EPS Q/Q | 34.30% |
| Dividend | 12.58% | Sales Q/Q | -0.40% |
| Insider Own | 0.23% | Inst Own | 33.97% |
| Insider Trans | 2.57% | Inst Trans | - |
| Short Float | 1.33% | Earnings | May 08/a |
| Analyst Recom | 2.70 | Target Price | 20.61 |
| Avg Volume | 1.48M | 52W Range | 18.05 - 20.82 |
|
|
| May-29-24 | Upgrade |
Wells Fargo |
Equal Weight → Overweight |
$19 → $21 |
|
|
|
FS KKR Capital Corp. is a business development company specializing in investments in debt securities. It provides customized credit solutions to private middle market U.S. companies. It invest primarily in the senior secured debt and, to a lesser extent, the subordinated debt of private middle market U.S. companies. It seeks to purchase interests in loans through secondary market transactions or directly from the target companies as primary market investments. It also seeks to invest in first lien senior secured loans, second lien secured loans and, to a lesser extent, subordinated loans, or mezzanine loans. In connection with the debt investments, the firm also receives equity interests such as warrants or options as additional consideration. It also seek to purchase minority interests in the form of common or preferred equity in our target companies, either in conjunction with one of the debt investments or through a co-investment with a financial sponsor. Additionally, on an opportunistic basis, the fund may also invest in corporate bonds and similar debt securities. The fund does not seek to invest in start-up companies, turnaround situations, or companies with speculative business plans. It seeks to invest in small and middle-market companies based in United States. The fund seeks to invest in firms with annual revenue between $10 million to $2.5 billion. It focus on providing customized one-stop credit solutions to private upper middle market companies with annual EBITDA of $50 million to $100 million at the time of investment. It seeks to exit from securities by selling them in a privately negotiated over- the- counter market. For any investments that are not able to be sold within the secondary market, the firm seeks to exit such investments through repayment, an initial public offering of equity securities, merger, sale or recapitalization. |
| Insider Trading |
Relationship |
Date |
Transaction |
Cost |
#Shares |
Value ($) |
#Shares Total |
SEC Form 4 |
| Adams Barbara | Director | May 15 '24 | Buy | 20.10 | 3,381 | 67,957 | 22,082 | May 17 10:59 AM | | Sandler Elizabeth | Director | May 14 '24 | Buy | 20.07 | 1,000 | 20,070 | 6,700 | May 14 04:12 PM | | Sandler Elizabeth | Director | Feb 29 '24 | Buy | 18.80 | 1,000 | 18,799 | 5,700 | Mar 01 05:29 PM | | Pietrzak Daniel | Co-President and CIO | Feb 28 '24 | Buy | 18.73 | 7,300 | 136,729 | 39,800 | Feb 29 05:23 PM | | Pietrzak Daniel | Co-President and CIO | Feb 28 '24 | Buy | 18.76 | 2,700 | 50,652 | 17,700 | Feb 29 05:23 PM |
|
|
|
 |
| Market Cap | 3.92B | EPS (ttm) | 2.73 |
| P/E | 8.60 | EPS this Y | -22.33% |
| Forward P/E | 7.70 | EPS next Y | 23.75% |
| PEG | - | EPS past 5Y | 11.79% |
| P/S | 0.86 | EPS next 5Y | -0.60% |
| P/B | 2.06 | EPS Q/Q | -46.82% |
| Dividend | 1.20% | Sales Q/Q | -14.97% |
| Insider Own | 3.57% | Inst Own | 102.82% |
| Insider Trans | -7.56% | Inst Trans | -7.19% |
| Short Float | 8.71% | Earnings | Apr 17/a |
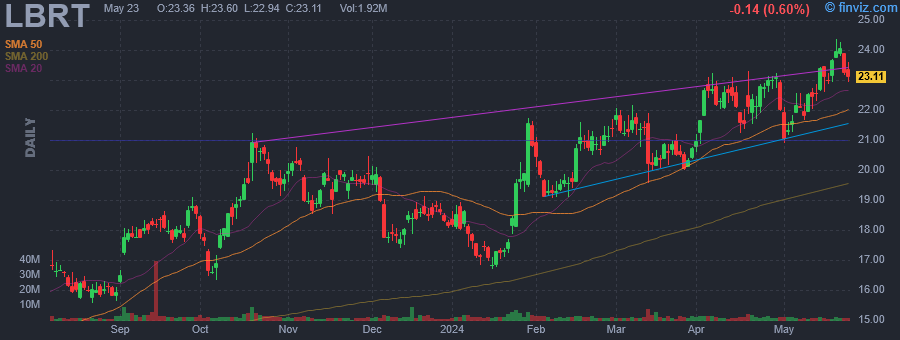
| Analyst Recom | 1.87 | Target Price | 26.00 |
| Avg Volume | 2.57M | 52W Range | 11.62 - 24.36 |
|
|
| May-29-24 | Upgrade |
Citigroup |
Neutral → Buy |
$24 → $32 |
|
|
|
Liberty Energy, Inc. engages in the provision of hydraulic fracturing services to onshore oil and natural gas exploration for production companies in North America. The company was founded on December 21, 2016 and is headquartered in Denver, CO. |
| Insider Trading |
Relationship |
Date |
Transaction |
Cost |
#Shares |
Value ($) |
#Shares Total |
SEC Form 4 |
| Gosney Ryan T | Chief Accounting Officer | May 20 '24 | Sale | 24.00 | 4,000 | 96,000 | 166,882 | May 20 06:08 PM | | Gosney Ryan T | Chief Accounting Officer | May 17 '24 | Sale | 23.50 | 2,000 | 47,000 | 170,882 | May 20 06:08 PM | | Wright Christopher A | Chairman of the Board and CEO | May 03 '24 | Sale | 21.64 | 20,000 | 432,800 | 2,818,814 | May 03 07:50 PM | | Wright Christopher A | Chairman of the Board and CEO | May 02 '24 | Sale | 21.39 | 20,000 | 427,800 | 2,838,814 | May 03 07:50 PM | | Stock Michael | Chief Financial Officer | May 01 '24 | Sale | 21.83 | 20,000 | 436,596 | 825,209 | May 01 04:29 PM |
|
|
| |
 |
| Market Cap | 3.51B | EPS (ttm) | -0.41 |
| P/E | - | EPS this Y | 153.86% |
| Forward P/E | 12.22 | EPS next Y | 93.04% |
| PEG | - | EPS past 5Y | - |
| P/S | 0.84 | EPS next 5Y | 8.00% |
| P/B | - | EPS Q/Q | 118.75% |
| Dividend | 0.12% | Sales Q/Q | 55.26% |
| Insider Own | 0.06% | Inst Own | 42.14% |
| Insider Trans | 0.00% | Inst Trans | 1.91% |
| Short Float | 2.18% | Earnings | Apr 30/b |
| Analyst Recom | 1.21 | Target Price | 10.43 |
| Avg Volume | 3.67M | 52W Range | 6.10 - 13.91 |
|
|
| May-29-24 | Upgrade |
BofA Securities |
Neutral → Buy |
$7.50 → $10.40 |
|
|
|
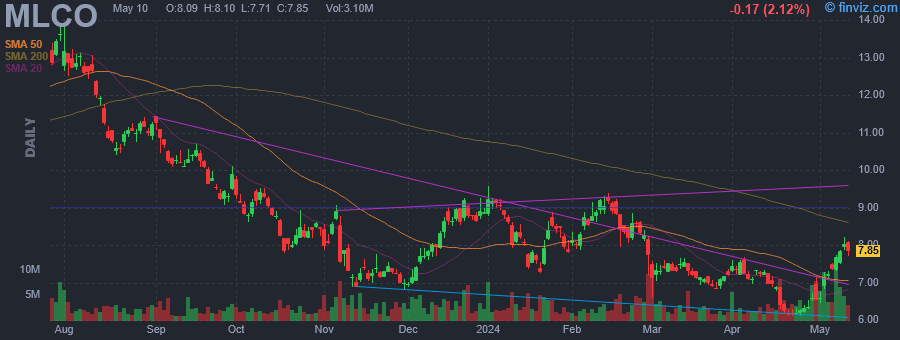
Melco Resorts & Entertainment Ltd. engages in the management and development of casino gaming and entertainment resort facilities. It focuses on the administration of Mocha Clubs, Altira Macau, City of Dreams, Studio City, and City of Dreams Manila. It operates through the following geographical segments: Macau, the Philippines, Cyprus, and Corporate and Other. The company was founded by Yau Lung Ho in December 2004 and is headquartered in Hong Kong. |
|
|
 |
| Market Cap | 7.07B | EPS (ttm) | 0.65 |
| P/E | 25.26 | EPS this Y | 103.26% |
| Forward P/E | 9.00 | EPS next Y | 28.77% |
| PEG | 0.51 | EPS past 5Y | -38.02% |
| P/S | 0.79 | EPS next 5Y | 49.20% |
| P/B | 19.54 | EPS Q/Q | 110.69% |
| Dividend | - | Sales Q/Q | 20.27% |
| Insider Own | 1.07% | Inst Own | 73.03% |
| Insider Trans | 0.00% | Inst Trans | -1.25% |
| Short Float | 6.78% | Earnings | May 01/b |
| Analyst Recom | 2.38 | Target Price | 20.74 |
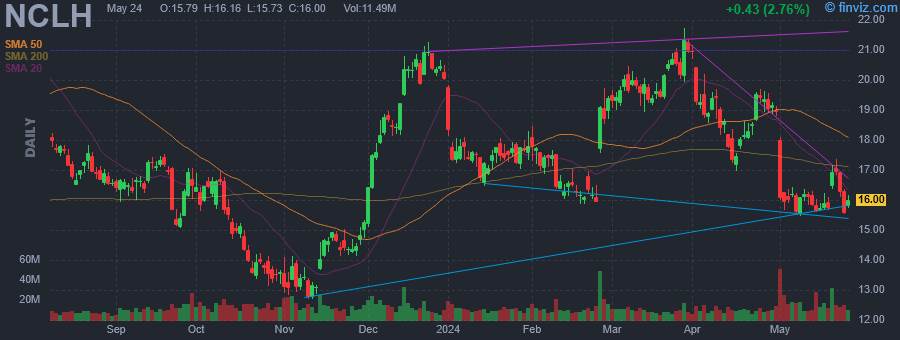
| Avg Volume | 13.54M | 52W Range | 12.70 - 22.75 |
|
|
| May-29-24 | Upgrade |
Truist |
Hold → Buy |
$20 → $21 |
|
|
|
Norwegian Cruise Line Holdings Ltd. engages in the provision of cruise travel services. It offers cruise experiences for travelers with itineraries in Europe, Asia, Australia, New Zealand, South America, Africa, Canada, Bermuda, Caribbean, Alaska and Hawaii. Its brands include Norwegian Cruise Line, Oceania Cruises, and Regent Seven Seas Cruises. The company was founded in 1966 and is headquartered in Miami, FL. |
| Insider Trading |
Relationship |
Date |
Transaction |
Cost |
#Shares |
Value ($) |
#Shares Total |
SEC Form 4 |
| Cil Jose E. | Director | May 22 '24 | Buy | 16.38 | 20,000 | 327,500 | 40,000 | May 23 04:16 PM | | Kempa Mark | EVP & CFO | Mar 08 '24 | Sale | 20.01 | 19,965 | 399,532 | 268,386 | Mar 11 04:30 PM | | Farkas Daniel S | EVP Gen. Counsel & Asst. Sec'y | Jun 15 '23 | Sale | 19.46 | 38,000 | 739,366 | 244,261 | Jun 16 04:30 PM | | Ashby Faye L. | SVP & Chief Accounting Officer | Jun 13 '23 | Sale | 19.45 | 15,811 | 307,587 | 174,619 | Jun 15 04:31 PM | | Del Rio Frank J | Pres. & CEO | Jun 12 '23 | Sale | 18.44 | 300,000 | 5,532,600 | 926,505 | Jun 13 04:30 PM |
|
|
|
 |
| Market Cap | 17.04B | EPS (ttm) | 8.10 |
| P/E | 6.40 | EPS this Y | 0.44% |
| Forward P/E | 4.36 | EPS next Y | 17.81% |
| PEG | 0.22 | EPS past 5Y | 0.56% |
| P/S | 0.31 | EPS next 5Y | 29.66% |
| P/B | 1.85 | EPS Q/Q | 36.26% |
| Dividend | - | Sales Q/Q | 9.71% |
| Insider Own | 0.52% | Inst Own | 75.62% |
| Insider Trans | -1.72% | Inst Trans | -5.72% |
| Short Float | 5.50% | Earnings | Apr 16/a |
| Analyst Recom | 1.48 | Target Price | 69.52 |
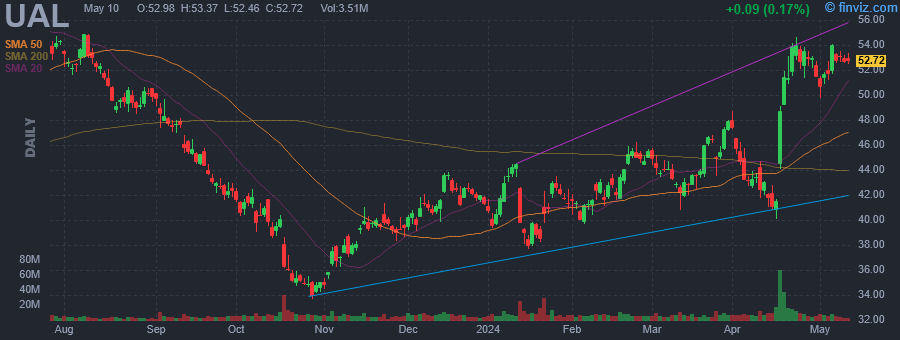
| Avg Volume | 9.56M | 52W Range | 33.68 - 58.23 |
|
|
| May-29-24 | Upgrade |
Jefferies |
Hold → Buy |
$54 → $65 |
|
|
|
United Airlines Holdings, Inc. is a holding company, which engages in the provision of transportation services. It operates through the following geographical segments: Domestic, Atlantic, Pacific, and Latin America. The company was founded on December 30, 1968 and is headquartered in Chicago, IL. |
| Insider Trading |
Relationship |
Date |
Transaction |
Cost |
#Shares |
Value ($) |
#Shares Total |
SEC Form 4 |
| Gebo Kate | EVP HR and Labor Relations | Apr 18 '24 | Sale | 50.86 | 15,000 | 762,915 | 57,512 | Apr 22 05:33 PM | | Gebo Kate | EVP HR and Labor Relations | Apr 18 '24 | Sale | 50.82 | 15,000 | 762,360 | 57,512 | Apr 22 05:33 PM | | Nocella Andrew P | EVP & Chief Commercial Officer | Feb 21 '24 | Option Exercise | 0.00 | 8,546 | 0 | 96,060 | Feb 23 05:21 PM | | Jojo Linda P | EVP & Chief Customer Officer | Feb 21 '24 | Option Exercise | 0.00 | 4,273 | 0 | 106,635 | Feb 23 05:21 PM | | KENNEDY JAMES A C | Director | Nov 07 '23 | Buy | 36.67 | 1,500 | 55,005 | 29,363 | Nov 08 07:42 PM |
|
|
|
