 |
| Market Cap | 2.60B | EPS (ttm) | 0.41 |
| P/E | 55.11 | EPS this Y | 47.71% |
| Forward P/E | 34.77 | EPS next Y | 17.84% |
| PEG | - | EPS past 5Y | -2.09% |
| P/S | 2.36 | EPS next 5Y | - |
| P/B | 1.83 | EPS Q/Q | -34.02% |
| Dividend | 8.01% | Sales Q/Q | -0.95% |
| Insider Own | 42.27% | Inst Own | 43.53% |
| Insider Trans | 0.00% | Inst Trans | -3.01% |
| Short Float | 3.54% | Earnings | May 08/b |
| Analyst Recom | 3.00 | Target Price | 22.17 |
| Avg Volume | 1.80M | 52W Range | 16.35 - 25.22 |
|
|
| Today | Downgrade |
UBS |
Buy → Neutral |
$25 → $22 |
|
|
|
Atlantica Sustainable Infrastructure Plc engages in the ownership, management, and acquisition of renewable energy. It specializes in the following businesses: Renewable Energy; Natural Gas; Electrical Transmission; and Water. The Renewable Energy business includes production of electricity from solar power and wind plants. The Natural Gas business offers electricity and steam from natural gas. The Electric Transmission business relates to the operation of electric transmission lines. The Water business is responsible for desalination plants related activities. The company was founded on December 17, 2013 and is headquartered in Brentford, United Kingdom. |
|
 |
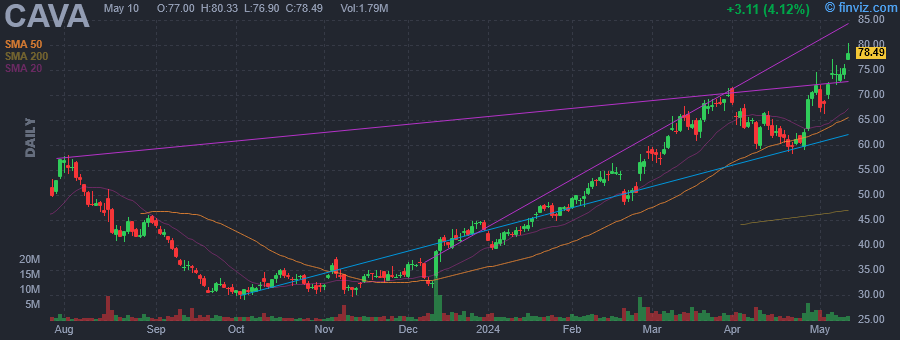 |
| Market Cap | 10.62B | EPS (ttm) | 0.25 |
| P/E | 366.16 | EPS this Y | 57.82% |
| Forward P/E | 213.44 | EPS next Y | 31.68% |
| PEG | 11.41 | EPS past 5Y | - |
| P/S | 13.54 | EPS next 5Y | 32.10% |
| P/B | 18.28 | EPS Q/Q | 730.85% |
| Dividend | - | Sales Q/Q | 27.54% |
| Insider Own | 20.66% | Inst Own | 72.09% |
| Insider Trans | -23.04% | Inst Trans | - |
| Short Float | 12.79% | Earnings | May 28/a |
| Analyst Recom | 1.93 | Target Price | 84.08 |
| Avg Volume | 2.67M | 52W Range | 29.05 - 89.69 |
|
|
| Today | Downgrade |
Piper Sandler |
Overweight → Neutral |
$63 → $92 |
|
|
|
Cava Group, Inc. is a holding company, which engages in the operation of restaurants. It operates through the following segments: CAVA, Zoes Kitchen, and Other. The CAVA segment represents the financial results of all CAVA restaurants. The Zoes Kitchen segment focuses on the financial results of all Zoes Kitchen locations. The company was founded by Brett Schulman, Ike Grigoropoulus, Dimitri Moshovitis, and Theodore Xenohristos in 2010 and is headquartered in Washington, DC. |
| Insider Trading |
Relationship |
Date |
Transaction |
Cost |
#Shares |
Value ($) |
#Shares Total |
SEC Form 4 |
| Xenohristos Theodoros | Director | Mar 26 '24 | Sale | 68.29 | 47,239 | 3,225,851 | 526,521 | Mar 28 04:01 PM | | Artal International S.C.A. | Director | Mar 21 '24 | Sale | 66.25 | 2,000,000 | 132,500,000 | 26,507,990 | Mar 25 04:15 PM | | SHAICH RONALD M | Former 10% Owner | Mar 04 '24 | Sale | 57.20 | 1,500,000 | 85,800,000 | 4,457,634 | Mar 06 04:00 PM | | Xenohristos Theodoros | Director | Feb 29 '24 | Sale | 58.51 | 4,500 | 263,295 | 0 | Mar 04 04:01 PM | | Artal International S.C.A. | Director | Feb 27 '24 | Sale | 53.60 | 3,500,000 | 187,600,000 | 28,507,990 | Feb 29 04:16 PM |
|
|
|
 |
| Market Cap | 6.92B | EPS (ttm) | 1.54 |
| P/E | 31.10 | EPS this Y | -18.00% |
| Forward P/E | 15.43 | EPS next Y | 39.02% |
| PEG | 4.38 | EPS past 5Y | - |
| P/S | 1.58 | EPS next 5Y | 7.10% |
| P/B | 2.37 | EPS Q/Q | -33.37% |
| Dividend | - | Sales Q/Q | -1.78% |
| Insider Own | 1.43% | Inst Own | 97.03% |
| Insider Trans | -7.45% | Inst Trans | 7.46% |
| Short Float | 3.85% | Earnings | Jun 06/b |
| Analyst Recom | 1.88 | Target Price | 57.30 |
| Avg Volume | 1.89M | 52W Range | 39.94 - 63.24 |
|
|
| Today | Downgrade |
Rosenblatt |
Buy → Neutral |
$65 → $52.50 |
|
|
|
Ciena Corp. engages in the provision of network and communication infrastructure. It operates through the following segments: Networking Platforms, Platform Software and Services, Blue Planet Automation Software and Services, and Global Services. The Networking Platforms segment consists of Converged Packet Optical and Packet Networking portfolios. The Platform Software and Services segment provides analytics, data, and planning tools to assist customers in managing Ciena's Networking Platforms products. The Blue Planet Automation Software and Services segment enables customers to implement large-scale software and IT-led OSS transformations by transforming legacy networks into "service ready" networks. The Global Services segment offers a broad suite of value-added services. The company was founded by Patrick H. Nettles and Kevin B. Kimberlin in 1992 and is headquartered in Hanover, MD. |
| Insider Trading |
Relationship |
Date |
Transaction |
Cost |
#Shares |
Value ($) |
#Shares Total |
SEC Form 4 |
| SMITH GARY B | President, CEO | May 15 '24 | Sale | 49.16 | 4,166 | 204,809 | 376,777 | May 17 02:56 PM | | Rothenstein David M | SVP and Chief Strategy Officer | May 15 '24 | Sale | 49.00 | 3,500 | 171,500 | 221,211 | May 17 02:52 PM | | Cumello Joseph | SVP, General Mgr. Blue Planet | May 15 '24 | Sale | 49.00 | 1,288 | 63,112 | 49,883 | May 17 10:25 AM | | SMITH GARY B | President, CEO | May 01 '24 | Sale | 46.66 | 4,166 | 194,366 | 380,943 | May 03 01:18 PM | | SMITH GARY B | President, CEO | Apr 15 '24 | Sale | 44.80 | 4,166 | 186,627 | 385,109 | Apr 17 05:49 PM |
|
|
| |
 |
| Market Cap | 25.25B | EPS (ttm) | 2.06 |
| P/E | 5.95 | EPS this Y | -12.04% |
| Forward P/E | 6.07 | EPS next Y | -5.55% |
| PEG | - | EPS past 5Y | 2.43% |
| P/S | 0.78 | EPS next 5Y | -5.50% |
| P/B | 1.41 | EPS Q/Q | -13.87% |
| Dividend | 10.80% | Sales Q/Q | -2.11% |
| Insider Own | 0.00% | Inst Own | 1.58% |
| Insider Trans | - | Inst Trans | -8.72% |
| Short Float | 0.48% | Earnings | May 07/a |
| Analyst Recom | 3.42 | Target Price | 12.08 |
| Avg Volume | 2.08M | 52W Range | 8.63 - 12.87 |
|
|
| Today | Downgrade |
BofA Securities |
Neutral → Underperform |
|
|
|
|
Ecopetrol SA engages in the exploration, development, and production of crude oil and natural gas. It operates through the following segments: Exploration and Production, Transportation and Logistics, and Refining and Petrochemicals. The Exploration and Production segment deals with oil and gas exploration and production activities. The Transportation and Logistics segment comprises of pipelines and other transportation activities. The Refining and Petrochemicals segment involves in refining activities and its products include motor fuels, fuel oils, and petrochemicals. The company was founded in 1948 and is headquartered in Bogota, Colombia. |
|
|
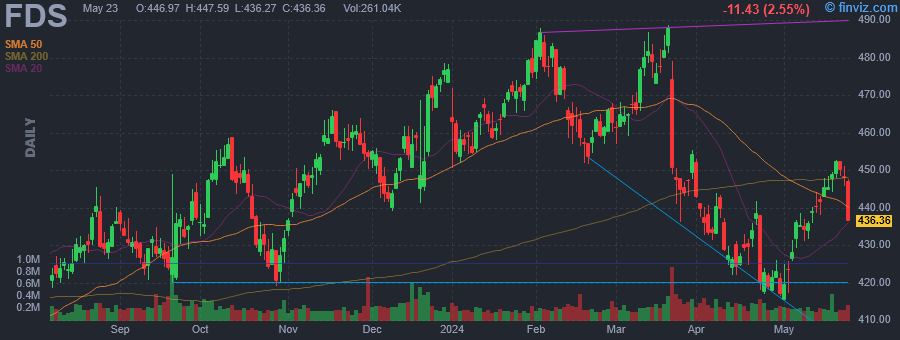 |
| Market Cap | 15.50B | EPS (ttm) | 12.63 |
| P/E | 32.19 | EPS this Y | 10.27% |
| Forward P/E | 23.14 | EPS next Y | 9.50% |
| PEG | 3.28 | EPS past 5Y | 12.16% |
| P/S | 7.19 | EPS next 5Y | 9.80% |
| P/B | 8.60 | EPS Q/Q | 8.02% |
| Dividend | 0.99% | Sales Q/Q | 5.99% |
| Insider Own | 0.22% | Inst Own | 93.51% |
| Insider Trans | -44.14% | Inst Trans | 0.94% |
| Short Float | 5.04% | Earnings | Mar 21/b |
| Analyst Recom | 3.09 | Target Price | 455.51 |
| Avg Volume | 259.68K | 52W Range | 380.96 - 488.64 |
|
|
| Today | Downgrade |
BofA Securities |
Neutral → Underperform |
$500 → $407 |
|
|
|
FactSet Research Systems Inc. (the Company or FactSet) is a global provider of integrated financial information, analytical applications and services for the investment and corporate communities. Since inception, global financial professionals have utilized the Company's content and multi-asset class solutions across each stage of the investment process. FactSet's goal is to provide a seamless user experience spanning idea generation, research, portfolio construction, trade execution, performance measurement, risk management, reporting, and portfolio analysis, in which the Company serves the front, middle, and back offices to drive productivity and improved performance. FactSet's flexible, open data and technology solutions can be implemented both across the investment portfolio lifecycle or as standalone components serving different workflows in the organization. FactSet is focused on growing the business throughout each of its three segments, the Americas, EMEA (formerly known as Europe), and Asia Pacific. The Company primarily delivers insight and information through the workflow solutions of Research, Analytics and Trading, Content and Technology Solutions (CTS) and Wealth. FactSet currently serves financial professionals, which include portfolio managers, investment research professionals, investment bankers, risk and performance analysts, wealth advisors and corporate clients. FactSet provides both insights on global market trends and intelligence on companies and industries, as well as capabilities to monitor portfolio risk and performance and to execute trades. The Company combines dedicated client service with open and flexible technology offerings, such as a configurable desktop and mobile platform, comprehensive data feeds, an open marketplace and digital portals and application programming interfaces (APIs). The Company's revenue is primarily derived from subscriptions to products and services such as workstations, analytics, enterprise data, and research management. FactSet Research Systems was founded by Howard E. Wille and Charles J. Snyder in September 1978 and is headquartered in Norwalk, CT. |
| Insider Trading |
Relationship |
Date |
Transaction |
Cost |
#Shares |
Value ($) |
#Shares Total |
SEC Form 4 |
| Skoko Goran | EVP, Dealmakers & Wealth | May 15 '24 | Sale | 445.81 | 1,500 | 668,715 | 3,762 | May 16 04:09 PM | | Skoko Goran | EVP, Dealmakers & Wealth | May 10 '24 | Option Exercise | 189.98 | 6,215 | 1,180,726 | 11,477 | May 10 05:02 PM | | Skoko Goran | EVP, Dealmakers & Wealth | May 10 '24 | Sale | 436.40 | 6,215 | 2,712,195 | 5,262 | May 10 05:02 PM | | Robie Robert J. | EVP, Institutional Buyside | May 06 '24 | Option Exercise | 234.63 | 3,466 | 813,223 | 5,821 | May 06 05:04 PM | | Robie Robert J. | EVP, Institutional Buyside | May 06 '24 | Sale | 431.48 | 4,336 | 1,870,897 | 1,485 | May 06 05:04 PM |
|
|
| |
 |
| Market Cap | 29.63B | EPS (ttm) | 9.54 |
| P/E | 29.02 | EPS this Y | 75.30% |
| Forward P/E | 13.29 | EPS next Y | 53.46% |
| PEG | 0.50 | EPS past 5Y | 41.58% |
| P/S | 8.31 | EPS next 5Y | 58.00% |
| P/B | 4.29 | EPS Q/Q | 454.63% |
| Dividend | - | Sales Q/Q | 44.83% |
| Insider Own | 5.66% | Inst Own | 90.26% |
| Insider Trans | -1.54% | Inst Trans | 2.01% |
| Short Float | 5.09% | Earnings | May 01/a |
| Analyst Recom | 1.53 | Target Price | 251.76 |
| Avg Volume | 2.44M | 52W Range | 129.21 - 286.60 |
|
|
| Today | Downgrade |
Mizuho |
Buy → Neutral |
$209 → $274 |
|
|
|
First Solar, Inc. is a solar technology company, which engages in the provision of solar modules. It is involved in the design, manufacture, and sale of cadmium tellurid (CdTe) solar modules, which convert sunlight into electricity. The company was founded by Michael J. Ahearn in 1999 and is headquartered in Tempe, AZ. |
| Insider Trading |
Relationship |
Date |
Transaction |
Cost |
#Shares |
Value ($) |
#Shares Total |
SEC Form 4 |
| STEBBINS PAUL H | Director | May 23 '24 | Sale | 250.35 | 4,000 | 1,001,400 | 20,817 | May 23 06:30 PM | | Chapman Richard D | Director | May 22 '24 | Sale | 248.95 | 7,264 | 1,808,373 | 10,440 | May 23 04:59 PM | | Stockdale Caroline | Chief People and Comm. Officer | May 21 '24 | Sale | 205.00 | 12,406 | 2,543,230 | 22,025 | May 22 07:07 PM | | Chapman Richard D | Director | May 09 '24 | Sale | 190.90 | 3,985 | 760,736 | 17,704 | May 13 08:57 PM | | Chapman Richard D | Director | May 09 '24 | Sale | 190.48 | 3,165 | 602,877 | 1,045 | May 13 08:57 PM |
|
|
|
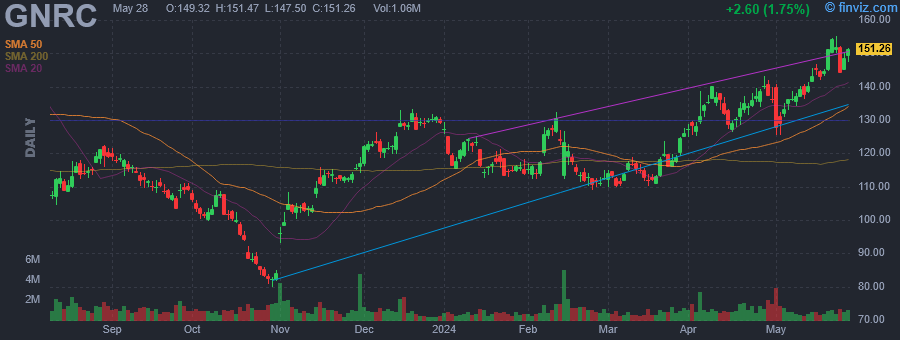 |
| Market Cap | 9.07B | EPS (ttm) | 3.63 |
| P/E | 41.23 | EPS this Y | 11.09% |
| Forward P/E | 19.34 | EPS next Y | 28.98% |
| PEG | 3.44 | EPS past 5Y | -1.56% |
| P/S | 2.25 | EPS next 5Y | 12.00% |
| P/B | 3.82 | EPS Q/Q | 610.40% |
| Dividend | - | Sales Q/Q | 0.15% |
| Insider Own | 1.72% | Inst Own | 90.08% |
| Insider Trans | -8.84% | Inst Trans | -1.01% |
| Short Float | 5.74% | Earnings | May 01/b |
| Analyst Recom | 2.18 | Target Price | 141.41 |
| Avg Volume | 1.07M | 52W Range | 79.86 - 156.95 |
|
|
| Today | Downgrade |
Guggenheim |
Neutral → Sell |
$120 |
|
|
|
Generac Holdings, Inc. engages in the business of designing and manufacturing energy technology solutions. It operates under the Domestic and International segments. The Domestic segment includes the legacy Generac business and the acquisitions that are based in the United States and Canada. The International segment focuses on Generac business' Latin American export operations. The company was founded in 1959 and is headquartered in Waukesha, WI. |
| Insider Trading |
Relationship |
Date |
Transaction |
Cost |
#Shares |
Value ($) |
#Shares Total |
SEC Form 4 |
| Forsythe Patrick John | Chief Technical Officer | May 23 '24 | Option Exercise | 50.96 | 65,855 | 3,355,870 | 85,670 | May 28 05:31 PM | | Forsythe Patrick John | Chief Technical Officer | May 23 '24 | Sale | 145.80 | 65,855 | 9,601,949 | 19,815 | May 28 05:31 PM | | Wilde Erik | EVP Industrial, NAM | May 22 '24 | Option Exercise | 43.88 | 4,384 | 192,370 | 22,281 | May 24 04:38 PM | | Wilde Erik | EVP Industrial, NAM | May 22 '24 | Sale | 154.04 | 4,384 | 675,306 | 17,897 | May 24 04:38 PM | | Nguyen Nam Tran | Director | May 13 '24 | Sale | 140.55 | 546 | 76,740 | 3,512 | May 14 04:31 PM |
|
|
| |
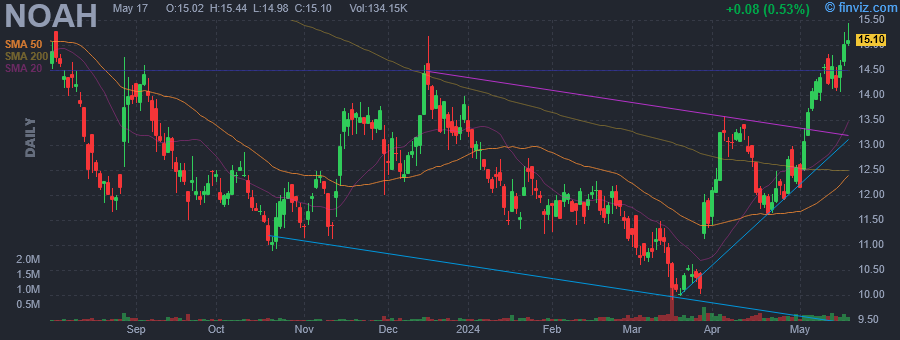 |
| Market Cap | 686.26M | EPS (ttm) | 9.98 |
| P/E | 1.04 | EPS this Y | -98.09% |
| Forward P/E | 4.56 | EPS next Y | 12.54% |
| PEG | - | EPS past 5Y | -0.41% |
| P/S | 1.56 | EPS next 5Y | - |
| P/B | 0.05 | EPS Q/Q | -48.95% |
| Dividend | 9.10% | Sales Q/Q | -23.05% |
| Insider Own | 5.00% | Inst Own | 36.77% |
| Insider Trans | 0.00% | Inst Trans | -0.77% |
| Short Float | 0.76% | Earnings | May 29/a |
| Analyst Recom | 1.43 | Target Price | 18.07 |
| Avg Volume | 191.64K | 52W Range | 9.90 - 17.39 |
|
|
| Today | Downgrade |
JP Morgan |
Overweight → Neutral |
$18 → $13 |
|
|
|
Noah Holdings Ltd. engages in the provision of investment advisory and wealth management services. It operates through the following segments: Wealth Management, Asset Management, and Other Businesses. The Wealth Management segment offers a global wealth investment and asset allocation services to high net worth individuals and enterprise clients in China. The Asset Management segment manages and develops financial products denominated in both RMB and U.S. dollars, covering real estate funds and funds of funds, including private equity, real estate, secondary market equity, and fixed income funds of funds. The Other Businesses segment operates metrics which include the loan volume and the number of borrowers for lending services business. The company was founded by Jing Bo Wang, Zhe Yin, and Bo Quan He in 2005 and is headquartered in Shanghai, China. |
|
|
 |
| Market Cap | 13.77B | EPS (ttm) | -0.08 |
| P/E | - | EPS this Y | 103.18% |
| Forward P/E | 40.16 | EPS next Y | 15.12% |
| PEG | - | EPS past 5Y | 9.62% |
| P/S | 6.57 | EPS next 5Y | - |
| P/B | - | EPS Q/Q | 78.99% |
| Dividend | - | Sales Q/Q | 16.94% |
| Insider Own | 0.40% | Inst Own | 83.98% |
| Insider Trans | -23.87% | Inst Trans | 0.65% |
| Short Float | 2.35% | Earnings | May 29/a |
| Analyst Recom | 1.75 | Target Price | 74.99 |
| Avg Volume | 2.36M | 52W Range | 26.47 - 73.69 |
|
|
| Today | Downgrade |
Northland Capital |
Outperform → Market Perform |
$71 |
|
|
Today 04:24PM
|
These Stocks Moved the Most Today: Salesforce, UiPath, HP Inc., Best Buy, Kohls, Foot Locker, C3.ai, Nutanix, and More
(Barrons.com) -23.10% |
|
04:20PM
|
Nutanix Plunges As Cloud Software Maker's Revenue Outlook Misses
(Investor's Business Daily) |
|
04:05PM
|
Nutanix to Present at Upcoming Investor Conference
(Business Wire) |
|
04:04PM
|
Nutanix Stock Plummets 22% on Mixed Earnings Report
(Motley Fool) |
|
02:36PM
|
These Stocks Are Moving the Most Today: Salesforce, UiPath, HP Inc., Best Buy, Kohls, Foot Locker, C3.ai, Nutanix, and More
(Barrons.com) |
|
02:33PM
|
Stocks to Watch Thursday: Salesforce, Kohl's, Tesla, Dell
(The Wall Street Journal) |
|
10:32AM
|
Nutanix (NTNX) Q3 Earnings Top Estimates, Revenues Rise Y/Y
(Zacks) |
|
08:34AM
|
Q3 2024 Nutanix Inc Earnings Call
(Thomson Reuters StreetEvents) |
|
07:20AM
|
Nutanix Earnings Beat. Cloud Software Maker's Revenue Outlook Misses.
(Investor's Business Daily) |
|
12:51AM
|
Nutanix shares fall 11% on soft outlook; KeyBanc reiterates bullish views
(Investing.com) |
|
Nutanix, Inc. engages in the provision of a cloud platform leveraging web-scale engineering and consumer-grade design. It operates through the following geographic segments: United States, Europe, the Middle East, Africa, Asia Pacific, and Other Americas. The firm also provides software solutions and cloud services to customers' enterprise infrastructure. The company was founded by Dheeraj Pandey, Ajeet Singh, and Mohit Aron in 2009 and is headquartered in San Jose, CA. |
| Insider Trading |
Relationship |
Date |
Transaction |
Cost |
#Shares |
Value ($) |
#Shares Total |
SEC Form 4 |
| Sivaraman Rukmini | Chief Financial Officer | Apr 10 '24 | Sale | 64.77 | 53,029 | 3,434,765 | 144,635 | Apr 11 04:37 PM | | Wall Tyler | Chief Legal Officer | Mar 21 '24 | Sale | 62.25 | 15,000 | 933,687 | 13,168 | Mar 25 04:14 PM | | RAMASWAMI RAJIV | President and CEO | Mar 18 '24 | Sale | 63.05 | 23,932 | 1,508,862 | 373,024 | Mar 19 06:41 PM | | Sangster David | Chief Operating Officer | Mar 18 '24 | Sale | 63.04 | 12,545 | 790,854 | 70,192 | Mar 19 06:36 PM | | Wall Tyler | Chief Legal Officer | Mar 15 '24 | Option Exercise | 0.00 | 16,826 | 0 | 34,382 | Mar 19 06:28 PM |
|
|
|
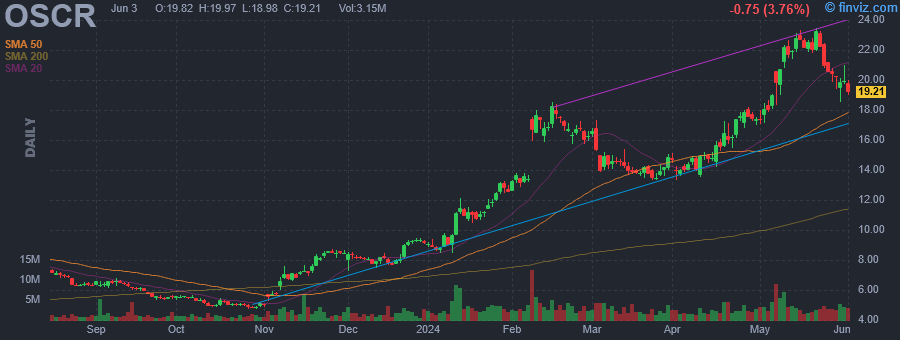 |
| Market Cap | 4.71B | EPS (ttm) | -0.42 |
| P/E | - | EPS this Y | 105.87% |
| Forward P/E | 38.05 | EPS next Y | 627.90% |
| PEG | - | EPS past 5Y | -2.85% |
| P/S | 0.72 | EPS next 5Y | - |
| P/B | 4.54 | EPS Q/Q | 429.17% |
| Dividend | - | Sales Q/Q | 45.77% |
| Insider Own | 20.60% | Inst Own | 52.72% |
| Insider Trans | -0.65% | Inst Trans | 2.27% |
| Short Float | 2.95% | Earnings | May 07/b |
| Analyst Recom | 2.33 | Target Price | 23.67 |
| Avg Volume | 3.05M | 52W Range | 4.72 - 23.44 |
|
|
| Today | Downgrade |
BofA Securities |
Buy → Neutral |
$25 → $21 |
| Today | Initiated |
Robert W. Baird |
Outperform |
$28 |
|
|
|
Oscar Health, Inc. is a health insurance company, which serves its customers through a technology platform. It offers individual and family, small group and medicare advantage plans, and technology platform to others within the provider and payor space. The company was founded by Mario Tobias Schlosser, Kevin Nazemi, and Joshua Kushner on October 25, 2012 and is headquartered in New York, NY. |
| Insider Trading |
Relationship |
Date |
Transaction |
Cost |
#Shares |
Value ($) |
#Shares Total |
SEC Form 4 |
| Blackley Richard Scott | Chief Financial Officer | Mar 06 '24 | Sale | 14.12 | 27,043 | 381,847 | 614,316 | Mar 07 04:18 PM | | Quane Alessandrea C. | EVP, Chief Insurance Officer | Mar 06 '24 | Sale | 14.12 | 13,233 | 186,850 | 212,850 | Mar 07 04:18 PM | | Baltrus Victoria | Chief Accounting Officer | Mar 04 '24 | Sale | 15.88 | 33,707 | 535,267 | 118,111 | Mar 05 04:22 PM | | Quane Alessandrea C. | EVP, Chief Insurance Officer | Mar 04 '24 | Sale | 15.88 | 15,928 | 252,937 | 194,833 | Mar 05 04:23 PM | | Blackley Richard Scott | Chief Financial Officer | Mar 04 '24 | Sale | 15.88 | 14,346 | 227,814 | 578,859 | Mar 05 04:23 PM |
|
|
|
